10 Best Gantt Chart Makers For Project Planning In 2026

10 Best Gantt Chart Maker Shortlist


The best Gantt chart makers let you plan and manage projects with a clear, visual timeline that makes it easy to map out tasks, manage dependencies, and track milestones. Without a Gantt chart, you'll miss deadlines, struggle to track progress accurately, and run into miscommunications that delay delivery and erode accountability.
I've used my 15+ years of experience in project management to thoroughly test and review 30+ Gantt chart maker tools. I've covered key features and use cases for each tool so you can find the right option that supports your team's workflows and helps you coordinate cross-functional teams, map out product launches, and juggle overlapping deadlines with control and clarity.
You Can Trust Our Gantt Chart Maker Reviews
We’ve been testing and reviewing Gantt chart maker software since 2012. As project managers ourselves, we know how critical and challenging it is to choose the right software.
We conduct deep research to help our audience make better purchasing decisions. We’ve tested over 2,000 tools for different project management use cases and written over 1,000 comprehensive software reviews. Learn how we stay transparent & our Gantt chart maker review methodology.
The Best Gantt Chart Maker Comparison Chart
Use this table to compare specs for my Gantt chart maker picks side-by-side.
| Tool | Best For | Trial Info | Price | ||
|---|---|---|---|---|---|
| 1 | Best for custom task views | Free plan available | From $7/user/month (billed annually) | Website | |
| 2 | Best for visual progress tracking | Free plan available | From $9/user/month (billed annually) | Website | |
| 3 | Best for interactive whiteboards | Free plan available | From $8/member/month (billed annually) | Website | |
| 4 | Best for easy-to-use templates | Free plan available | From $12/month (billed annually) | Website | |
| 5 | Best for design collaboration | Free plan available | From $3/editor/month (billed annually) | Website | |
| 6 | Best for visualizing task dependencies | Free plan + free demo available | From $10.99/user/month (billed annually) | Website | |
| 7 | Best for AI-powered work automation | 14-day free trial + free plan available | From $10/user/month (billed annually) | Website | |
| 8 | Best for detailed project planning | 30-day free trial | From $10/user/month (billed annually) | Website | |
| 9 | Best for data-driven presentations | 30-day free trial | From $21/user/month | Website | |
| 10 | Best for user-friendly interface | Free plan available | From $18/user/month | Website |


-

Celoxis
Visit WebsiteThis is an aggregated rating for this tool including ratings from Crozdesk users and ratings from other sites.4.4 -
Accelo
Visit WebsiteThis is an aggregated rating for this tool including ratings from Crozdesk users and ratings from other sites.4.4 -
Wrike
Visit WebsiteThis is an aggregated rating for this tool including ratings from Crozdesk users and ratings from other sites.4.3


Best Gantt Chart Maker Reviews
Here’s my summary of each Gantt chart software tool on my list:

ClickUp is a comprehensive work management solution that offers a Gantt chart maker among several other features like whiteboarding, goal setting, document management, and more.
I recently spoke with Jeff Cypher, a former ClickUp consultant who now works for the company. He spoke to ClickUp's flexibility when it comes to project changes. "I recommend ClickUp's Gantt view for project managers who need dynamic project adjustments," he says.
Why I Picked ClickUp
I picked ClickUp for its custom task views and Gantt charts. The platform's drag-and-drop interface lets you easily adjust tasks and dependencies and offers visual clarity on project timelines and potential roadblocks. With features like critical path and slack time, you can quickly identify and address scheduling challenges, which makes it easier to keep your projects on track. This customization and flexibility make ClickUp an ideal choice for teams that want to optimize their project management processes.
ClickUp Key Features
ClickUp offers a variety of other features for creating Gantt charts and managing projects.
- Milestones: You can track significant project achievements to make sure your team is meeting critical deadlines.
- Time Tracking: This lets you monitor the time spent on tasks directly within the platform to better manage your resources and deadlines.
- Task Priorities: You can assign priority levels to tasks to help your team focus on what's most important and keep projects moving smoothly.
- Multiple Assignees: This lets you assign tasks to multiple team members to foster collaboration and maintain accountability across your projects.
ClickUp Integrations
Integrations include Slack, Google Workspace, Dropbox, Figma, Vimeo, Zoom, Box, and Microsoft Teams. You can also use Zapier for additional integrations, or build custom integrations using the software's API.
Pros and Cons
Pros:
- Unlimited file storage with all paid plans
- 50+ widgets to customize your dashboard
- Unlimited users with free plan
Cons:
- Storage, projects, and custom fields limited in free plan
- Reporting not available in free plan
New Product Updates from ClickUp

ClickUp Introduces Brain² Company AI
ClickUp has introduced Brain², a self-improving company AI that routes to the best models and can complete work such as websites, slides, and project management tasks. For more information, visit ClickUp's official site.
 .
.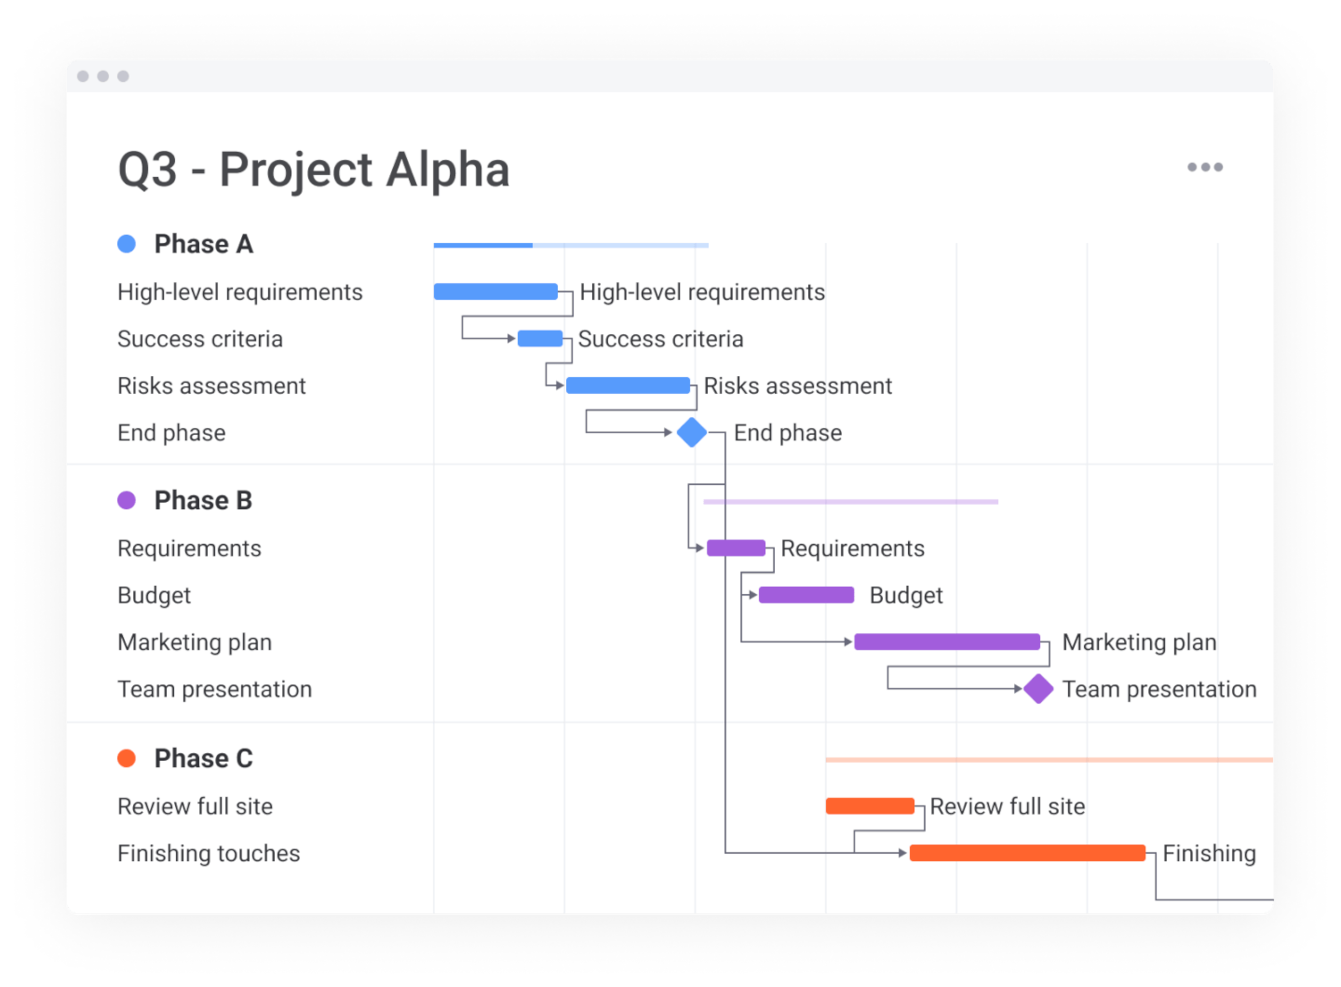
monday.com is a work management platform that offers a plethora of features for project planning and resource tracking, Gantt charts being one of them.
Why I Picked monday.com
I chose monday.com because it lets you track progress visually via its Gantt chart feature. The platform's customizable Gantt charts let you visualize timelines, prioritize tasks, and manage dependencies, as well as provide clarity and control over your projects.
Its interactive dashboards let you monitor progress, budgets, and deadlines at a glance, and allow for informed decision-making. These features, combined with real-time communication tools, make monday.com a strong choice for teams that want to improve project visibility and coordination.
monday.com Key Features
monday.com also offers a range of other features for creating Gantt charts and managing projects.
- Task Dependencies: You can easily visualize and manage the relationships between tasks, which prevents workflow bottlenecks and lets you maintain smooth project execution.
- Progress Tracking: This lets you monitor the health of your projects in real-time with visual indicators that show milestones and completion percentages.
- Resource Management: This feature lets you centralize timelines and responsibilities and allows for efficient allocation of resources and coordination across teams.
- Work Breakdown Structures: You can break down complex projects into manageable tasks, which helps with project planning and execution.
monday.com Integrations
Integrations include Dropbox, Excel, Google Calendar, Google Drive, Integromat, Slack, Trello, and even more through a paid plan with Zapier.
Pros and Cons
Pros:
- Complete work management platform
- Free-forever plan available
- User-friendly and intuitive interface
Cons:
- Gantt charts not included in basic or free plan
- Limited storage in basic and free plans
New Product Updates from monday AI Work Space

monday.com Adds Managed Columns Across Boards
monday.com adds Managed Column to let teams standardize and reuse column labels across multiple boards from a single source of truth. The update helps organizations maintain consistency, clarity, and centralized control at scale. For more information, visit monday.com’s official site.
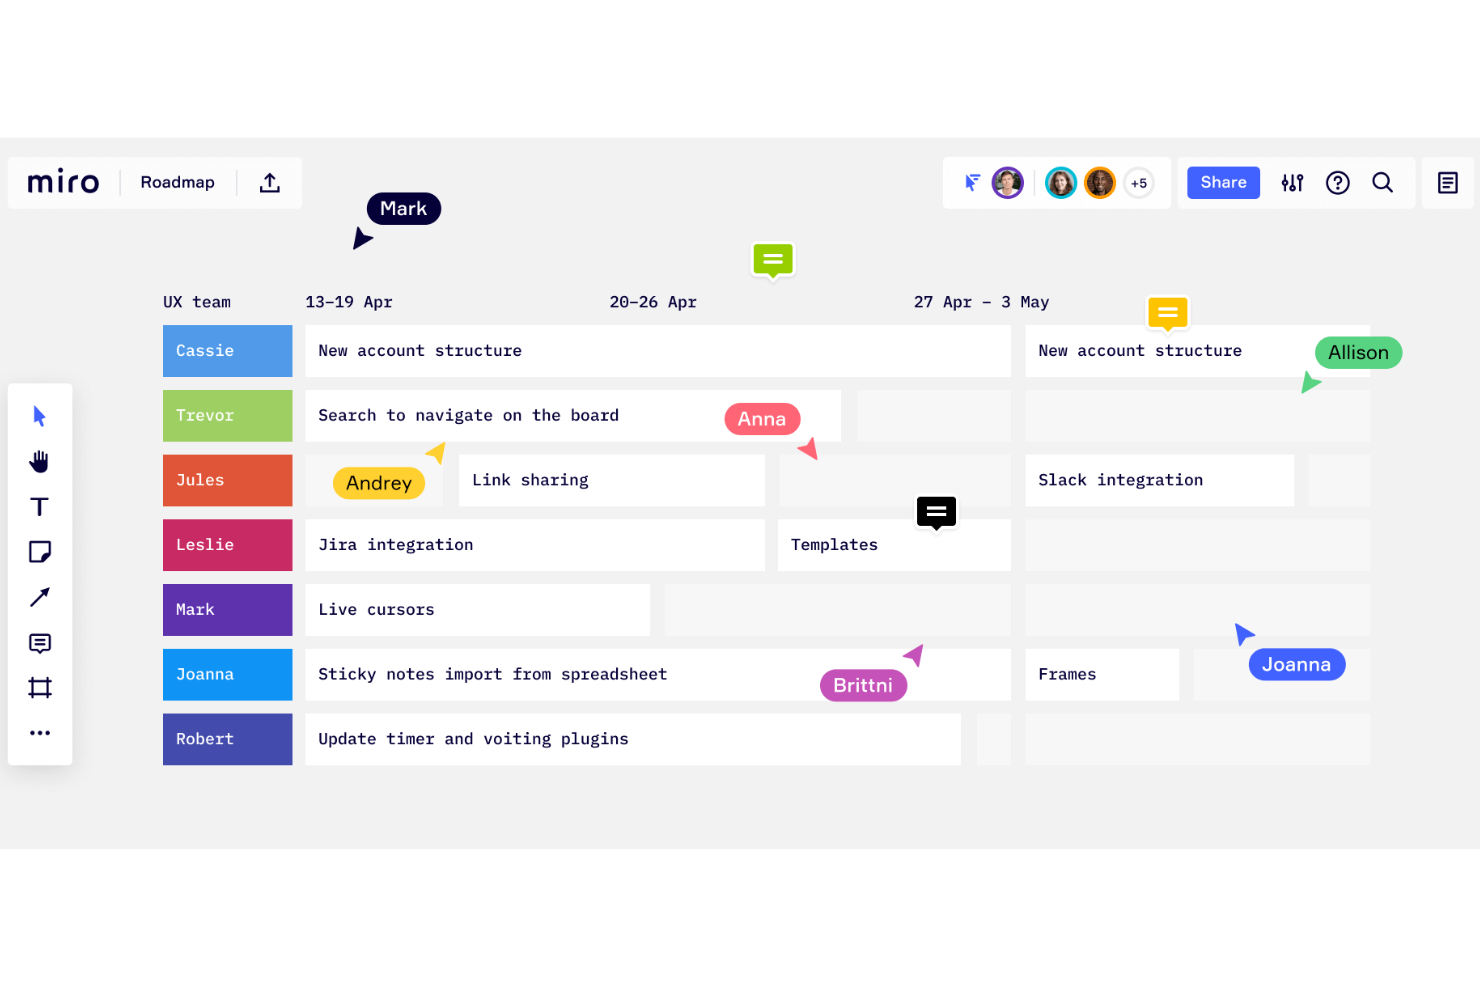
Miro is a collaborative online whiteboard with over 1,000 templates including mind maps, Kanban boards, Gantt charts, product wireframes, research boards, and flowcharts.
Why I Picked Miro
I picked Miro for its standout capability as an interactive whiteboard, which is perfect for creating Gantt charts. What I appreciate is how Miro lets your team visualize project timelines directly on a collaborative canvas and makes it easy to adjust tasks and deadlines in real time. The drag-and-drop functionality makes modifying your Gantt chart straightforward and keeps project planning dynamic and responsive.
Additionally, the ability to collaborate with team members in real-time means that input and updates are seamlessly integrated. This also keeps everyone on the same page without the hassle of back-and-forth communications.
Miro Key Features
Miro also offers several other features that make it useful for creating Gantt charts and managing projects.
- Effort Estimation: This feature lets you factor in people, time, and tools needed for tasks and helps you identify potential risks early in the project planning process.
- Milestones: You can set and celebrate milestones, which helps keep your team motivated and makes sure everyone stays aligned with the project's goals.
- Customizable Templates: This lets you start with ready-made templates or create charts from scratch and add tasks, timelines, and color-coding for better organization and clarity.
- AI Assistance: Miro's AI features can automatically structure timelines and tasks based on your input to save time and maintain accuracy.
Miro Integrations
Integrations include Zoom, Figma, Asana, Microsoft Teams, Jira, Slack, Google Drive, Box, Confluence, monday.com, Airtable, Notion, Azure, and Webex. Some integrations are limited to paid plans only.
Pros and Cons
Pros:
- Built-in communication features
- Intuitive and easy setup
- Free forever plan available
Cons:
- No high-quality PDF export with free plan
- Zooming can be jumpy on larger projects
New Product Updates from Miro
Miro Adds Japan Data Residency for Enterprise Customers
Miro has introduced Japan data residency for enterprise customers, offering in-region storage for production data, backups, and metadata, plus in-region compute infrastructure. For more information, visit Miro's official site.

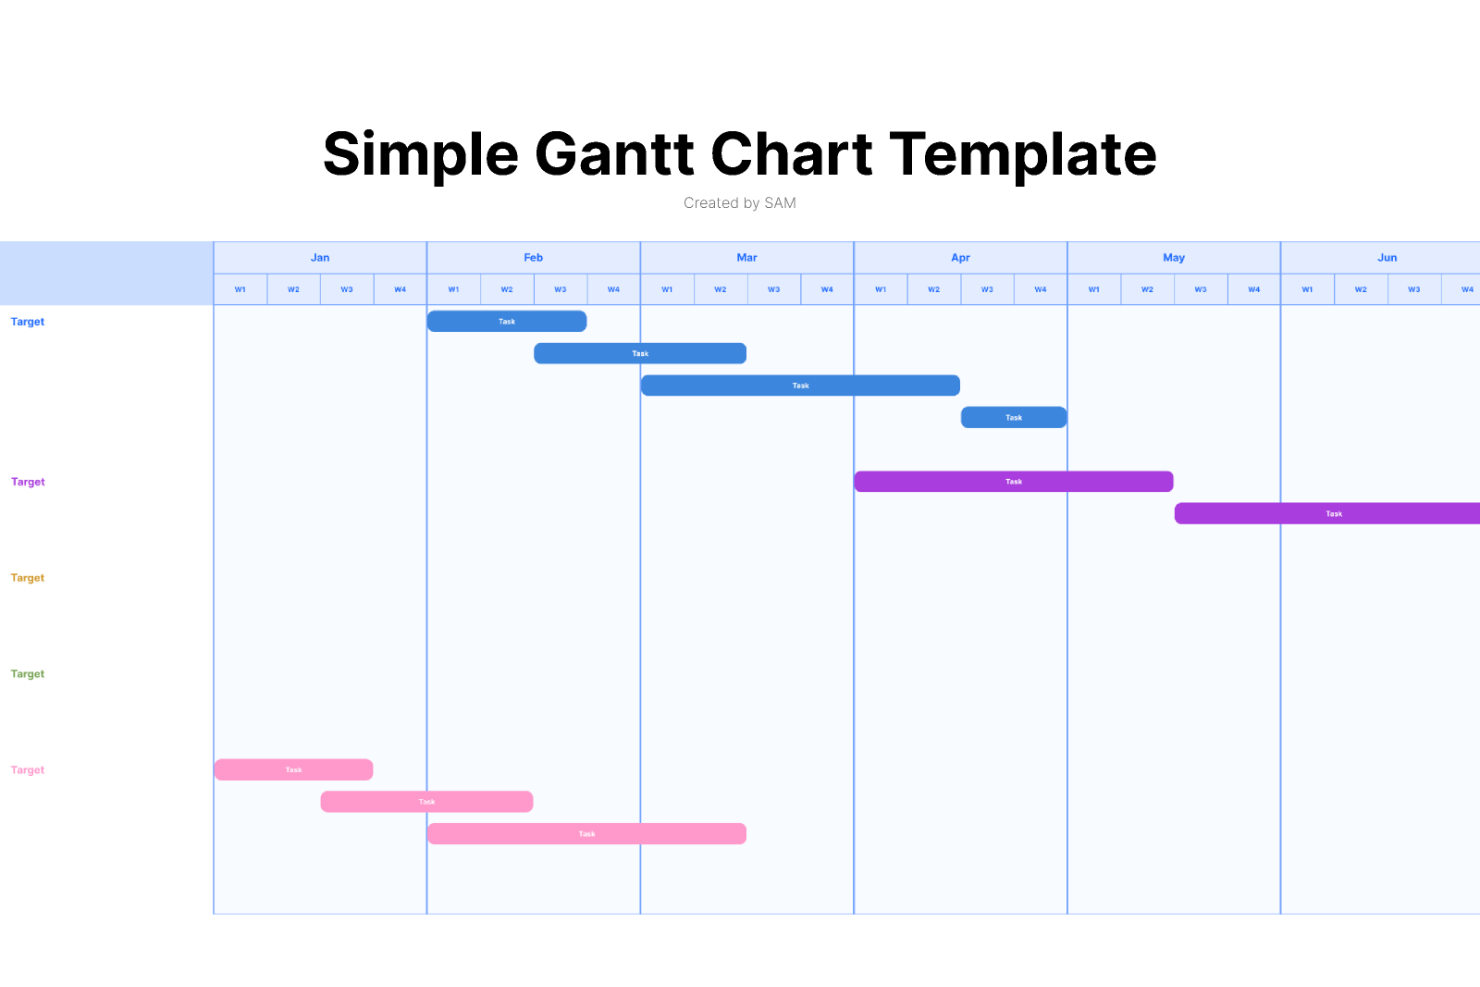
Canva is an online design platform built to be user-friendly for non-design experts. It offers templates for all kinds of things, from Gantt charts to slide decks, infographics, social media assets, and more.
Why I Picked Canva
I'm a big fan of this software's simple, straightforward drag-and-drop interface. It is easy to use, even for the least tech-savvy among us. I chose Canva for this list because it's intuitive and comes with a ton of templates that are ready to go. You can select from the hundreds of thousands of templates available, and customize them to meet your needs. In my opinion, Canva's free plan is a fantastic, quick way to create a presentation-ready Gantt chart at no cost. Plus, you'll be able to use the platform for other design needs too.
Canva Key Features
In addition to templates, Canva offers a range of other features that are useful for Gantt chart creation.
- Visual Customization Tools: You can easily adjust colors, fonts, and styles to match your brand and make your Gantt charts functional and visually appealing.
- Milestone Setting: This feature lets you mark significant points in your project timeline to help your team stay focused on key deliverables.
- Dependency Management: You can connect tasks to visualize dependencies and make sure your team understands the sequence of project activities.
- Collaboration Features: You and your team can edit and view changes simultaneously, which helps improve communication and teamwork.
Canva Integrations
Integrations include WordPress, eClincher, Rippling, Sendible, Post Planner, and Viraltag.
Pros and Cons
Pros:
- Presentable product, no designer needed
- Hundreds of thousands of templates
- Super user-friendly and intuitive
Cons:
- Limited download options with free plan
- Lacks advanced Gantt chart features
FigJam is an online whiteboard tool designed to facilitate real-time collaboration among team members, providing a dynamic platform for a variety of activities including brainstorming, diagramming, and strategic planning.
Why I Picked FigJam
I chose FigJam as a Gantt chart maker because of its capacity for real-time collaboration, which is crucial for maintaining up-to-date project timelines and ensuring team alignment. What makes FigJam different is its integration of AI features that can generate custom templates and automate repetitive tasks, which can be particularly useful when creating and updating Gantt charts.
I believe FigJam is best for real-time design team collaboration because it not only allows team members to work together synchronously with audio and live chat but also supports asynchronous communication through comments and reactions, ensuring that all team members, regardless of their location or time zone, can contribute to the project planning process.
FigJam Key Features
FigJam offers several other features that make it a compelling choice for Gantt chart software.
- Interactive Whiteboard: This lets your team collaborate in real-time, sketch out ideas and project plans directly on a digital canvas, and visualize complex project timelines.
- Milestone Visualization: You can track progress by marking key dates and deliverables within your project timeline and making sure everyone is aligned on project goals.
- Resource Management Tools: This lets you to allocate and track resources effectively (via templates), and maintain balance and efficiency across your project tasks.
- Task Assignment and Management: You can assign tasks to team members directly within the Gantt chart, which makes it easy to manage schedules and responsibilities.
FigJam Integrations
Integrations include Figma, Microsoft Teams, Asana, Jira, Mixpanel, and GitHub.
Pros and Cons
Pros:
- User-friendly and intuitive interface
- Integrates with Figma for design collaboration
- Offers community templates for various uses
Cons:
- Onboarding and account support locked to enterprise plan
- No offline access available
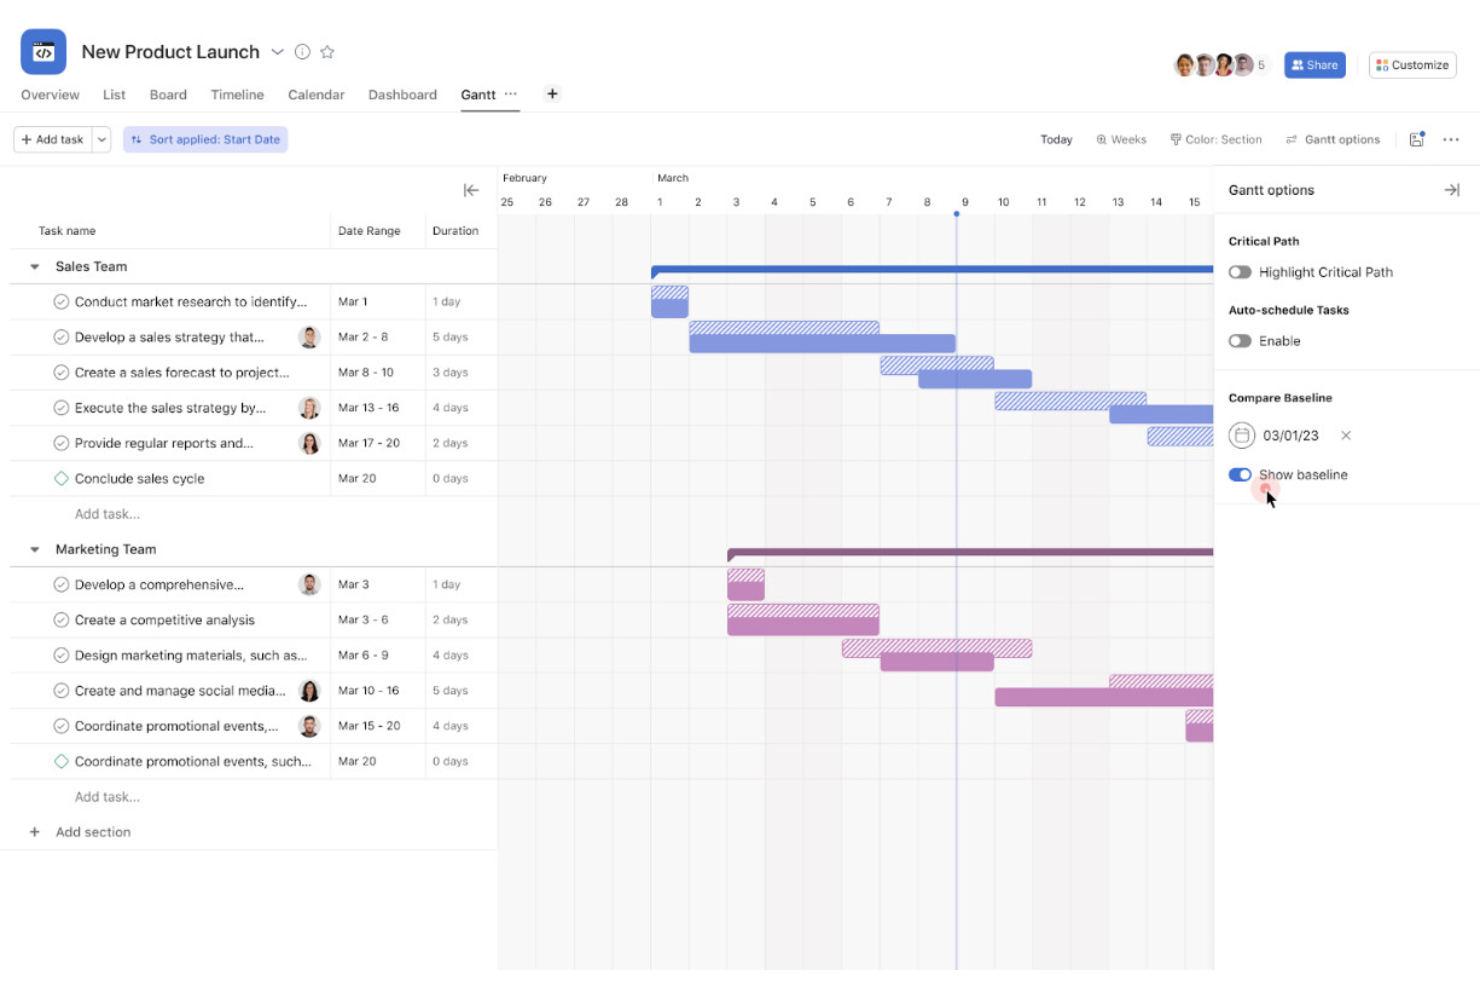
Asana is a project management tool that helps teams plan, organize, and track work over time. One of the key ways it does this is via its timeline (also called Gantt) view, letting you see tasks laid out along a schedule.
Why I Picked Asana
I picked Asana because it gives you the ability to draw dependencies between tasks directly in the timeline view. This means you don’t just put dates on tasks—you can also show which tasks block others or depend on others. As changes happen (tasks move, delays happen), you see how one change ripples through dependent tasks.
Asana Key Features
In addition to task dependency visualization, Asana offers a range of other features for project management.
- Timeline View: This lets you create a visual project plan and map out deadlines and milestones for better project tracking.
- Task Prioritization: You can easily prioritize tasks within projects and make sure your team focuses on what's most important at any given time.
- Project Templates: This helps you quickly set up new projects with predefined structures and workflows.
- Team Collaboration Tools: With built-in communication features like comments and file attachments, your team can collaborate and exchange information directly within tasks.
Asana Integrations
Integrations include Slack, Google Drive, Everhour, Microsoft Teams, Amazon Q Index, Splunk, Entra ID, Tableau, Jira Cloud, Microsoft Office 365, MuleSoft, and BetterCloud.
Pros and Cons
Pros:
- Supports subtasks within broader project timeline
- Lets you draw task dependencies in timeline view
- Highlights critical path so you see blockers
Cons:
- Baseline API access limited or missing for some data
- Complex timelines can get visually crowded

Wrike is a cloud-based project management platform that combines Gantt chart scheduling, task tracking, workload management, and AI-powered automation across projects and workflows.
Who Is Wrike Best For?
Wrike is a strong fit for mid-size to enterprise teams managing complex, multi-stakeholder projects across product, marketing, and operations functions.
Why I Picked Wrike
I picked Wrike as one of the best because its AI automation goes well beyond surface-level suggestions. Wrike's AI capabilities can help summarize work, generate content, and assist with project management workflows. I also like Wrike Copilot, which sits inside your projects and answers questions about timeline status or sprint progress on demand. For Gantt chart work specifically, that means less time chasing updates and more time managing actual dependencies and milestones.
Wrike Key Features
- Interactive Gantt timeline: Drag and drop tasks directly on the timeline to reschedule work and adjust dependencies in real time.
- Workload view: See each team member's assigned tasks and capacity across projects to spot overallocation before it affects delivery.
- Custom dashboards: Build project-specific dashboards that surface task progress, overdue items, and milestone status at a glance.
- Project blueprints: Save and reuse project structures, including timelines and task sequences, as templates for repeatable workflows.
Wrike Integrations
Wrike offers 400+ integrations through its built-in connectors and Wrike Integrate add-on, including tools like Salesforce, Microsoft Teams, Google Sheets, Slack, Adobe Creative Cloud, Jira, Power BI, Tableau, Miro, and Zoom. It also connects with Zapier and provides an open RESTful API for custom integrations.
Pros and Cons
Pros:
- Dependent task dates auto-adjust on changes
- Imports .MPP, .MPX, and .XML project files
- Built-in critical path with float analysis
Cons:
- Time tracking locked to the Business plan and above
- Navigation between spaces and views feels cluttered
New Product Updates from Wrike

Wrike Improves Template Mapping and Dashboard Filters
Wrike expanded Template Mapping with workflow and custom item type mapping, and made the new filter experience the default for Dashboard chart widgets. These updates simplify workspace setup and provide a more consistent dashboard filtering experience. For more information, visit Wrike’s official site.
 .
.
Microsoft Project is a project management software developed and sold by Microsoft. It is designed to help you plan, track, and manage projects of different sizes and complexities through a variety of features, including its Gantt chart maker.
Why I Picked Microsoft Project
I picked Microsoft Project for its detailed project planning, which makes it an excellent choice for creating Gantt charts. With features like hierarchical task organization and dependency linking, you can visualize complex project timelines with clarity.
The customization of Gantt bars allows for personalized visual cues and helps you manage intricate project tasks. Additionally, the integrated resource allocation and budget management tools help keep project planning aligned with your team's capabilities and financial constraints.
Microsoft Project Key Features
Microsoft Project also offers a variety of other features that make it useful as a Gantt chart maker.
- Timeline View: This lets you see an overview of your project schedule and provides a high-level snapshot that complements the detailed Gantt chart view.
- Milestone Tracking: You can set specific points in your project timeline to focus on key achievements, and make sure your team stays on track with crucial deadlines.
- Resource Pooling: This lets you manage resources across multiple projects and allocate team members and equipment efficiently.
- Task Prioritization: By assigning priority levels to tasks, you can address the most critical activities first, optimize your workflows, and maximize productivity.
Microsoft Project Integrations
Integrations include other Microsoft software, like Outlook, Excel, Skype, and more.
Pros and Cons
Pros:
- Integration with other Microsoft software
- Helpful project template descriptions for guidance
- Driver prioritization module for ranking strategies/objectives
Cons:
- Steep learning curve
- Limited customization options

think-cell is a software add-on for Microsoft PowerPoint and Excel that helps you easily create various types of charts for your presentations to stakeholders, including Gantt charts.
Why I Picked think-cell
For project managers who spend more than 2 hours per week preparing presentations in Excel or PowerPoint, I believe this software will save you tons of time and headaches. It lets you build adjustable calendar-based Gantt charts right inside of PowerPoint, with drag-and-drop capabilities for timelines, dependencies, and milestones. You can also link Excel sheets to PowerPoint charts so any data updates will carry-over to your Gantt chart.
think-cell Key Features
think-cell offers a range of other features tailored to creating effective Gantt charts.
- Interactive Activity Entry: This lets you enter activities directly onto the Gantt chart to streamline the process of building your project timeline.
- Customizable Work Weeks: You can define the workweek setup, such as 5-day or 7-day weeks, to accurately reflect your team's working schedule.
- Time Span Brackets: This lets you easily add brackets to indicate the duration of specific tasks or phases within your project and provides clear visual cues.
- Automatic Date Updates: When you move tasks or milestones, the dates automatically adjust, which makes sure your timeline remains accurate without manual intervention.
think-cell Integrations
Integrations include Microsoft PowerPoint and Microsoft Excel.
Pros and Cons
Pros:
- User-friendly, even for non technical experts
- Automation to speed up repetitive tasks
- Elevates your capabilities with Microsoft products
Cons:
- Primarily designed for Windows
- Difficult to shift data to a new chart once one is created

Visor is a Gantt chart maker that helps users create free and colorful Gantt charts and spreadsheets that connect to SaaS apps like Jira. With Visor, users can visualize their project timelines, plan resources, track progress, and manage dependencies.
Why I Picked Visor
I chose Visor because of its user-friendly interface, which, in my experience, is especially helpful for staying organized and on schedule when managing complex projects. Its two-way syncing to SaaS apps makes sure your charts and reports stay accurate without manual work and the ability to create Gantt charts using the information from your SaaS tool, even when the data isn't perfectly clean. You can make views for each of your team members without having to set up individual accounts for everyone. You can also drag and drop tasks to adjust timelines quickly.
Visor Key Features
Visor also offers a range of other features for managing projects and creating Gantt charts.
- Multiple Views: Visor provides Gantt, table, Kanban, and timeline views, so your team can manage projects from different perspectives and choose the view that best fits their workflow.
- AI Smart Templates: You can leverage AI-powered templates to quickly generate Gantt charts tailored to your specific tasks, which saves your team valuable time and effort in project setup.
- Milestone Addition: This lets you easily add and color-code milestones for tasks and sub-tasks, which helps you visualize project progress and prioritize key deliverables effectively.
- Custom Fields: You can create custom fields for data recording and labeling within Gantt charts, which offers flexibility to capture and categorize information according to your project's unique needs.
Visor Integrations
Integrations include Jira, Salesforce, and Asana.
Pros and Cons
Pros:
- Colorful and friendly UI
- 2-way sync that sends back info to source
- Makes multi-app workflows possible
Cons:
- It’s only a viewer - needs another tool
- Sync credits are limited
Other Gantt Chart Maker Software
The tools above aren’t the only Gantt chart creators out there. Here are some other Gantt tools that deserve an honorable mention.
- MindView
For work breakdown structures
- TeamGantt
For drag-and-drop timeline planning
- Gantter
For AI recommendations
- GanttPRO
For real-time workload management
- Smartsheet
Enterprise-grade integrations
- Zoho Projects
For scalability
- ProjectManager
For hybrid desktop and mobile workflows
- Office Timeline
For executive-ready PowerPoint visuals
- BigGantt
For cross-project timeline management
- Jira
Integration with agile development tools


Check out our video on the best Gantt chart makers:

Related Project Management Reviews
If you still haven't found what you're looking for here, check out these other project management tool reviews we've curated for you:
- Productivity Tools
- Project Tracking Software
- Project Scheduling Software
- Project Management Software
- Resource Management Software
- Workflow Automation Software
- Project Management Software with Gantt Charts
Selection Criteria for Gantt Chart Makers
When selecting the best Gantt chart makers to include in this list, I considered common buyer needs and pain points like the ability to easily track project timelines and collaborate with team members. I used the following framework to keep my evaluation structured and fair:
Core Functionality (25% of total score)
To be considered for inclusion in this list, each solution had to fulfill these common use cases:
- Create and edit Gantt charts
- Track project progress with milestones
- Assign tasks to team members
- Visualize dependencies between tasks
- Export Gantt charts in multiple formats
Additional Standout Features (25% of total score)
To help further narrow down the competition, I also looked for unique features, such as:
- Integration with popular project management tools
- Real-time collaboration features
- Customizable templates for Gantt charts
- Advanced resource management tools
- AI-powered scheduling recommendations
Usability (10% of total score)
To get a sense of the usability of each system, I looked for the following:
- An intuitive drag-and-drop interface
- Clear and visually appealing chart designs
- Easy navigation between projects
- Simple task updates and changes
- Low system lag for large projects
Onboarding (10% of total score)
To evaluate the onboarding experience for each platform, I considered whether the tool offers:
- Access to interactive product tours
- Ready-to-use templates for quick setup
- Comprehensive training videos and documentation
- Live chat or chatbot support during setup
- Webinars or demo sessions for new users
Customer Support (10% of total score)
To assess each software provider’s customer support services, I considered whether the Gantt chart maker offers:
- 24/7 customer support availability
- A detailed knowledge base or FAQs
- Multiple contact methods such as email, chat, and phone
- Responses to inquiries within a reasonable timeframe
- Proactive outreach for problem resolution
Value For Money (10% of total score)
To evaluate the value for money of each platform, I considered whether the tool has the following:
- Flexible pricing plans for different team sizes
- Free trials or freemium options
- Advanced features at a competitive price
- All necessary features in base pricing tiers
- Hidden fees or surprise costs
Customer Reviews (10% of total score)
To get a sense of overall customer satisfaction, I considered whether customer reviews covered the following:
- Ease of use and user-friendliness
- Reliability and uptime performance
- Satisfaction with customer support
- Perceived value for money
- Overall project management effectiveness
How to Choose Gantt Chart Maker Software
It’s easy to get bogged down in long feature lists and complex pricing structures. To help you stay focused, here’s a checklist of factors to keep in mind:
| Factor | What to Consider |
|---|---|
| Scalability | Make sure the tool can handle your growing team and increasingly complex projects without slowing down. |
| Integrations | Check whether the software connects with the tools you already use, like project management software, CRMs, or cloud storage. |
| Customizability | Look for options to tailor Gantt charts with custom fields, colors, or layouts that suit your team’s workflow. |
| Ease of Use | Make sure the interface is intuitive so your team can start using it quickly without extensive training. |
| Budget | Compare pricing plans and make sure the features you need are included without requiring costly add-ons. |
| Security Safeguards | Verify that the platform has strong data protection measures like encryption and user access controls to keep your projects safe. |
| Collaboration | Confirm it supports team collaboration with features like task commenting, real-time updates, and file sharing. |
| Reporting Tools | Check whether it provides clear, actionable reports to help track progress and make data-driven decisions. |
Trends In Gantt Chart Makers
Here’s a sneak peek into some Gantt chart maker trends we anticipate to continue developing this year:
- Better visual interfaces: Software like Smartsheet and ClickUp have undertaken significant interface improvements to make project visualization more intuitive, colorful, and interactive.
- Artificial intelligence integration: Tools like Hive and Height are offering AI features that can automate time-consuming tasks and provide predictive insights. This is particularly useful for resource allocation and risk identification, and can help reduce your workload.
- Real-time collaboration plug-ins: With the decrease in specialized software, more tools are offering plug-ins and integrations that allow users to discuss, share files, and make decisions without leaving the platform.
What Is a Gantt Chart Maker?
A Gantt chart maker is a project management tool for creating Gantt charts—visual project timelines—and using them to track progress. You can use Gantt chart software to map out tasks, durations, start and end dates, dependencies, the critical path, and resources.
Gantt chart diagram programs also often include features for task assignment and resource allocation, can help simplify project planning, and allow for clarity and alignment on the project plan and project progress.
Features of Gantt Chart Maker Software
When selecting a Gantt chart maker, keep an eye out for the following key features:
- Task dependencies: You can easily link tasks together and visualize which tasks need to be completed first. This helps you spot bottlenecks and keep projects moving.
- Drag-and-drop interface: This lets you simply click and move tasks directly on the timeline, which makes updating schedules quick and intuitive.
- Milestone tracking: You can set and visualize key project milestones, so everyone knows how work is progressing.
- Resource allocation: This lets you assign team members or resources to specific tasks, avoid overloading anyone, and keep everyone in sync.
- Zoom and timeline customization: You can adjust the view from hours to months to focus on details or see the bigger picture as needed.
- Progress tracking: This helps monitor the completion percentage for each task, so you always have a clear sense of where things stand.
- Collaboration tools: You can invite colleagues, leave comments, or share project updates to make teamwork simple and communication seamless.
- Export and sharing options: This lets you create PDFs, links, or image exports of your charts and share project plans with clients or teammates.
- Color-coding: You can use color schemes to categorize tasks by team, priority, or phase, and keep your chart organized.
- Critical path highlighting: This helps you identify the series of tasks that directly impact your project’s finish date, so you can zero in on what’s most urgent.
AI Features to Look for in a Gantt Chart Maker
Many Gantt chart makers also include AI-powered features to save you time and boost efficiency:
- Automated scheduling: You can let AI suggest optimal task sequences and timelines based on project requirements, deadlines, and resource availability.
- Predictive analytics: You'll get forecasts for potential delays or risks by analyzing historical data and current project trends.
- Smart resource allocation: You can get AI-powered recommendations for team member or resource assignment to keep workloads balanced and avoid conflicts.
- Natural language input: This lets you describe your project in plain English and AI will generate a draft Gantt chart for you without requiring manual data entry.
- Automated progress updates: AI can track task completion and update your chart automatically by integrating with other project management tools or even parsing team communications.
- Intelligent notifications: You'll get proactive reminders and alerts about upcoming deadlines, potential roadblocks, or schedule changes.
- Scenario planning: You can use AI to model “what-if” scenarios and see how changes in scope, resources, or deadlines might affect your timeline.
- Task prioritization: You'll get suggestions on which tasks to prioritize based on dependencies, deadlines, and team capacity, so you can keep your project on track.
While these features are common in this software category, products are constantly changing. Therefore, consider the product's update frequency. As noted by Robyn Birkedal:
One thing to keep in mind is how often a tool updates. New features can be great, but if you’re not keeping up, it can feel overwhelming when the interface changes unexpectedly.
Benefits of Gantt Chart Maker Software
Here are five primary benefits of Gantt chart maker software:
- Streamlined project management: Gantt chart software provides a central platform for managing all project tasks. This consolidated approach allows you to maintain oversight on task progress, resource allocation, and deadlines, as well as drive improved project delivery.
- Improved team collaboration: Team members can share updates, offer feedback, and maintain clear communication. This makes sure everyone is aligned on project goals and can stay productive.
- Efficient resource allocation: Gantt chart software lets you visualize and manage resource distribution effectively. By assigning resources strategically, you can make sure utilization is optimal, improve project outcomes, and avoid resource burnout.
- Identify and mitigate project risks: Advanced analytics provided by Gantt chart software allow you to spot potential roadblocks and manage risks in a timely manner. This lets you solves problems proactively and minimize project delays.
- Better decision making: With comprehensive reporting and insights, Gantt chart software equips you and your stakeholders with the data necessary to make informed decisions. You'll remove guesswork from the equation and help steer projects towards success based on solid evidence.
Costs & Pricing For Gantt Chart Makers
Below is a table outlining the different plan options and their pricing for Gantt chart software:
| Plan Name | Price (per user/month) | Features |
|---|---|---|
| Free | $0 | Basic Gantt chart functionality, limited users and projects |
| Basic | $5 - $10 | Gantt chart creation, task dependencies, basic reporting, limited users and projects |
| Standard | $10 - $20 | Advanced Gantt chart features, task scheduling, resource management, multiple users/projects |
| Premium | $20 - $50 | Advanced project scheduling, customizable Gantt charts, integrations, unlimited users/projects |
Common stages where your company may want to upgrade your pricing plan include:
- Project complexity increase: When projects become more complex, you may need to upgrade to a higher pricing tier to access advanced features.
- Team expansion: As your team grows, you might need to scale up your pricing tier to accommodate more user licenses, better collaboration tools, and more sophisticated permissions management.
- Integration needs: When you need to integrate your Gantt chart software with other tools like CRM, ERP, or project management suites, upgrading to a higher pricing tier can provide advanced integration capabilities.
- Data and reporting requirements: You might need to upgrade your pricing tier if you require advanced reporting, analytics, and data visualization features.
- Customer support and training: Higher levels of customer support, training, and onboarding become essential as your company scales, because it will help you use the tool effectively and maximize its benefits.
Gantt Chart Maker FAQs
Find answers to common questions about this topic.
What is the best free Gantt chart software?
The best free Gantt chart software depends on your specific use cases, but some of the most popular options include tools like ClickUp, TeamGantt, and GanttProject. Each offers a free tier with core features such as task scheduling and timeline visualization.
ClickUp stands out for its flexible project views and unlimited users. TeamGantt has an intuitive drag-and-drop interface, but limits free users to one project at a time. GanttProject is completely free to download. Considering the size of your team and the complexity of your projects will help you choose the right free option for your needs.
How do Gantt charts compare to Kanban boards for managing tasks?
Gantt charts help you plan and track projects with timelines, dependencies, and milestones. They’re ideal for scheduling and visualizing how tasks overlap.
Kanban boards focus on workflows and use columns to show task status, and are best for task-focused work that involves lots of handoffs. If you need to see deadlines and big-picture dependencies, Gantt charts are better. Many project managers use both—Kanban for daily work and a Gantt chart for a high level overview of the whole project.
What are best practices for updating Gantt charts during a project?
Update your Gantt chart regularly (at least weekly) to keep it accurate and make sure it reflects real changes. Review task status, adjust deadlines for delays, and communicate updates with your team.
Use color-coding or comments to highlight changes and clarifications. Most tools support automated updates with notifications. Consistent updates help you spot bottlenecks, keep your team aligned, and avoid surprises near deadlines.
What are the main differences between free and paid Gantt chart makers?
Free Gantt chart tools usually limit user seats, the number of projects you can run, integrations, or advanced features like reporting and resource management. Paid tools offer more collaboration options, automations, custom fields, and better support.
If you run a lot of projects or need features like workload tracking and integrations, go for a paid plan. Starting with a free plan is a good way to assess whether a tool will fit your needs, but you’ll need to upgrade as your team and project complexity grow.
Can I integrate a Gantt chart maker with other project management tools?
Yes, most Gantt chart makers integrate with other project management tools like Asana, Trello, Slack, and Google Workspace. Integrations help you sync tasks, automate workflows, and reduce manual and duplicate updates across platforms.
Check the software’s app marketplace or settings for integration options. If your team already uses a core PM tool, it might already have Gantt chart functionality, but you can also look for Gantt chart software that connects natively or via Zapier.
How can I manage resource allocation using Gantt chart software?
Most Gantt chart tools let you assign tasks, track workloads, and visualize team capacity. Assign resources—like team members or equipment—to tasks directly on the timeline. You can use features such as workload views or resource histograms to spot overbooked team members or idle time. Regularly review allocations to keep workloads balanced and prevent burnout or delays.
What should I look for when choosing a Gantt chart maker for my team?
Focus on an intuitive design, collaboration features, integration options, and pricing. Make sure the tool offers drag-and-drop functionality, dependency tracking, and export options.
Check whether it supports time tracking, real-time updates, and team messaging. Choose a solution that matches your project size and your team’s familiarity with Gantt charts. You can always request a free trial or use freemium versions before committing.
Are there Gantt chart tools that support agile project management?
Yes, many Gantt chart makers, like ClickUp, Smartsheet, and Wrike, offer features that support agile methods. Look for backlog management, sprint planning, and timeline flexibility. Some tools combine Gantt timelines with agile boards, so you can run sprints while tracking high-level timelines and dependencies. This helps you blend agile workflows with structured scheduling.

What's Next?
Want to connect with other digital project managers to share resources and best practices? Join our membership community and get access to 100+ templates, samples, and examples and connect with 100s of other digital project managers in Slack.