10 Best Online Flowchart Software Reviewed For 2026

10 Best Flowchart Software Shortlist


Online flowchart software helps you visualize processes, systems, and workflows using shapes, connectors, and text. Without a clear visual representation, teams often miscommunicate, duplicate work, or miss critical steps in a process. Flowchart software solves these problems by giving teams a shared, easy-to-understand diagram that improves alignment and communication.
With over 20 years of project management experience, I’ve tested a wide range of flowchart tools, from basic diagram builders to advanced platforms with real-time collaboration and data integration. I focused on how intuitive they are, how well they support team workflows, and how seamlessly they fit into existing project environments.
Here are the top online flowchart tools I’ve reviewed. Each one offers standout features to help you diagram more clearly, collaborate more easily, and streamline your workflows.
Why You Can Trust Us
We’ve been testing and reviewing project management software since 2012. As project managers ourselves, we know how critical and difficult it is to make the right decision when selecting software.
We invest in deep research to help our audience make better software purchasing decisions. We’ve tested more than 2,000 tools for different project management use cases and written over 1,000 comprehensive software reviews. Learn how we stay transparent & our software review methodology.
The Best Flowchart Software Comparison Chart
Here is a table where you can compare the tools we just covered in the overviews.
| Tool | Best For | Trial Info | Price | ||
|---|---|---|---|---|---|
| 1 | Best for data import | Free trial + free plan available | From $9/month | Website | |
| 2 | Best for built-in communication tools | Free plan available | From $8/member/month (billed annually) | Website | |
| 3 | Best for flowchart templates | Free plan available | From $3/editor/month (billed annually) | Website | |
| 4 | Best for Windows | 30-day free trial available | From $5/user/month (billed annually) | Website | |
| 5 | Best for enterprise teams | Free demo available | From $9.95/user/month (billed annually) | Website | |
| 6 | Best easy to use flowchart freeware | Free to use | Free to use | Website | |
| 7 | Best for agile teams | Not available | From $4/month | Website | |
| 8 | Best all-purpose diagramming software | 30 days free trial | From $8.25/user/month | Website | |
| 9 | Best for Confluence and Jira integrations | 30-day free trial available | From $2.80/month (billed annually) | Website | |
| 10 | Best for real-time collaboration | 14-day free trial + free plan available | From $5/user/month (billed annually) | Website |

-

Celoxis
Visit WebsiteThis is an aggregated rating for this tool including ratings from Crozdesk users and ratings from other sites.4.4 -
Smartsheet
Visit WebsiteThis is an aggregated rating for this tool including ratings from Crozdesk users and ratings from other sites.4.5 -
Accelo
Visit WebsiteThis is an aggregated rating for this tool including ratings from Crozdesk users and ratings from other sites.4.4


Overviews Of The Best Flowchart Software
Here’s a brief description of each of the flowchart software solutions that are featured on this top 10 list.
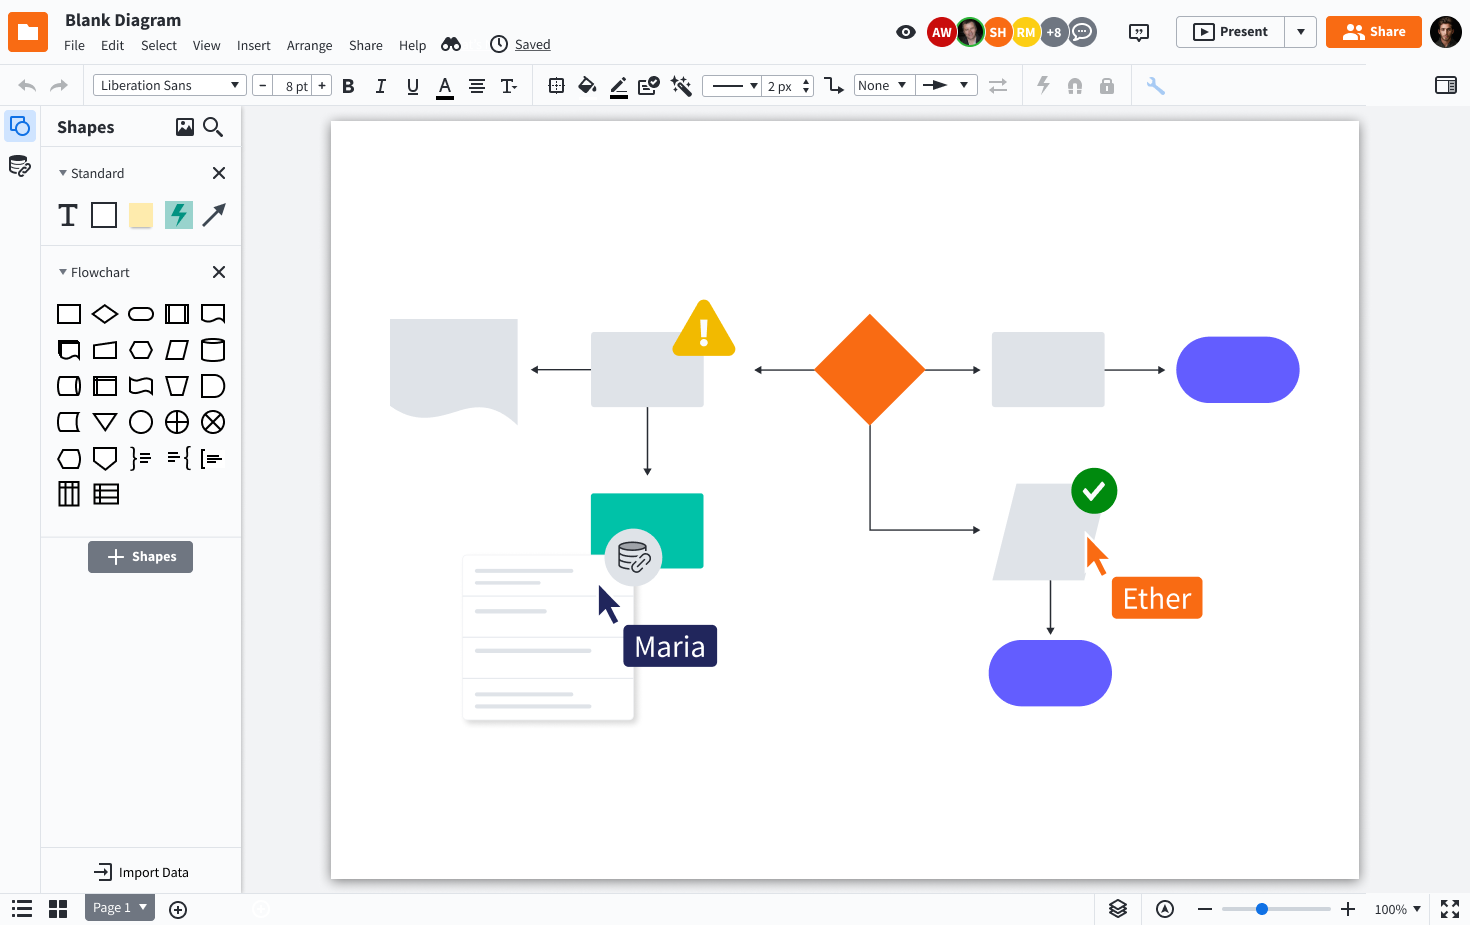
Lucidchart is an online diagramming platform designed for teams in tech, business, and education who need to create, share, and collaborate on flowcharts and process maps to clarify complex workflows and drive better decision-making.
Who Is Lucidchart Best For?
Lucidchart is a great fit for cross-functional teams in mid-size to enterprise companies who need a shared visual workspace for mapping processes, systems, and org structures.
Why I Picked Lucidchart
I picked Lucidchart as one of the best because its data import capabilities genuinely set it apart from other flowchart tools. You can pull in data directly from spreadsheets or linked data sources to auto-generate diagrams, which means my team can map out complex system architectures or org structures without building them manually from scratch. I also like the conditional formatting layer on top of that—once data is linked, shapes and labels update automatically when the underlying data changes. That kind of live connection between data and diagrams is something I rarely see executed this well in other tools.
Lucidchart Key Features
- Real-time collaboration: Multiple team members can edit the same diagram simultaneously, with live cursors and in-editor comments.
- Template library: Choose from hundreds of pre-built flowchart and diagramming templates to start new diagrams with minimal setup.
- Smart containers: Group and organize shapes into swimlanes or structured containers that automatically adjust as you add or move elements.
- Revision history: Access a full version history of any diagram to review, compare, or restore previous versions.
Lucidchart Integrations
Integrations include Google Workspace, Microsoft 365, Slack, Jira, Confluence, Dropbox, Box, Zoom, Notion, and Smartsheet.
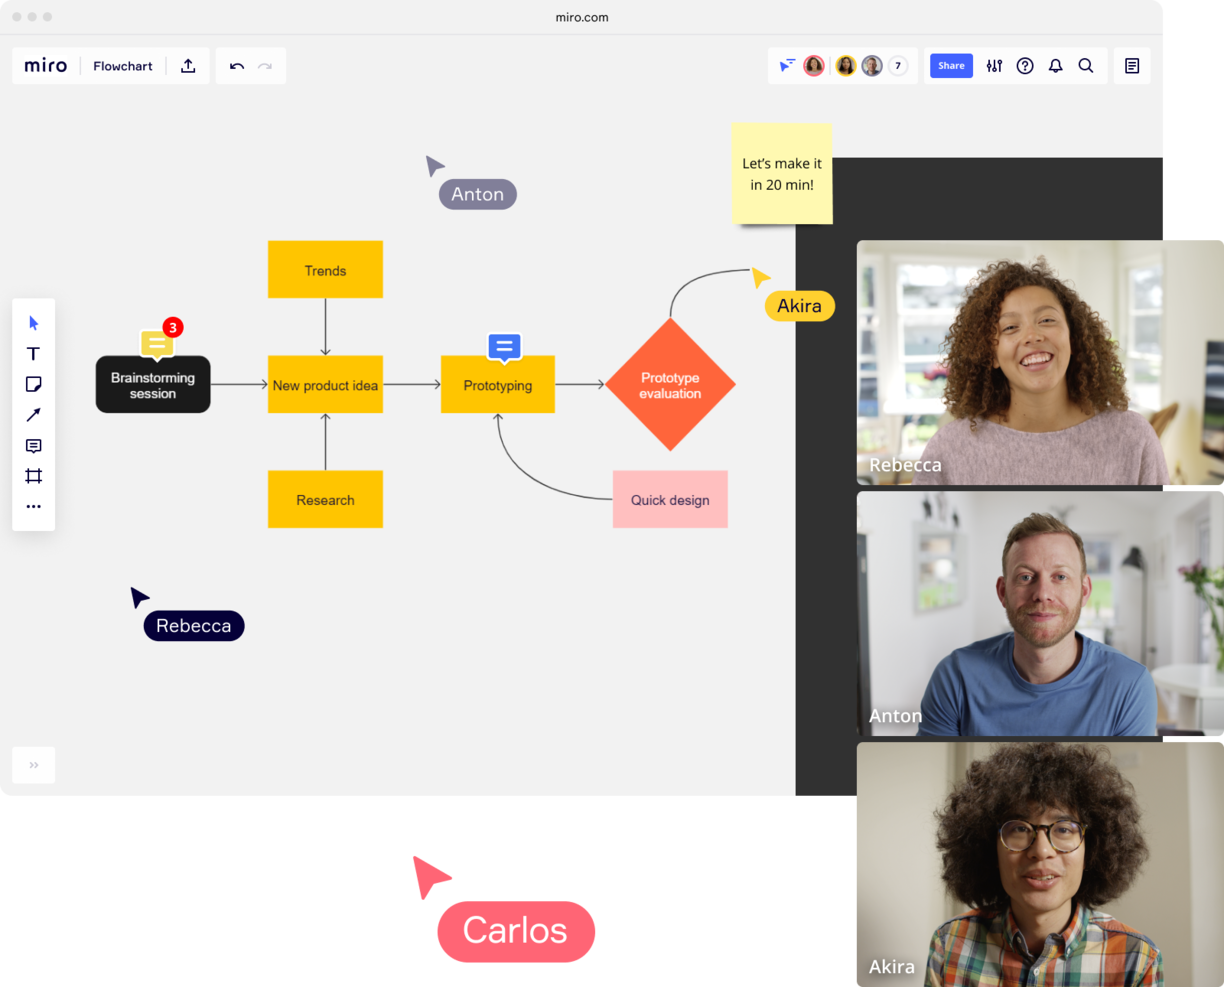
Miro is an online whiteboard platform designed for teams in tech, product, and design who need to create, share, and collaborate on flowcharts and diagrams in real time.
Who Is Miro Best For?
Miro is a great fit for cross-functional teams in product, engineering, and design who need a shared visual workspace for mapping workflows and processes.
Why I Picked Miro
Miro is one of my top picks because I love how it keeps communication woven directly into the flowcharting workspace. Instead of jumping to Slack or email to discuss a diagram, my team can leave threaded comments directly on specific shapes or connectors, tag teammates with @-mentions, and resolve feedback without ever leaving the board. The Talktrack feature is especially useful—I've recorded video walkthroughs of complex process flows and shared them async, so teammates in different time zones can watch, pause, and comment on exact points in the diagram. For live sessions, the built-in Timer and anonymous voting tools let my team run structured workshops around a flowchart without needing a separate facilitation tool.
Miro Key Features
- Flowchart templates: Choose from a library of pre-built flowchart and process diagram templates to start mapping workflows.
- Smart diagramming: Use auto-connect and snap-to-grid tools to draw and arrange shapes, connectors, and swimlanes with precision.
- Infinite canvas: Build flowcharts of any size or complexity on an expandable board without running out of space.
- Presentation mode: Walk stakeholders through a completed flowchart as a structured, frame-by-frame presentation directly within Miro.
Miro Integrations
Integrations include Microsoft Teams, Google Workspace, Jira, Confluence, ServiceNow, GitHub Copilot, OpenAI Codex, Replit, Gemini CLI, and Claude Code.
Pros and Cons
Pros:
- Built-in communication features for streamlined collaboration
- Intuitive and easy setup
- Free forever plan available
Cons:
- Free version does not allow high-quality export to pdf
- Zooming can be jumpy on larger projects
- Visitor/guest accounts locked to paid plans only
New Product Updates from Miro
Miro Adds Japan Data Residency for Enterprise Customers
Miro has introduced Japan data residency for enterprise customers, offering in-region storage for production data, backups, and metadata, plus in-region compute infrastructure. For more information, visit Miro's official site.
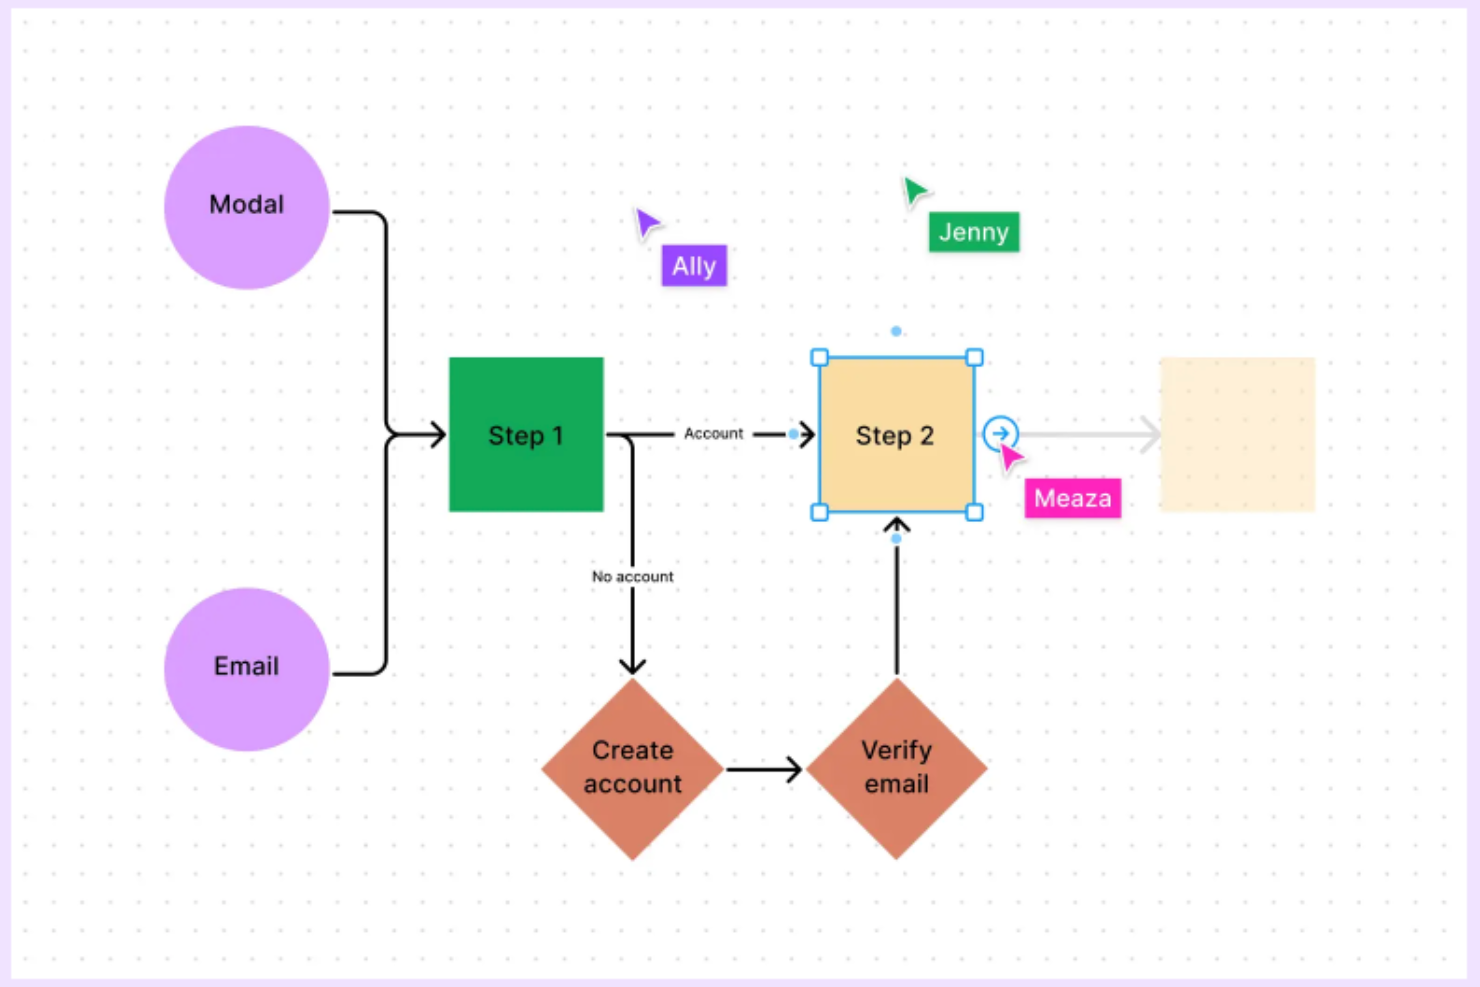
FigJam is an online whiteboard built for teams who need to create, edit, and share flowcharts, making it a go-to choice for product managers, designers, and cross-functional teams mapping out processes and ideas together.
Who Is FigJam Best For?
FigJam is a great fit for product and design teams at tech companies who need a shared space for visual collaboration and process mapping.
Why I Picked FigJam
FigJam earns its spot on my shortlist because of how well its template library supports flowchart creation right out of the box. I like that you can start from a dedicated flowchart template and immediately get to work with pre-built shapes, connectors, and a grid-snapping system that keeps diagrams clean and aligned. Beyond the core flowchart template, FigJam's AI lets you generate custom diagram templates from a simple text prompt, which I've found useful when mapping out a non-standard process that doesn't fit a generic layout. The community library also surfaces additional templates, supplementing the various built-in options.
FigJam Key Features
- Real-time audio and live chat: Communicate with teammates directly inside a FigJam board using built-in audio and live chat without switching to another tool.
- Spotlight mode: Guide meeting participants to focus on a specific area of the board during live sessions or workshops.
- Sticky note sorting with AI: Automatically group sticky notes into themes with a single click to organize brainstorm output.
- Guest access: Invite external collaborators to contribute to a FigJam file for 24 hours without requiring them to create an account.
FigJam Integrations
Integrations include Asana, Jira, and ChatGPT.

Visio is a diagramming platform designed for professionals and teams who need to create detailed flowcharts, process maps, and organizational charts, making it a go-to choice for businesses that rely on Microsoft 365 and want advanced diagramming capabilities online.
Who Is Visio Best For?
Visio is a strong fit for enterprise teams and IT professionals who already work within the Microsoft 365 ecosystem and need a dedicated diagramming tool for complex workflows and technical documentation.
Why I Picked Visio
Visio earns its spot on my shortlist because it's the most mature diagramming tool built specifically for Windows environments and the Microsoft 365 ecosystem. I like that Visio Plan 2 includes a full desktop app with offline support, allowing my team to continue working on complex flowcharts offline. The Data Visualizer feature converts Excel process map data directly into Visio diagrams, reducing manual rebuilding. BPMN 2.0 support and access to over 250,000 shapes make it a serious option for teams documenting technical processes at scale.
Visio Key Features
- Real-time co-authoring: Multiple team members can edit the same diagram simultaneously using Visio for the web.
- Microsoft Teams integration: Embed and share Visio diagrams directly within Teams channels for in-context collaboration.
- Pre-built diagram templates: Choose from a library of templates covering flowcharts, network diagrams, org charts, and floor plans.
- Shape data linking: Attach metadata to individual shapes to document process details, ownership, or status directly within a diagram.
Visio Integrations
Integrations include Microsoft Teams, Power BI, Power Automate, Microsoft Excel, Microsoft Word, Microsoft PowerPoint, OneDrive for Business, Microsoft Azure, Microsoft Access, and Microsoft SharePoint.
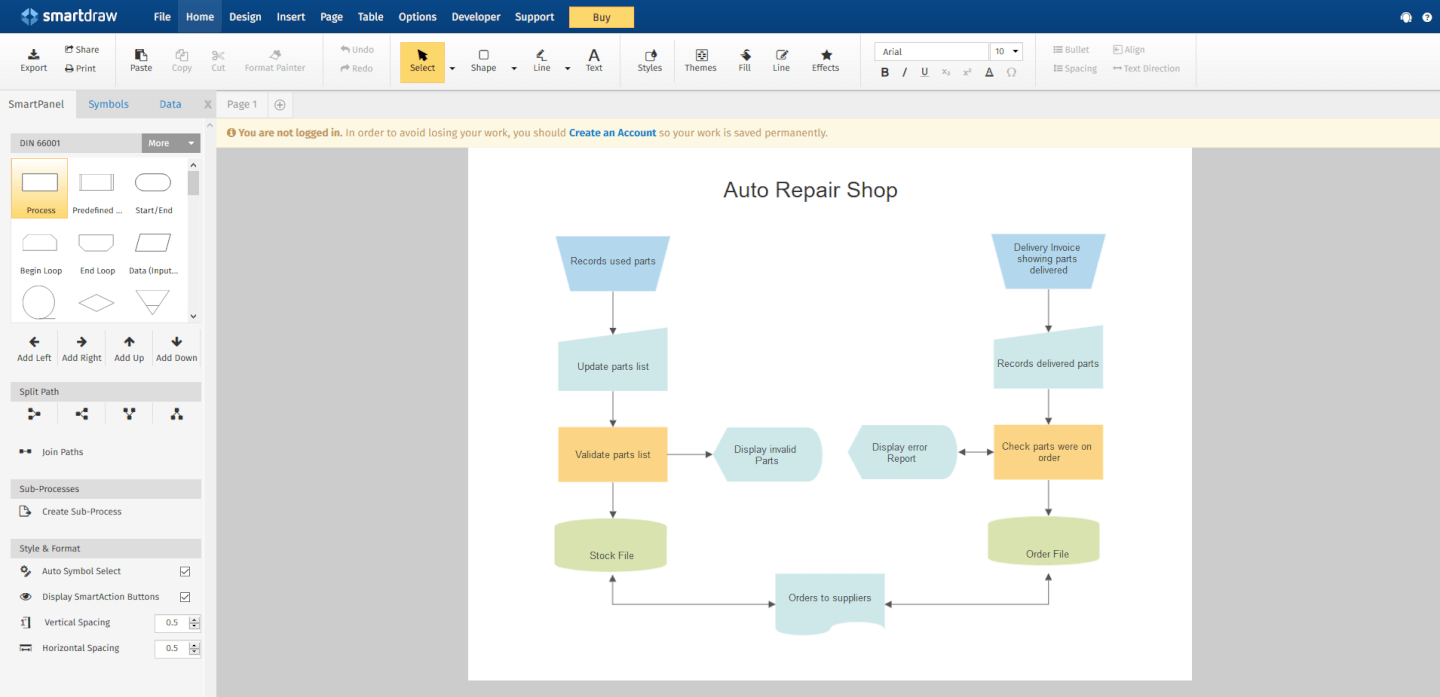
SmartDraw is an online diagramming platform designed for teams and organizations that need to create, share, and manage flowcharts and process diagrams at scale.
Who Is SmartDraw Best For?
SmartDraw is a strong fit for enterprise teams that need centralized diagram management, admin controls, and cross-functional collaboration across large organizations.
Why I Picked SmartDraw
SmartDraw earns its spot as one of the best on my shortlist because of how well it handles the operational demands of large organizations. I like that it lets IT admins provision users via SSO and save files directly to OneDrive, SharePoint, or Google Drive—without needing to set up a separate storage system. That kind of data control matters a lot when you're managing compliance across dozens of teams. I also find the dedicated enterprise support rep genuinely useful, especially during onboarding when you're migrating files from tools like Visio or Lucidchart at scale.
SmartDraw Key Features
- AI-powered flowchart generation: Describe a process in plain text and SmartDraw automatically generates a fully editable flowchart as a starting point.
- Data-driven diagramming: Pull in data from Google Sheets or a CSV file to populate flowcharts with real process details like responsibilities and costs.
- Custom team templates: Create and save standardized flowchart templates that your entire team can reuse to keep diagrams consistent across projects.
- Swimlane diagram support: Add swimlanes to any flowchart in a single click to map cross-functional processes across departments or roles.
SmartDraw Integrations
Integrations include Microsoft OneDrive, Microsoft SharePoint, Google Drive, Dropbox, Box, Google Workspace, Microsoft Teams, Confluence, Jira, and Trello.

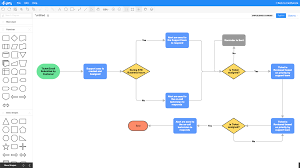
draw.io is a browser-based diagramming tool designed for teams and professionals who need to create, edit, and share flowcharts and process diagrams without installing software or paying upfront.
Who Is draw.io Best For?
draw.io is a great fit for individual contributors, small teams, and budget-conscious organizations that need a no-cost diagramming tool without sacrificing core functionality.
Why I Picked draw.io
draw.io earns its spot as one of the best on my shortlist because it's one of the few fully free diagramming tools that doesn't cut corners on functionality. I love that you can open a browser, start building a flowchart with a dedicated shape library, and share it with collaborators—all without creating an account. The AI-powered diagram generation is a feature I use regularly: you describe a process in plain text, and draw.io builds the initial flowchart structure for you, which is a real time-saver when mapping out complex workflows from scratch. Real-time collaboration with shared cursors also means my team can co-edit the same diagram simultaneously, with changes syncing live across Google Drive or OneDrive.
draw.io Key Features
- Multi-format export: Export diagrams as PNG, SVG, PDF, HTML, or XML files directly from the browser.
- Diagram templates: Start from a pre-built template for flowcharts, org charts, network diagrams, UML, and more.
- Freehand drawing tool: Sketch shapes and annotations by hand directly on the canvas using the built-in freehand mode.
- XML-based file format: Save and edit diagrams as open XML files, making them portable and version-control friendly.
draw.io Integrations
Integrations include Google Drive, Microsoft OneDrive, Dropbox, GitHub, GitLab, Confluence, Jira, Trello, Notion, and SharePoint.
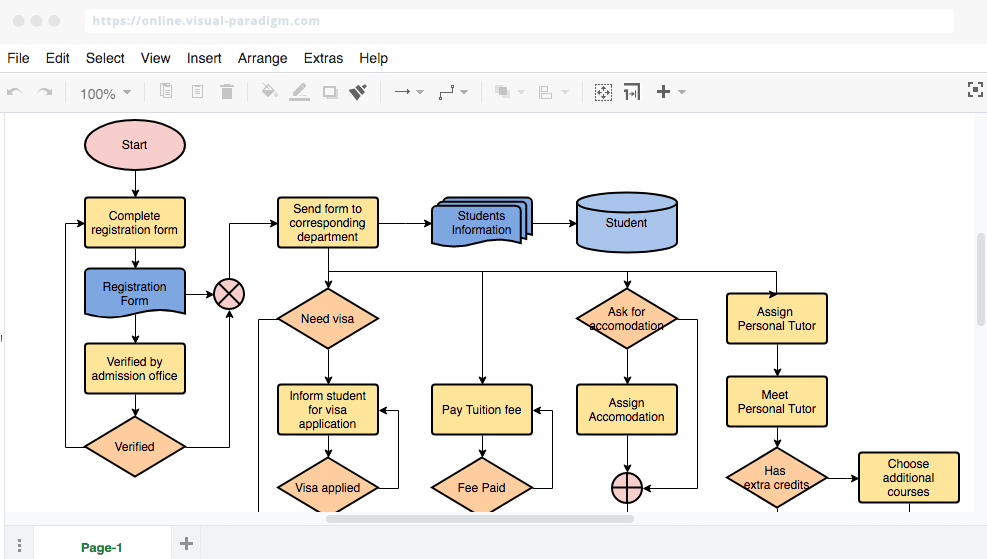
VisualParadigm Online is a cloud-based diagramming platform for teams and professionals who create, share, and collaborate on flowcharts and process diagrams to support project planning, workflow mapping, and business analysis.
Who Is VisualParadigm Online Best For?
VisualParadigm Online is a good fit for cross-functional teams in tech and software development who need a shared space for diagramming across sprints, planning cycles, and design reviews.
Why I Picked VisualParadigm Online
I picked VisualParadigm Online as one of the best because of how well it supports the kind of iterative, visual work that agile teams do across sprints. The multi-project, multi-team workspace means my team can organize diagrams by project without everything bleeding into one cluttered shared folder. I also like that multiple team members can edit the same diagram simultaneously with real-time synchronization, which is useful when you're mapping out a user flow mid-sprint and three people have opinions. The Agilien extension connects directly to Jira to generate an initial product backlog from your diagrams, providing a practical bridge between visual planning and sprint execution.
VisualParadigm Online Key Features
- Drag-and-drop diagram editor: Build flowcharts using a visual canvas with pre-built shapes, connectors, and formatting tools.
- Template library: Start from a curated set of flowchart and process diagram templates to reduce setup time.
- Export and sharing options: Export diagrams as PNG, SVG, or PDF, or share via a live link for stakeholder review.
- Version history: Access and restore previous versions of a diagram to track changes over time.
VisualParadigm Online Integrations
Integrations include Jira, Google Drive, Microsoft Word, Microsoft Excel, Microsoft PowerPoint, and an API is available for custom integrations.
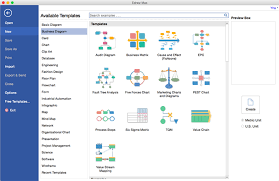
Edraw Max gives teams, educators, and business professionals a flexible platform to create flowcharts and diagrams for process mapping, brainstorming, and visual communication across a wide range of industries.
Who Is Edraw Max Best For?
Edraw Max suits teams in engineering, IT, education, and business who need one tool to handle a wide variety of diagram types.
Why I Picked Edraw Max
Edraw Max earns its spot on my shortlist because it covers more diagram types than almost any other tool I've used, including flowcharts, UML diagrams, P&ID drawings, network diagrams, and floor plans. I like that my team can switch between a process flowchart for an engineering handoff and an org chart for a stakeholder presentation without leaving the platform. The library of 26,000+ symbols means I'm rarely hunting for the right shape, and the 1,500+ built-in templates cut down the time it takes to get a diagram from blank canvas to shareable draft.
Edraw Max Key Features
- Real-time collaboration: Multiple team members can edit and comment on diagrams simultaneously within a shared workspace.
- Cross-platform support: Edraw Max runs on Windows, Mac, Linux, and in a browser, so your team can work from any device.
- Export and import options: Export diagrams to Visio, PDF, PNG, SVG, and more, or import existing Visio files directly.
- Presentation mode: Display diagrams as a slideshow directly within the tool without exporting to a separate presentation app.
Edraw Max Integrations
No native integrations are listed.
Gliffy is an online diagramming tool designed for teams in tech, product, and project management who need to create, share, and collaborate on flowcharts and process diagrams directly within their workflows.
Who Is Gliffy Best For?
Gliffy is a great fit for software and product teams that run their work inside Atlassian tools like Confluence and Jira.
Why I Picked Gliffy
Gliffy earns its spot on my shortlist because of how deeply it's built into the Confluence environment. I like that diagrams created in Gliffy are fully searchable within Confluence search—so when my team is hunting for a specific process or system, the text inside a diagram surfaces right alongside page content. That's something most diagramming tools simply don't offer. I also find the automatic update feature genuinely useful: edit a diagram once, and every copy of it across your entire Confluence space updates automatically, which keeps documentation consistent without any manual cleanup. It's the kind of tight Atlassian-native integration that makes Gliffy a natural choice for teams already living in Confluence.
Gliffy Key Features
- Mermaid diagram support: Generate entity-relationship diagrams, UML diagrams, and other technical diagrams using code, without placing a single shape manually.
- Interactive linked layers: Build diagrams with multiple layers that viewers can toggle on and off directly on a Confluence page.
- CSV data upload: Import CSV files into Gliffy and drag data directly into your diagrams without switching to another tool.
- Real-time collaboration: Co-edit diagrams simultaneously with teammates inside Confluence.
Gliffy Integrations
Integrations include Confluence, Jira, and an API is available for custom integrations.

Cacoo is a cloud-based diagramming tool designed for teams in tech, product, and design who need to create, edit, and share flowcharts and diagrams together online.
Who Is Cacoo Best For?
Cacoo is a good fit for cross-functional teams in tech and product who need a shared space to build and iterate on diagrams together.
Why I Picked Cacoo
Cacoo is one of my top picks because I love how it handles live, multi-user editing on a shared canvas. When my team is working through a process flow together, everyone can edit simultaneously and track changes through version history—no one is waiting on a "turn" to contribute. I also find the follow mode genuinely useful during diagram reviews, where one person can guide the rest of the team cursor-by-cursor through a complex flowchart. The built-in video calls and chat mean we stay in the diagram the whole time, rather than jumping between Cacoo and a separate meeting tool.
Cacoo Key Features
- Templates and shapes library: Choose from a pre-built library of shapes and templates to build flowcharts, wireframes, network diagrams, and more.
- Infinite canvas: Expand your workspace in any direction as your diagram grows, with no fixed boundaries on the board.
- Presentation mode: Turn any diagram into a slideshow and present it directly from Cacoo without switching to another tool.
- Export and embed options: Export diagrams as PNG, PDF, or SVG, or embed them directly into websites and wikis.
Cacoo Integrations
Integrations include Backlog, Google Drive, Google Docs, Atlassian Confluence, AWS, Adobe Creative Cloud, Slack, Dropbox, Box, and Microsoft OneDrive.
Other Flowchart Maker Options
Here’s a few more that didn’t make the top list. If you need additional suggestions for handy process flow diagram software, check these out.
- ConceptDraw Diagram
For a one-time license purchase
- Terrastruct
For software development
- Creately
Free flowchart software
- Whimsical
App for making fast flowcharts


How I Evaluate Flowchart Software
I evaluate flowchart software in two layers: the baseline features a tool must have, like BPMN support and real-time collaboration, and the differentiators that make one tool a better fit than another.
Core Functionality (Table Stakes For This List)
These core capabilities serve as the acceptance criteria for inclusion on my list of flowchart software:
- Flowchart Shape Library: I check whether a tool includes standardized notation sets like BPMN 2.0, UML, and swimlane shapes, not just basic geometric objects.
- Drag-and-Drop Canvas: Smart connectors that stay attached when you reposition shapes matter a lot. I look for auto-routing, snap-to-grid, and alignment guides.
- Pre-Built Templates: A solid template library that includes decision trees, process maps, and org charts saves hours of setup. I evaluate both variety and quality.
- Real-Time Collaboration: I look for live co-editing with presence indicators and threaded comments, especially for distributed teams working on process documentation.
- Import/Export & Integrations: Visio compatibility is a big one. I also evaluate format support (SVG, PNG, PDF) and native connections to tools like Confluence and Jira.
- Sharing & Embedding: I consider how each tool handles permissions, link sharing, and live embeds into wikis or project spaces where diagrams actually get used.
I rank each vendor on a scale from 0 (does not offer the functionality) to 5 (excels in this area) for each criterion.
Vendors need to achieve a minimum average score to be considered for inclusion on my list. From there, I consider what sets each platform apart.
Differentiating Factors (What Sets Vendors Apart)
Once I've curated my list, here's how I contrast and compare different vendors in the flowchart software space:
Standout Features
I pay close attention to AI diagram generation and code-to-diagram support, which can accelerate documentation and architecture work for technical teams. Tools offering data-linked diagrams make dynamic reporting and process maps possible in fast-changing business environments. I also evaluate process simulation and analytics, especially for buyers mapping out complex workflows who want to validate efficiency before rollout.
Beyond Features
Security and compliance certifications like SOC 2 and GDPR matter when your diagrams contain sensitive process data or system architecture details. I also evaluate pricing models closely. Some tools charge per editor while viewers can access for free, which changes the math for large teams. Ecosystem fit is another big factor. A tool that embeds natively into Confluence or Notion keeps diagrams where your team already works instead of siloed in yet another app.
How to Choose Flowchart Software
It’s easy to get bogged down in long feature lists and complex pricing structures. To help you stay focused as you work through your unique software selection process, here’s a checklist of factors to keep in mind:
| Factor | What to Consider |
|---|---|
| Scalability | Ensure the software can grow with your team. Look for solutions that support increasing users and more complex diagrams as your projects expand. |
| Integrations | Check if the software integrates with tools your team already uses, like Slack, Google Drive, or Trello, to enhance workflow efficiency. |
| Customizability | Consider how much you can tailor the software to your needs. Look for customizable templates and flexible diagramming options to suit different projects. |
| Ease of Use | Evaluate how intuitive the interface is. Your team should be able to start using the tool quickly without extensive training or a steep learning curve. |
| Budget | Compare pricing plans and ensure the cost aligns with your budget. Consider what features are included at different pricing tiers to avoid unexpected costs. |
| Security Safeguards | Verify that the software offers strong security measures like data encryption and secure access controls to protect your sensitive information. |
| Collaboration | Look for features that support real-time collaboration, allowing your team to work together effectively, regardless of location. |
| Support | Consider the availability and quality of customer support. Look for resources like live chat, tutorials, and a comprehensive help center. |
Trends in Flowchart Software
In my research, I sourced countless product updates, press releases, and release logs from different flowchart software vendors. Here are some of the emerging trends I’m keeping an eye on:
- Real-time collaboration enhancements: More tools are focusing on improving real-time collaboration features, allowing teams to work together more effectively. Features like in-editor chat and live updates help teams stay aligned, and vendors like Lucidchart and Miro are leading the charge.
- AI-assisted diagram creation: Some tools are starting to incorporate AI to assist in creating diagrams. This helps speed up the design process by suggesting layouts and connections. AI features are becoming a staple in modern flowchart tools to enhance productivity.
- Interactive and dynamic diagrams: There's a growing trend towards interactive diagrams that respond to user input. This includes features like clickable elements and conditional formatting, making diagrams more engaging and informative.
- Focus on user data privacy: With increasing concerns about data security, vendors are enhancing their privacy measures. This includes better encryption and compliance with regulations like GDPR, ensuring users' data is protected.
- Increased customization options: Users are demanding more control over how their diagrams look and function. Vendors are responding by offering more customization options, such as adjustable templates and personalized styles, to meet varied user needs.
What is online flowchart software?
Online flowchart software is a cloud-based tool that lets you create and share flowcharts in your browser. You can use it to map out processes, visualize systems, and collaborate with others in real time, no downloads or installations required.
It's popular among project managers, analysts, and remote teams who need a simple way to build diagrams and keep everyone aligned from anywhere.
Features of Flowchart Software
When selecting flowchart software, keep an eye out for the following key features:
- Real-time collaboration: Allows multiple users to work on the same diagram simultaneously, improving team communication and efficiency.
- AI-assisted diagram creation: Uses artificial intelligence to suggest layouts and connections, speeding up the design process and reducing manual work.
- Interactive diagrams: Enables users to create diagrams that respond to input, making them more engaging and informative.
- Version control: Provides a way to track changes and revert to previous versions, ensuring accuracy and consistency in diagrams.
- Customizable templates: Offers pre-designed templates that can be tailored to fit specific project needs, saving time and effort.
- Layered diagram capabilities: Allows users to add multiple layers to diagrams, making it easier to manage and understand complex systems.
- Data encryption: Ensures that all data within the software is securely encrypted, protecting sensitive information from unauthorized access.
- Export options: Provides multiple formats for exporting diagrams, allowing users to share their work easily across different platforms.
- In-editor chat: Facilitates direct communication among team members within the diagramming tool, enhancing collaboration.
- Scenario simulation: Enables users to simulate different scenarios within diagrams, helping teams anticipate and address potential issues.
Benefits of Flowchart Software
Implementing flowchart software provides several benefits for your team and your business. Here are a few you can look forward to:
- Improved communication: Real-time collaboration and in-editor chat features help your team stay connected and aligned on projects.
- Enhanced efficiency: AI-assisted diagram creation speeds up the process, reducing the time spent on manual tasks and allowing more focus on important work.
- Better problem-solving: Scenario simulation and interactive diagrams provide insights into potential issues, helping your team address them proactively.
- Greater flexibility: Customizable templates and layered diagrams let you tailor solutions to fit diverse project needs, making it easier to adapt to changes.
- Increased security: Data encryption ensures that sensitive information remains protected, giving you peace of mind about data privacy.
- Easy sharing: Export options in various formats make it simple to distribute diagrams across different platforms and stakeholders.
- Accurate tracking: Version control allows you to keep track of changes and maintain consistency, ensuring that everyone is on the same page.
Costs & Pricing For Flowchart Software
Pricing generally increases as you add more features, scalability, and support options to your plan. Here are the most common pricing tiers and what's included with each, so you can get an idea of what flowchart software might cost you.
Comparison Table For Flowchart Software
| Plan Type | Average Price | Common Features Included | Best For |
|---|---|---|---|
| Free Option | $0 | Basic tools for diagramming and mapping workflows, limited templates, a small amount of cloud storage, limited options for exporting flowcharts | Smaller startups, single users, students |
| Basic | $5 - $10/month | More advanced flowchart capabilities, access to a template library, extra cloud storage, basic integrations with other software tools | Small businesses, or smaller teams within a larger company |
| Standard | $10 - $25/month | All of the above, plus an increased number of team members, more cloud storage, more options for exporting flowcharts, more integration options | Medium-sized businesses, or departments within a larger company |
| Premium | $25 - $75/month | All of the above, plus the ability to add more (or unlimited) team members, additional cloud storage | Large businesses where everyone needs access |
| Enterprise | Custom Pricing | All of the above, plus additional customization options for integrations, security, and deployment (i.e. on-premise) | Large enterprises and/or company with strict requirements for security and compliance |
Flowchart Software FAQs
Find answers to common questions about this topic.
What are flowcharts good for?
Flowcharts continue to be a great way to visualize data. And visualizing data helps us comprehend and remember information, identify relationships and patterns, and communicate ideas from one person to another. Therefore, it is commonly used to analyze complex processes within organizations.
The first “flow process chart” was described by Frank and Lillian Gilbreth in 1921 as a way to present every detail of a project where every part of the process is dependent upon or affected by every other part.
Today, flowcharts are taught even in grade school as a way to sort ideas, brainstorm, visualize data, build organizational charts, network diagrams, data flow diagrams, and more.
What are the basic flowchart symbols?
The basic symbols are ovals, arrows, lines, parallelograms, rectangles, and diamonds.
Typically, an oval means a start or end point; an arrow (or line) shows a connection, relationship or pathway; a parallelogram indicates some sort of input or output; a rectangle stands for a process; and a diamond represents a decision-making moment.
Using these symbols, you can build out any basic process that represents flow of information from beginning to end and the decision-making checkpoints along the way. For more advanced diagrams, there are symbols that represent documents, manual input, mergine, subroutines, databases and more.
What are the common types of flowcharts?
There are three common types of flowcharts: Process Flowchart, Data Flowchart, and Business Process Modeling Diagram.
However, there are many different types of flowcharts, including but not limited to Swimlane Flowchart, EPC Diagram, SDL Diagram, Cross Functional Flowchart (or Deployment Flowchart), IDEF Flowchart, and Workflow Flowchart.
What are the best free flowchart tools?
Some free flowchart tools (or tools with decent freemium offers) include LucidChart, Creately, Google Drawings, Gliffy, yED, OpenOffice.org Draw, Calligra Flow, and Draw.io. However, the free versions of said software might limit the number of diagrams and shapes you can create/use or limit how many users can collaborate.
What's Next?
If you're in the process of researching flowchart software, connect with a SoftwareSelect advisor for free recommendations.
You fill out a form and have a quick chat where they get into the specifics of your needs. Then you'll get a shortlist of software to review. They'll even support you through the entire buying process, including price negotiations.