If you're a project manager, you've probably heard of Gantt charts. But what are they used for? In this blog post, I’ll outline four key use cases for Gantt charts in project management. I’ll also provide helpful tips on how to create and use Gantt charts most effectively.
So whether you're just getting started with project management or you're looking for ways to improve your workflow, read on! This blog post will look at Gantt charts (most often created with Gantt chart software) and how you can use them effectively in your own projects.
What Is A Gantt Chart?
A Gantt chart is a type of horizontal bar chart that shows the start and end dates of tasks in a project.
Tasks are typically represented as bars, and each bar is usually color-coded to indicate its status (e.g., not started, in progress, or completed). Gantt charts also usually include a timeline that shows when each task is scheduled to start and end along with any key task dependencies (more on what Gantt charts should include here).
In essence, a Gantt chart is a graphical representation of tasks you need to complete within a project.
Gantt chart tools, the most common method for creating modern Gantt charts, can be used by anyone who needs to organize their time and resources, or keep track of deadlines, or show stakeholders a visual map of when key items and milestones are expected to be complete.
Tools like Microsoft Project offer this functionality, but you might feel more comfortable using Microsoft Excel or Google Sheets.
Gantt charts can also show what resources your team needs for each task or project across time. In addition, Gantt charts pair well with resource calendars, allowing you to be sure everything is staffed and tasks will be executed when you need them.
Learn how to make a Gantt chart here.
4 Key Use Cases For Gantt Charts
Gantt charts can be used by anyone who needs to organize their time and resources, or keep track of deadlines, or show stakeholders a visual map of when key items and milestones are expected to be complete. In essence, they allow you to see what needs to be done when it needs to be done, and who is responsible for doing it.
Here are four key use cases for Gantt charts in project management:
- Planning Tasks: shows what needs to be done, when
- Planning Personnel: shows who needs to do what, when
- Planning Physical Resources: shows what physical items or spaces are needed, when
- Tracking Project Deadlines: shows what will be done, when
1. Planning Tasks With A Gantt Chart
A Gantt chart is designed to get your project organized quickly. Gantt charts are often used by employees who have multiple projects on their plate, but they can also benefit freelancers or entrepreneurs with various obligations.
Gantt charts can aid collaboration as team members are planning out task and deliverable completion by providing a single source of truth. Gantt charts can help you visualize what you need to do and how long each task will take, as well as provide a visual of the overall timeline and deadlines.
Gantt charts are most effective when you use them as a visual representation of all tasks that you need to complete in order for the overall project to succeed. What I often tell my project managers is to start on paper. Draw out on a calendar what needs to be done, when. It might be helpful to start with a network diagram or project workflow diagram first.
If you can draw the project tasks out on paper, you likely understand it well enough. Once a draft is on paper, then you can make your way to the computer to commit it to a project management tool (most project management tools and apps have a Gantt chart feature these days).
Note about the critical path: in project management, the critical path is the sequence of tasks that are essential to the completion of a project. If any of these tasks are delayed, it will affect the deadline for the entire project.
The critical path is therefore important to track and monitor closely in order to ensure that the project is on schedule. Most Gantt charting tools will identify the critical path for your project based on dependencies.
To get started, consider mapping out the tasks associated with the project in a workflow diagram.
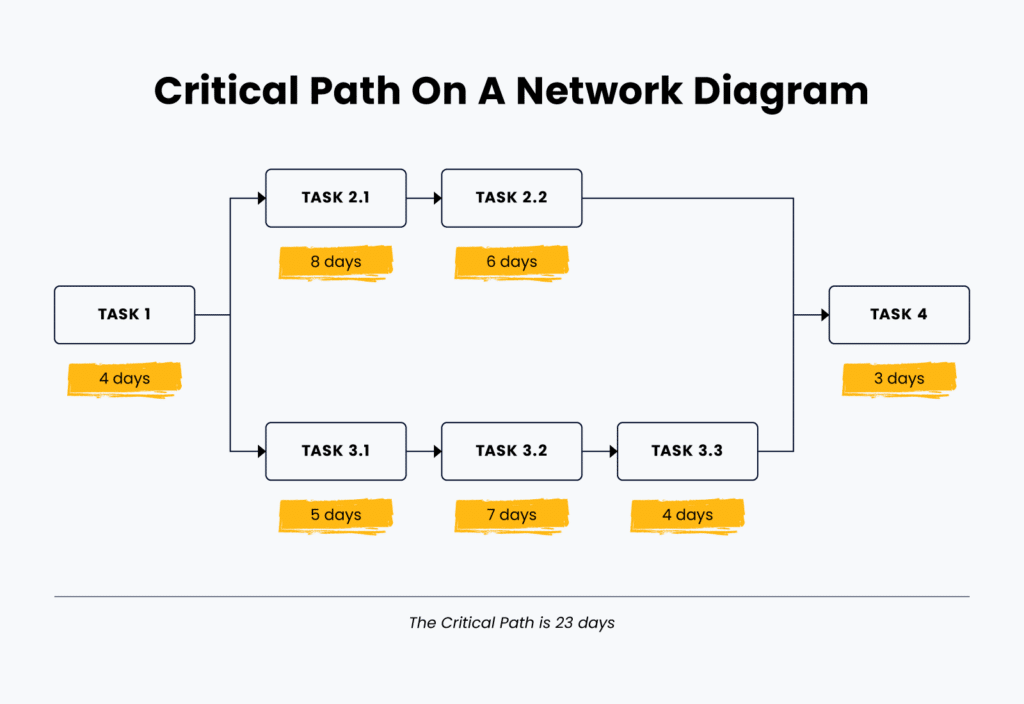
Next, sequence those tasks and determine dependencies. What needs to get done, in what order, and what can’t start until another task is completed?
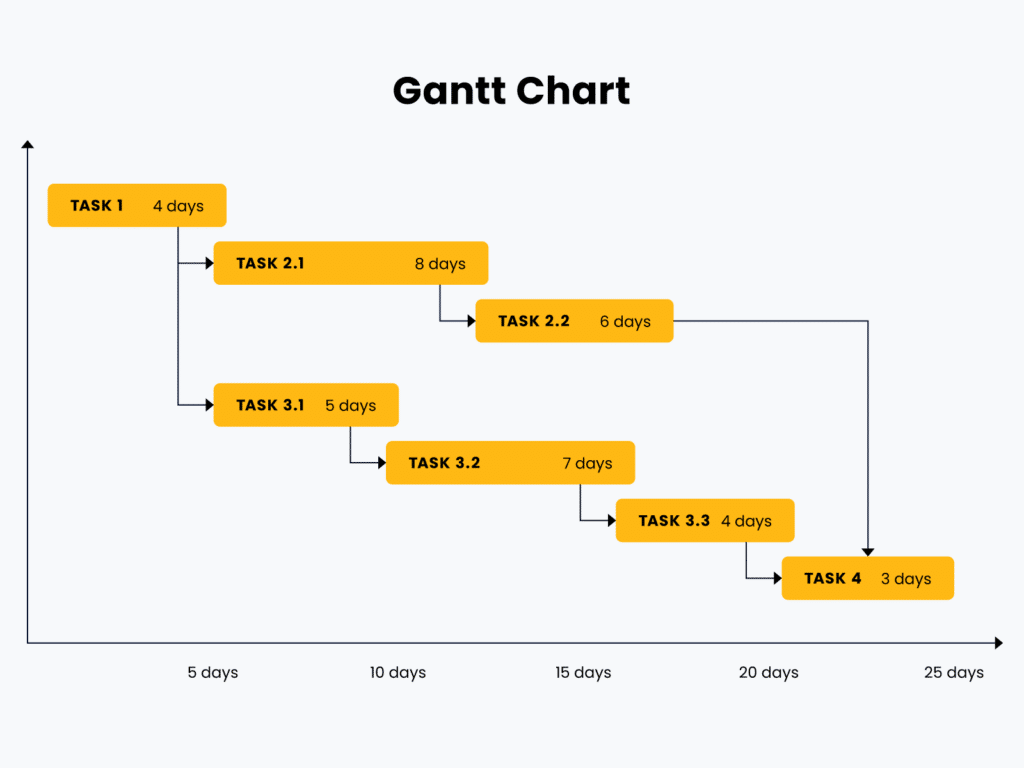
Tasks That Can Be Planned With A Gantt Chart
Many tasks will benefit from a Gantt chart. Whether you need to plan out how long it will take to complete a project, need to be sure dependencies are mapped clearly, or you want to make sure your team has synced their schedule and deadlines, Gantt charts can help tremendously!
The most common use of Gantt charts is to plan tasks that are sequential in nature. You can use Gantt charts for project management, quality assurance, and any other time-sensitive task that will impact the project timeline.
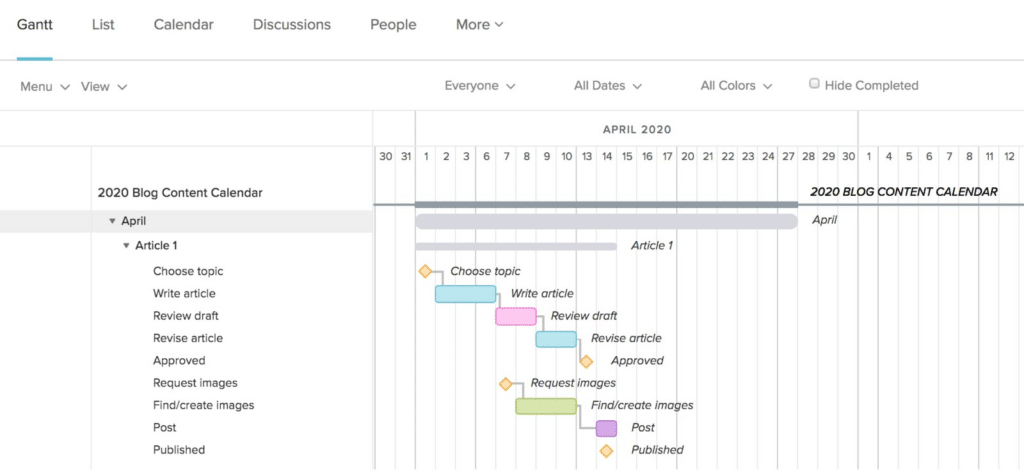
For example, a blog publishing initiative requires blogs to be written before they can go to copywriting, creative design, and final publication. These tasks are dependent on each other and cannot be done out of sequence in most cases. A Gantt chart can clearly show the dependencies and the total time required to complete the tasks required to publish a blog.
Steps To Planning Tasks With A Gantt Chart
A Gantt chart will show all the tasks for your project and how long it should take to complete each task.
- The first step is to gather the information that is needed to develop the Gantt chart. This includes a list of tasks along with estimated start dates and end dates.
- Once you have gathered your information, determine how long it will take to complete each task by using data or estimates based on experience with similar projects.
- After you have determined the task duration, it's time to create your Gantt chart. Remember, you can start this on paper and then make your way to a tool once it's worked out! Find your own style and preference in creating Gantt charts.
- Once you create the Gantt chart, it's time to assign a team member to each task. Gantt charts are most effective when all members of the project have specific responsibilities, meaning, when they can clearly see what work they are responsible for and how it impacts the other tasks in the project.
- Now that you've assigned tasks, share a version of the Gantt chart with your team and make it a key artifact of your project work. With a Gantt chart, each task and member’s planned start and finish dates are visible to the whole group. Gantt charts should be updated at least weekly so that you can track progress and adjust if necessary.
Need a quick win? Learn how to draw a Gantt chart in less than a minute.
2. Planning Personnel Resources With A Gantt Chart
Gantt charts are also great for planning personnel resources, as they allow you to track each person's task allocation and schedule throughout the whole project timeline. Gantt charts are especially helpful in planning personnel resources when a project involves overlapping tasks or there are multiple and complex projects requiring the same person's attention.
Gantt charts help identify when a task should be completed and what the duration is, which helps with short-term planning and long-term scheduling. Gantt charts can also help you identify when there are too many tasks going on at the same time. If you see things falling behind schedule, this is a sign that your team may need some assistance from other departments or that scheduling adjustments are needed.
Steps To Planning Personnel Resources
- Identify tasks, their sequence, and any dependencies. Identify the critical path and any other non-negotiable requirements.
- Decide what personnel resources will work best for your project based on skill sets or task allocations. It’s important to schedule personnel resources so that people are only allocated to tasks that utilize their skill set. If you’re not sure who is good at what, ask your project team! A collaborative approach works best when assigning tasks.
- Create and publish the Gantt chart with personnel resourcing details with your team, including stakeholders. Consider utilizing a resource calendar to be sure you minimize overcommitting individual members of the project team.
- Update your chart at least weekly so that they stay up to date and as accurate as possible. Give all team members access so everyone on the team understands the chart's critical path, project schedule, start date, end date, etc. Also be sure the team knows who to contact if they see issues with the plan or need to shift their work. Feedback and team collaboration is key!
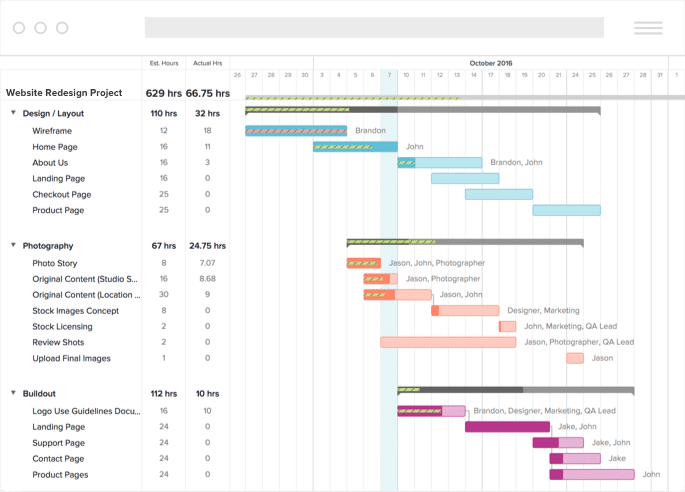
Tip: Many software tools allow allocation of tasks to individuals or teams directly in the tool! For example, Team Gantt allows resource management directly in the tool, integrated as a Gantt chart.
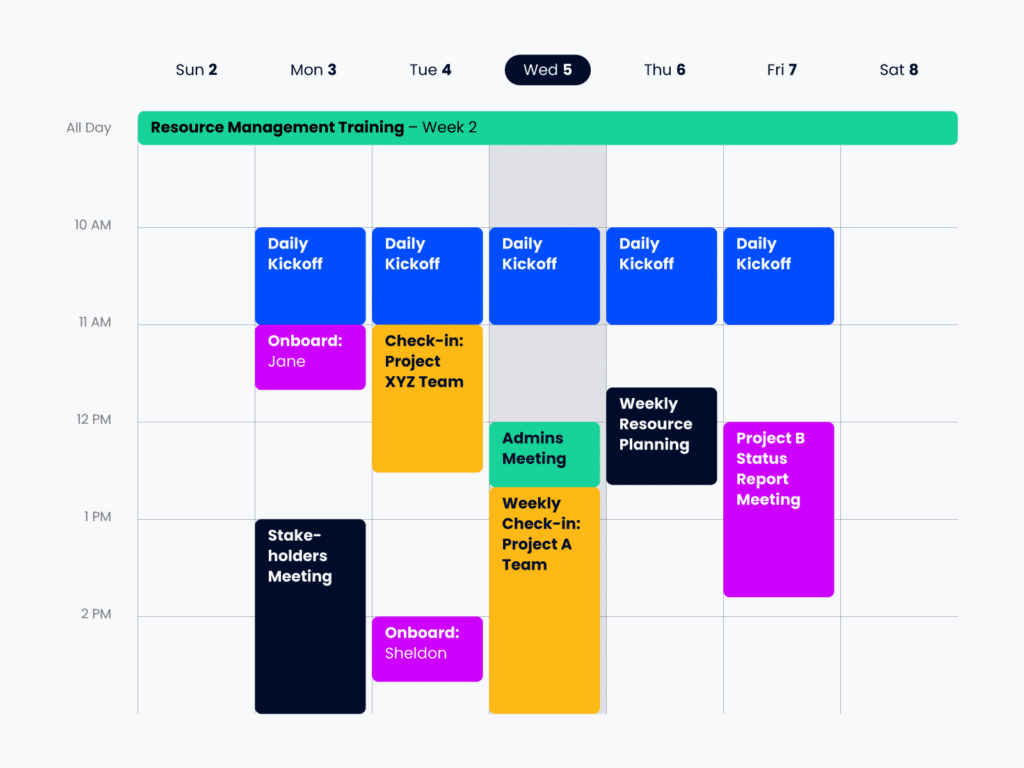
Another way to think about resource Gantt charts: Think about your calendar, it's basically a micro-level Gantt chart turned on its side, with hours being counted instead of days. I can’t be in two meetings at one time, so my calendar helps to ensure I’m not double-booked and can focus on the task at hand.
3. Planning Physical Resources With A Gantt Chart
Gantt charts are also great for planning and allocating physical resources. Using this organizational method can help you identify when there is too much or not enough of a specific physical resource, allowing for more efficient, effective task completion. Consider utilizing a resource calendar to be sure you minimize overcommitting individual resources that contribute to your project, including physical resources.
Put simply, a Gantt chart can help you avoid meeting room conflicts, overuse of software licenses, and other project conflicts. A Gantt chart for physical resources helps to visualize and plan what will be in-use, when.
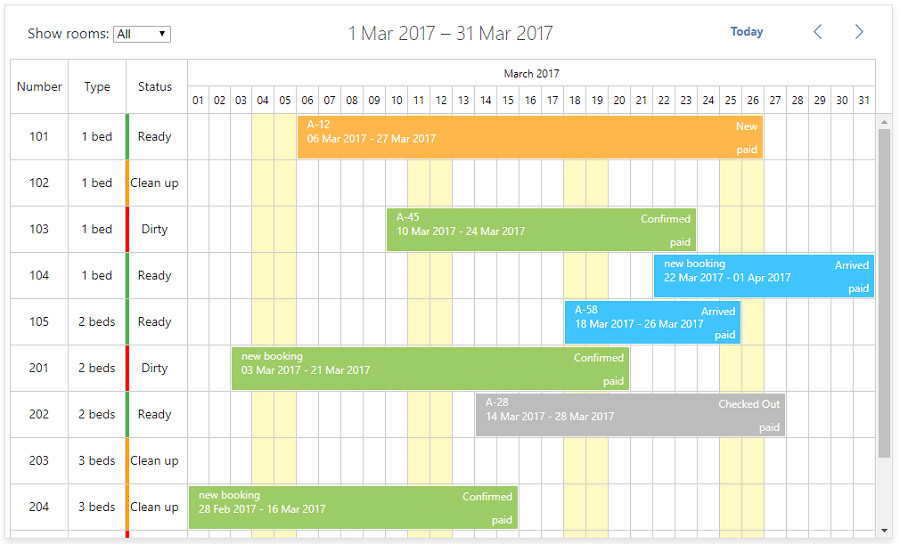
The easiest example of a Gantt chart for physical resources is to think about hotel room booking. There are 10 rooms, and each is booked over certain days. A Gantt chart clearly shows which room is booked when, and when it will be free again. Then the fun begins when trying to book additional guests into the existing schedule without double-booking any of the rooms!
Physical Resources You Can Plan With A Gantt Chart
Generally, there are three types of physical resources:
- Equipment (ex. computers, software, limited software licenses or specialized tools)
- Facilities (ex. buildings, meeting rooms, hotel rooms)
Steps To Planning Physical Resources
There are six steps to building a Gantt chart for physical resources:
- Identify available resources: ex. Number of hotel rooms
- Identify any key details about the resources: ex. 1 bed, 2 beds, 3 beds in a room
- Identify the operational status of the resources: ex. Power doesn’t work in room 3, should not be bookable, room 5 needs the carpets cleaned, which will be done this week
- Gather details of existing bookings across physical resources: ex. Previously booked reservations that will limit new reservations
- Add your needed resource reservations to the chart. See if you can in fact get the physical resources you need when you need them. If they are already booked, get ready to make adjustments.
Tip: The best resource managers keep Gantt-style charts for all resources. Open up the calendar for some of your meeting rooms or look at a hotel calendar to get a sense of this.
4. Tracking Project Deadlines With A Gantt Chart
Naturally, project managers can use a Gantt chart to layout project deadlines and identify what needs to happen when. As mentioned, Gantt charts include information on the critical path of your project by identifying each task’s duration, start date, end date, key dependencies, and more.
Because of their ability to identify the critical path, Gantt charts are an excellent way for project managers and teams involved in planning out durations on tasks. This can be useful information when deciding what needs priority or if there's anything that might cause delays within your plan because it provides insight into how long everything takes based on different start dates (and end dates!).
Types Of Project Timelines You Can Manage With A Gantt Chart
- Task due dates: these are the deadlines for individual tasks that you and your team need to meet.
- Milestones: these are significant markers that indicate your project progress is on track.
- Project due dates: these are dates that indicate when your project will be complete.
All your project deadlines should be mapped out and agreed upon during the planning stage of your project. As things change, the Gantt chart should be updated based on real results to allow shifting of expectations based on real results. Remember, communication is key!
Steps For Planning Project Deadlines
I’ve condensed planning timelines into six easy-to-follow steps.
- Determine the scope of your project and key requirements from stakeholders. Gain commitment from stakeholders on the scope of the project.
- Break down large tasks into smaller activities. The only way to eat an elephant is one bite at a time.
- Plan out the project activities in a logical order and note any key dependencies across tasks.
- Estimate start and end dates for each task, noting dependencies (tooling is great for this).
- Estimate the resources needed to complete each task or type of task. Resourcing can be at the team or individual level. Use a resource calendar to ensure resources are available to execute the tasks you are looking to assign to them! Shift and align as necessary.
- Estimate how long it will take to complete each activity, task, and the project as a whole, noting key dependencies, resource constraints, and committed timing requirements. Shift and align as necessary, just be sure to keep all teams and stakeholders involved.
- Compile all the information from the steps above into a Gantt chart and share widely. Socialize the chart with the project team and stakeholders so they too can visualize what’s happening, when, and by whom it will be completed. Keep the Gantt chart up to date so everyone has a clear view of what’s going on and can raise any issues quickly and effectively.
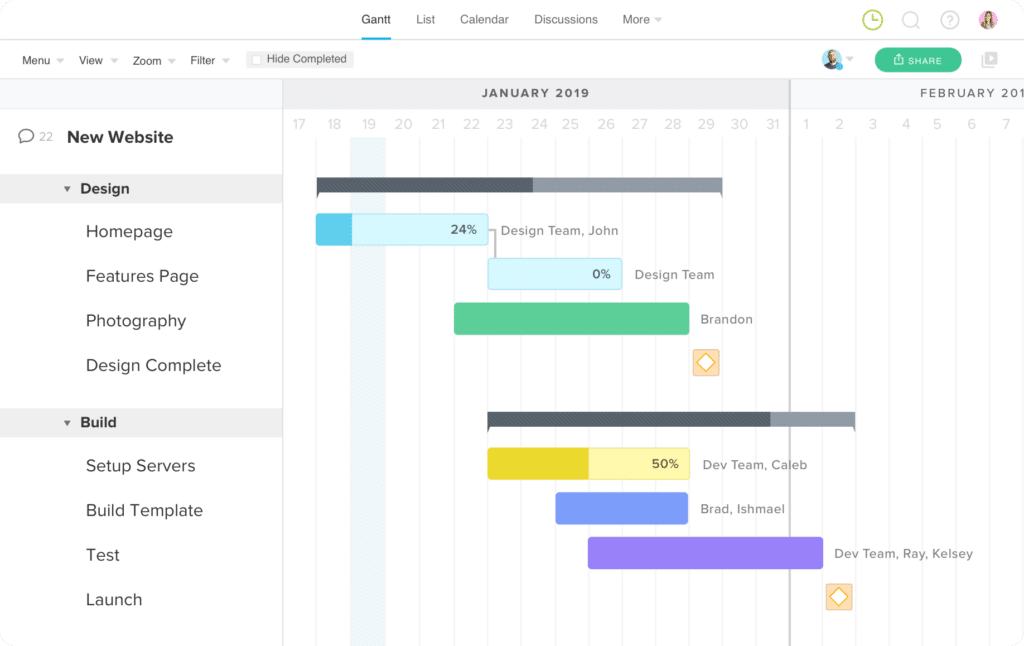
For example, a team has engaged a project manager to guide the creation and launch of a new website. The project manager has identified a design and build workstream.
A Gantt chart is created across key task areas: homepage, features pages, photography, server setup, template build, and more. A project manager gets started mapping these key tasks in a Gantt chart and is able to estimate the milestone and completion date for the project.
What Do You Use Gantt Charts For?
The most successful project managers use Gantt charts to visualize their work, showing tasks over time, resource allocation, dependencies, and milestones. Being an expert in project planning is essential to setting up the project effectively and getting the project team working with momentum at the outset.
If you want everyone aligned and on the same page, a Gantt chart is an essential tool to build and keep up to date. Especially for visual learners and leadership, a Gantt chart helps display what is happening, when and by whom. Clarity is key to building confidence that the project team knows what they are doing and will deliver a successful project.
If you're looking for a template, download our Gantt chart template here.
Now that you’re more of an expert on Gantt charts and how they help with project planning, you can find the right online Gantt chart software and/or project management software for your needs here:
- The 10 best Gantt chart software overall, if you are looking for a full-featured tool that incorporates other features for project management.
- Free Gantt chart software if you’re on a budget as a small business, start-up, or non-profit.
- The 10 best Gantt chart makers for pure Gantt functionality, although most tools on that list also have some additional functionality thrown in.
