10 Best Gantt Chart Software Reviewed For 2026

10 Best Gantt Chart Software List


The best Gantt chart software helps you create and manage Gantt charts, makes it easier to plan and track projects, and lets you stay on top of deadlines, resources, and progress without the hassle. Without the right Gantt chart tool, you'll struggle to identify bottlenecks, hit project milestones, and report on project progress to clients.
I've reviewed 20+ Gantt chart software tools using my 15+ years of experience in project management and planning. I can help you find the right tool to create an airtight project plan and maintain visibility on progress, account for dependencies, and keep work on track to meet deadlines. Read my analysis of each Gantt chart software, key features, and use cases below.
Why You Can Trust Us
We’ve been testing and reviewing project management software since 2012. As project managers ourselves, we know how critical and difficult it is to make the right decision when selecting software.
We invest in deep research to help our audience make better software purchasing decisions. We’ve tested more than 2,000 tools for different project management use cases and written over 1,000 comprehensive software reviews. Learn how we stay transparent & our software review methodology.
Compare Software Specs Side-by-Side
Compare pricing and specs for my picks for the best Gantt chart software so you can find the right fit for your business needs and budget.
| Tool | Best For | Trial Info | Price | ||
|---|---|---|---|---|---|
| 1 | Best Gantt chart software for task management & collaboration | 14-day free trial | From $9/user/month (billed annually) | Website | |
| 2 | Best for its easy and intuitive timeline with drag-and-drop functionality | Free plan available | From $7/user/month (billed annually) | Website | |
| 3 | Best for dynamic timeline planning | 30-day free trial + free plan available | From $7.65/member/month (billed annually) | Website | |
| 4 | Best for task dependencies and critical path | Free plan + free demo available | From $4/user/month (billed annually) | Website | |
| 5 | Best Gantt chart software with built-in communication tools | Free plan available | From $8/member/month (billed annually) | Website | |
| 6 | Best for small teams and businesses | Free plan available | From $12/month (billed annually) | Website | |
| 7 | Best for Microsoft users | 30-day free trial | From $10/user/month (billed annually) | Website | |
| 8 | Best for software development teams | Free plan + free 30-day trial available | From $35/month (up to 30 users) | Website | |
| 9 | Best for creating Gantt charts and timelines directly in PowerPoint | Free plan available | Pricing upon request | Website | |
| 10 | Best Gantt Chart tool for customizability | Free plan available | From $4/user/month (billed annually) | Website |

-

Celoxis
Visit WebsiteThis is an aggregated rating for this tool including ratings from Crozdesk users and ratings from other sites.4.4 -
Smartsheet
Visit WebsiteThis is an aggregated rating for this tool including ratings from Crozdesk users and ratings from other sites.4.5 -
Accelo
Visit WebsiteThis is an aggregated rating for this tool including ratings from Crozdesk users and ratings from other sites.4.4


Best Gantt Chart Software Reviews
Here’s a brief description of each Gantt chart tool on my list, including what the tool does best and some of its features and integrations.
Best Gantt chart software for task management & collaboration
monday.com is a provider of multiple software solutions, covering different aspects of business processes, from creative and design, software development, and marketing to project management, sales and CRM, as well as HR and task management. With a work management suite, monday.com can facilitate many things related to project planning and resource tracking. Gantt charts are just one of the core features available in their project management software suite.
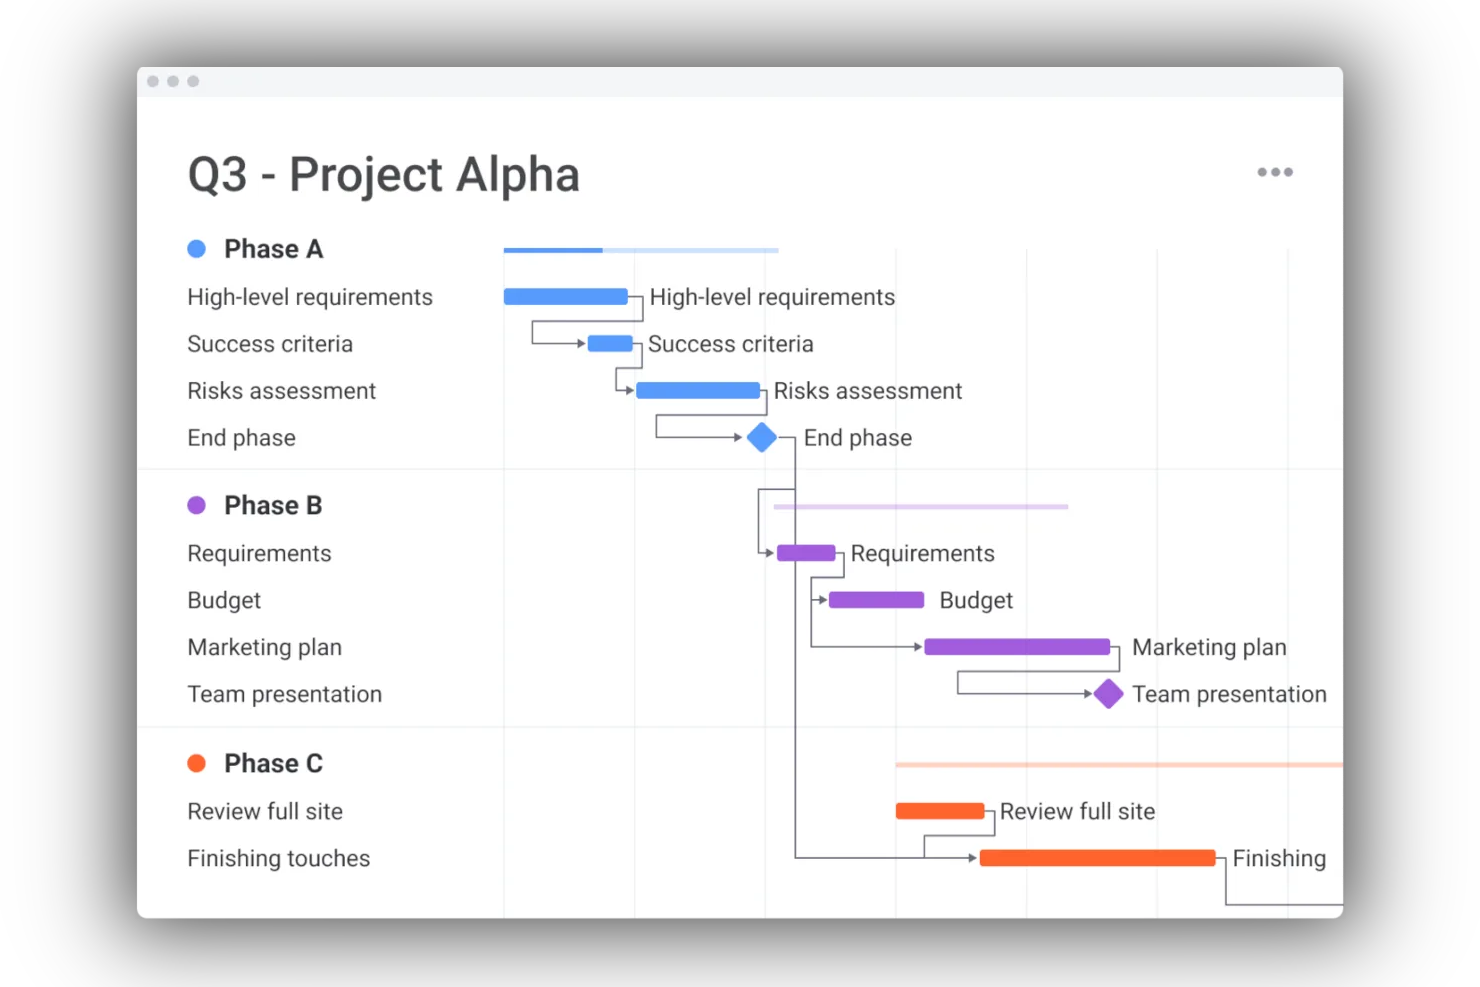
Why I Picked monday.com: monday.com’s Gantt charts software solution provides project managers and teams with a quick overview of their project timeline. It lets them see upcoming deadlines on tasks and projects and keep track of the status of multiple active tasks in real time. Creating Gantt charts with monday.com project management software is relatively easy. Users can customize the charts in minutes to facilitate the needs of their team. They even have the ability to take their Gantt charts on the go and remain up to date on project progress using monday.com’s mobile app.
Gantt charts that are created on monday.com will often begin with a dynamic table view, allowing users to add all important information related to the current or upcoming project. While Gantt charts are extremely useful for monitoring project progress, they don’t necessarily work for everyone. This is why monday.com doesn’t rely on Gantt charts alone to visualize project timelines. The platform also provides Kanban board and calendar views.
Although monday.com offer a freemium plan, this does not include Gantt charts so it will not be sufficient for your needs. Instead, use their free trial to test out the software.
monday.com Standout Features & Integrations
Features include project management, task scheduling/tracking, resource management, scheduling, budgeting, API, calendar management, Gantt charts, file sharing, time management, email integration, third party plugins, and notifications.
Integrations include project management apps like Slack, Google Drive, Gmail, Google Calendar, Jira, GitHub, Trello, Dropbox, Typeform and many more, accessible through a paid plan with Zapier.
New Product Updates from monday AI Workspace

monday.com Adds Managed Columns Across Boards
monday.com adds Managed Column to let teams standardize and reuse column labels across multiple boards from a single source of truth. The update helps organizations maintain consistency, clarity, and centralized control at scale. For more information, visit monday.com’s official site.
 .
.ClickUp
Best for its easy and intuitive timeline with drag-and-drop functionality
ClickUp is a cloud-based project management and collaboration app that is highly customizable and enables you and your teams to manage everything from within a central platform, including project-related tasks, team communications, documents, and goals.
Why I Picked ClickUp
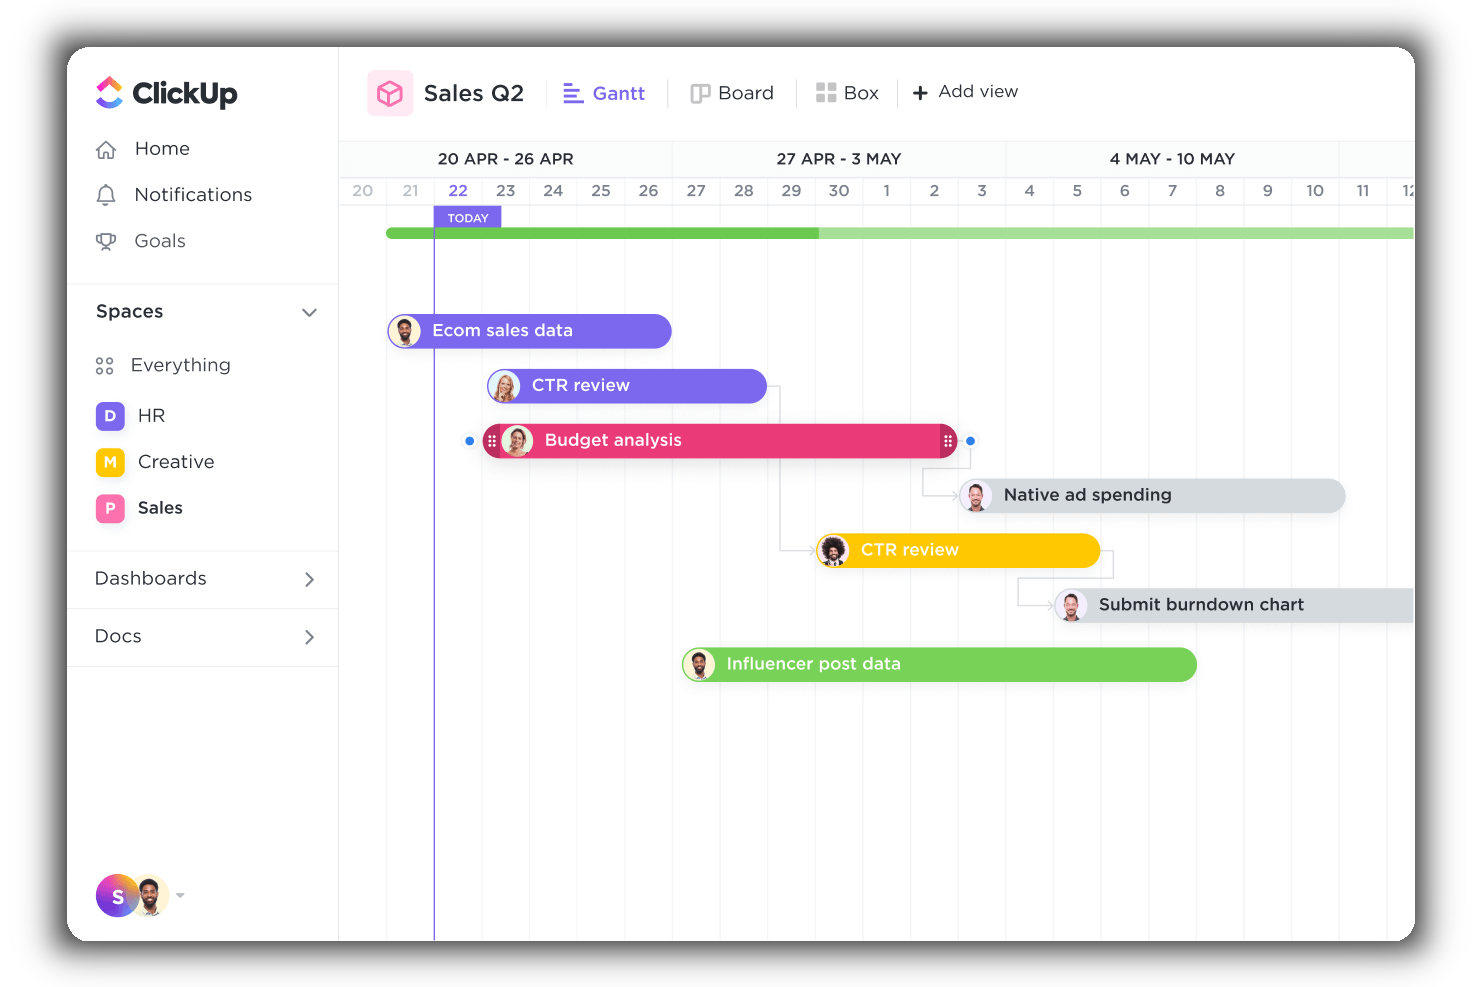
ClickUp has an intuitive Gantt view that enables you to manage dependencies, schedule, and prioritize elements into a clear project timeline. This view offers a dynamic drag-and-drop timeline to easily schedule multiple tasks, keep track of project progress, manage deadlines, and handle potential bottlenecks.
Additionally, it provides users with a bird’s eye view of all active projects, spaces, lists, and tasks. It uses a color-coding system, so you and your stakeholders can instantly know what’s happening when and where. Finally, you can use timeline filters to arrange the information by assignee, due date, status, and more.
ClickUp Standout Features & Integrations
Features include task scheduling/tracking, project management, resource management, budgeting, contact management, data visualizations, employee database, expense tracking, file sharing, third-party plugins, collaboration support, timesheets, roadmapping, chat, customer management, email integration, feedback management, and process reporting.
Integrations include native integrations with Slack, Google Workspace, Dropbox, and many more tools, as well as over 1,000+ integrations through Zapier (may incur additional costs).
New Product Updates from ClickUp

ClickUp Introduces Brain² Company AI
ClickUp has introduced Brain², a self-improving company AI that routes to the best models and can complete work such as websites, slides, and project management tasks. For more information, visit ClickUp's official site.
 .
.
Quire is a project management tool built around the idea of breaking down big goals into smaller, manageable tasks. It’s designed for teams that need a flexible way to visualize, track, and execute their work across different stages.
Why I Picked Quire: Quire's dynamic timeline feature provides a Gantt chart-like visualization that enables teams to schedule and monitor project milestones. This view allows users to map out tasks over time, adjust timelines, and identify potential bottlenecks, facilitating better planning and resource allocation.
Additionally, Quire supports task dependencies, allowing users to define relationships between tasks and understand how delays in one area can impact the overall project timeline. This feature is crucial for complex projects where tasks are interrelated, as it helps in identifying the critical path and ensuring timely completion.
Quire Standout Features & Integrations
Features include a calendar view that enables teams to schedule tasks and deadlines visually, enhancing time management and coordination. The collaborative document feature also provides a centralized space for storing project-related information, notes, and updates, ensuring that all team members have access to the latest data.
Integrations include Google Calendar, Gmail, Slack, Outlook, Zoho Flow, GitHub, Apple Calendar Sync, Box, Dropbox, Google Drive, and Microsoft Teams.
Pros and Cons
Pros:
- Ability to create nested tasks and subtasks, allowing for detailed project breakdowns
- Multiple project views, including lists, boards, and timelines
- Easy to collaborate with team members
Cons:
- Potential for notification overload, especially when working with large teams
- The mobile version lacks some features available on the desktop
New Product Updates from Quire
Quire Enhances Chat Editing and Text Formatting
Quire introduces updates to its chat functionality to improve collaboration and message formatting. These enhancements make it easier for teams to edit messages and structure text within conversations. For more information, visit Quire’s official site.
 .
.
When you seek a solution that marries visual project management with robust functionality, Zoho Projects stands out. It caters to project managers, team leaders, and freelancers who need a dynamic tool to organize tasks, track progress, and manage timelines effectively. With its intuitive Gantt chart capabilities, Zoho Projects helps you address challenges like project scheduling and resource allocation, allowing you to focus on delivering successful outcomes.
Why I Picked Zoho Projects
I picked Zoho Projects for its strong emphasis on Gantt chart functionalities that cater to the needs of project managers seeking visual clarity. The platform features task dependencies that allow you to map out how tasks relate and influence each other, ensuring seamless project flow. Additionally, its critical path analysis helps you identify the most important tasks that could impact your project timeline. These features make Zoho Projects a compelling choice for those who prioritize meticulous planning and scheduling.
Zoho Projects Key Features
In addition to its Gantt chart functionalities, Zoho Projects offers other valuable features that enhance project management.
- Task Management: This feature allows you to create, assign, and manage tasks within your projects, ensuring everyone knows their responsibilities.
- Time Tracking: You can log hours spent on tasks, which helps in billing and understanding where your team’s time is allocated.
- Issue Tracking: This feature lets you identify and resolve issues quickly, maintaining the quality and progress of your projects.
- Team Collaboration: With tools for communication and document sharing, your team can collaborate effectively, regardless of location.
Zoho Projects Integrations
Integrations include Zoho CRM, Slack, GitHub, Microsoft Teams, Google Drive, Dropbox, Zapier, Zoho Books, Zoho Desk, and Zoho People.
Pros and Cons
Pros:
- Integrated time and issue tracking
- Strong task dependency management
- Advanced Gantt chart planning tools
Cons:
- Mobile Gantt features limited
- Learning curve for new users
New Product Updates from Zoho Projects

Zoho Projects Adds Zia Suggestions for Weekly Time Logs
Zoho Projects has introduced Zia suggestions for weekly time logs, letting users ask Zia to auto-suggest time entries based on assigned tasks and recorded work hours. For more information, visit Zoho Projects' official site.
 .
.
Miro is a collaborative online whiteboard tailored for creating Gantt charts, among other visual planning tools. Its infinite canvas supports a broad expression of ideas, whether through text, images, or videos, facilitating detailed and accessible project visualizations.
Why I Picked Miro: Miro is designed for real-time collaboration and comes equipped with tools such as voting, sticky notes, and comments. This approach enables teams to adjust and discuss plans directly within the workspace and encourages active participation and immediate feedback among team members.
Moreover, Miro stands out by allowing users to upload and build upon existing charts from various platforms, ensuring no previous work is lost during the transition. This ensures seamless integration into Miro’s interactive space, allowing further development and fostering continuous workflow and collaboration without the need to start over.
Miro Standout Features & Integrations
Features include over 1,000 pre-made templates or various uses such as Gantt charts, Kanban boards, and mind maps, built-in communication tools, including video conferencing and TalkTrack to record process videos to be viewed asynchronously, as well as quick diagram tools, a planner tool, and a dependencies app.
Integrations include Zoom, Figma, Asana, Microsoft Teams, Monday.com, Confluence, Jira, Slack, Google Drive, Box, Airtable, Notion, Azure, and Webex. Some integrations are limited to paid plans only.
Miro is free to use for unlimited members with up to 3 editable boards. Paid plans start at $8/user/month (billed annually).
Pros and Cons
Pros:
- Built-in communication features for streamlined collaboration
- Intuitive and easy setup
- Free forever plan available
Cons:
- Free version does not allow high-quality export to pdf
- Zooming can be jumpy on larger projects
- Visitor/guest accounts locked to paid plans only
New Product Updates from Miro
Miro Adds Japan Data Residency for Enterprise Customers
Miro has introduced Japan data residency for enterprise customers, offering in-region storage for production data, backups, and metadata, plus in-region compute infrastructure. For more information, visit Miro's official site.

Canva is a Gantt chart maker and design program with over 1 million free shapes and photos in their asset library and hundreds of thousands of product templates. Canva does more than just Gantt charts: You’ll find templates for slideshows, presentations, infographics, graphs, emails, and more. They have a simple drag-and-drop interface that makes it easy for non-designers to create aesthetically pleasing designs with minimal effort.
Why I Picked Canva: They offer quite a bit for their price, per our evaluation criteria, but free users won’t have access to everything. While Canva is free to tinker with, it will cost you to use certain designs, shapes, patterns, and templates. It will also cost you to download your work in any functional format (besides a mere screenshot). Still, the price is ideal for smaller businesses that are looking for Gantt charts along with other marketing graphics but don’t have a budget for an in-house designer.
Furthermore, if the only thing you need is Gantt charts then Canva doesn’t offer the range of robust data detailing that other programs do. Rather, it’s strength comes from the clean simplicity of its designs. If your project requires an in-depth, multifaceted timetable, Canva probably won’t be for you.
Canva Standout Features & Integrations
Features include Gantt chart templates, whiteboards, presentations, social media integration, video, print products, marketing, drag-and-drop editor, photos & graphics library, collaboration, and third-party integrations/plugins.
Integrations include WordPress, eClincher, Rippling, Sendible, Post Planner, and Viraltag. As you can probably tell, their focus with integration is on social media and/or content creation – if you need to access PM or workflow apps, you’re out of luck.

Microsoft Project Online uses a familiar software UI to give you an intuitive way to visualize various project angles. MS Project Online is a great example of Gantt chart template software, offering loads of built-in templates and familiar scheduling tools that make it easy to launch and navigate each assignment. The Gantt chart builder lets you select items for phase indicators, start and end dates, and RAG risk status.
Why I Picked Microsoft Project Online: Unlike some of the other software on this list, MS Projects doesn't have the same number of features and functions despite the higher licensing cost for the full suite of tools. Therefore, they fall short in our value for money spend evaluation criteria, meaning they aren’t the best for small business or startups.
Collaboration is limited by the fact that a project file cannot be opened by multiple team members at the same time. Changing schedule dates is not as seamless as it should be and often ends up causing chaos across the timeline. MS Projects is definitely geared towards large-scale projects and might not work for smaller workflows.
Microsoft Project Online Standout Features & Integrations
Features include project management, resource management, task management, scheduling, portfolio management, dynamic scheduling, business intelligence, Gantt charts, kanban boards, collaboration, reporting, roadmaps, timesheets, and demand management.
Integrations include MS Office suite, OneDrive, Outlook, Skype, and OneNote.

Backlog is a cloud-based project management tool perfect for developers and the teams they collaborate with. Backlog provides a mobile app on both iOS and Android for collaborating on-the-go.
Why I Picked Backlog: Backlog provides a range of useful team collaboration features including task management (including subtasks, checklists, and custom fields), milestones, burndown charts, file management, wikis, and most importantly, a Gantt chart maker. But Backlog is more than a collaboration and Gantt chart tool. It’s also a bug tracker and version control system in one.
For collaborating on code, Backlog provides SVN and Git repositories, a differences viewer and inline comments, plus pull requests, merge requests, and branches. Visually, the app provides burndown charts, Git graphs, and Gantt charts, so project managers and users alike can quickly assess projects at a glance.
Backlog allows you to assign, track, and release work, right in one app while ensuring transparency and accountability across teams. If you’re looking for a tool to help manage development projects or working closely with a team of developers, this is the app for you.
Backlog Standout Features & Integrations
Features include Gantt charts, boards, burndown charts, issue tracking, custom fields, milestones, versioning, notifications & alerts, code management, documentation management, file sharing, and third-party integrations/plugins.
Integrations include Typetalk, Cacoo, Nulab Pass, Slack, Redmine, Jira Importer, Jenkins, iCal Sync, email platforms, Google Sheets, and LambdaTest. You can also build your own integrations and add-ons with Backlog's API.
Best for creating Gantt charts and timelines directly in PowerPoint

Office timeline is a project planning tool that enables users to create visually appealing timelines and Gantt charts directly within Microsoft PowerPoint or through its web-based tool. It also allows you import data directly from Excel and access a wide variety of customizable templates.
Why I picked Office Timeline: Office Timeline integrates smoothly with essential tools like MS Project, Excel, and PowerPoint, making your data visualizations not just easy but efficient. It also stands out for its dual offering of a PowerPoint add-in and a web-based tool, catering to different user preferences and project needs.
You'll love the intuitive design and customizable templates that let you create professional-looking project visuals without needing to be a design whiz. This tool makes your project management tasks as straightforward as possible, allowing you to focus more on the project and less on the process of reporting it.
Office Timeline Standout Features & Integrations
Features include the desktop add-in which offers a variety of customizable templates for timelines, Gantt charts, and roadmaps, while the online version facilitates quick creation and sharing of project visuals from any web-enabled device. The software's vast array of design options and templates allows users to tailor their project timelines to the audience's needs, whether for high-level executive briefings or detailed team updates.
Integrations include tools like Jira, Project, Excel, and Smartsheet. These let you import data and manipulate it so you can get the PowerPoint visuals you need for your stakeholder presentations
Pros and Cons
Pros:
- Free, customizable templates
- Intuitive and easy to use
- Directly integrates Microsoft PowerPoint
Cons:
- Dependency on Microsoft ecosystem can be limiting
- Inflexible pricing options
GoodDay is a work management platform for building Gantt charts to plan projects, allocate resources, and manage tasks, subprojects, events, and dependencies. It’s an affordable all-in-one tool for project management, tasks collaboration, planning, reporting, and productivity with an easy-to-use interface.
GoodDay lets you customize Gantt chart views, columns, the user interface, fields, task types, project templates, and priorities. Additional functionalities include auto-zoom, export to PDF, and filtering.
GoodDay integrates with hundreds of apps such as Google Drive, Google Calendar, Gmail, Slack, GitHub, Gitlab, Excel, Jira, Trello, and many others, accessible via native integration. More integrations are available through Zapier and GoodDay Api.
GoodDay costs from $4/user/month and offers a free-forever version for up to 15-user teams.
Other Gantt Chart Software
Here are a few additional apps that didn’t make my shortlist, but which are worth your consideration if you want to expand your research.
- Visor
For creating Gantt charts collaboratively
- Vault ERP
Gantt chart software for enterprise scalability
- GanttPRO
Gantt chart software for workload visualization
- Smartsheet
For Gantt chart templates
- Productive
For all-in-one agency management & planning
- Wrike
Collaborative Gantt chart software
- airfocus
For project prioritization
- Bonsai Agency Software
For agency project management
- Instagantt
Add-on for Asana users
- GoodDay
For customizable auto-scheduling
- Hub Planner by Milient
Gantt chart software with integrated time tracking & approval
- Paymo
Free Gantt chart software
- MindView
For built-in mind mapping capabilities
- TeamGantt
Online Gantt chart software


How I Evaluate Gantt Chart Software
I split my evaluation into baseline criteria—like interactive timelines, task dependencies, and critical path—and differentiators that separate good tools from great ones for PMOs and project teams.
Core Functionality (Table Stakes For This List)
When I'm selecting tools for my list, I rank each one on a scale from 0 (does not offer the functionality) to 5 (excels in this area) for each core functionality listed below. Then, I calculate the tool's total score into a percentage. Each tool needs to achieve a minimum total score of 75% to be considered for inclusion.
- Interactive Gantt Timeline: I check whether task bars support drag-and-drop rescheduling across multiple time scales, since a static, view-only timeline adds friction when plans change mid-sprint.
- Task Dependencies: Each tool should let you link tasks with all four relationship types and automatically reflow downstream dates when a predecessor slips.
- Milestones & Phases: I look for the ability to mark key delivery dates and nest tasks under summary groups, like separating a product launch into design, development, and QA phases.
- Critical Path & Baselines: Tools that calculate the critical path and let you save baselines make it easy to spot schedule drift before it impacts a deadline.
- Resource Assignment: I evaluate how each tool handles assigning people to tasks and surfacing workload, especially when team members are shared across multiple projects.
- Progress Tracking: Percent-complete indicators on task bars and planned-versus-actual overlays help me assess whether a tool gives real visibility into schedule health.
Once I have a list of tools that meet this criteria, I consider what sets each platform apart.
Differentiating Factors (What Sets Vendors Apart)
Here's how I compare and contrast different vendors:
Standout Features
Portfolio roll-ups matter when you're managing multiple projects. I look for tools that aggregate timelines into a single master view so PMO leads can spot conflicts across teams. Auto-scheduling is another differentiator; when a task slips, the best tools reflow every downstream date without manual edits. I also evaluate how each tool handles stakeholder sharing, since many project managers need to send clean, view-only timelines to clients or executives who don't need a full login.
Beyond Features
Integrations weigh heavily in my evaluation. A Gantt tool that syncs with Jira, Slack, or MS Project fits into existing workflows instead of replacing them. I also consider how each vendor handles onboarding—specifically whether they offer .mpp and CSV imports, since migrating active schedules into a new tool can stall adoption. Pricing structure matters too. I check whether vendors offer free viewer seats for stakeholders who only need to review timelines, which keeps costs reasonable as project visibility scales across the organization.
How to Choose Gantt Chart Software
It’s easy to get bogged down in long feature lists and complex pricing structures. To help you stay focused as you work through your unique software selection process, here’s a checklist of factors to keep in mind:
| Factor | What to Consider |
|---|---|
| Scalability | Look for software that can grow with your projects. Ensure the tool can handle increased users, tasks, and project complexities effortlessly. |
| Integrations | Check if the software connects with tools your team already uses, like Asana, Slack, or Microsoft Teams, to streamline workflows. |
| Customizability | Your team’s needs are unique. Prioritize software that lets you adapt Gantt charts to specific project workflows or branding. |
| Ease of Use | Avoid steep learning curves. Make sure the software offers an intuitive interface and features like drag-and-drop editing. |
| Budget | Confirm that the software fits your budget, not just for today but long-term, including hidden costs like user licenses or feature add-ons. |
| Security Safeguards | Your data matters. Look for features like encryption, role-based access, and compliance with standards like GDPR or SOC 2. |
| Collaboration Tools | Make sure the software allows for real-time collaboration, such as sharing charts with clients or assigning tasks directly within the software. |
| Mobile Accessibility | Choose software with mobile compatibility so your team can track progress and make updates on-the-go. |
Trends in Gantt Chart Software
In my research, I sourced countless product updates, press releases, and release logs from different Gantt chart software vendors. Here are some of the emerging trends I’m keeping an eye on:
- AI-Driven Scheduling: Tools are now using AI to predict delays and suggest adjustments to timelines. For example, some platforms offer automatic task prioritization based on resource availability and deadlines.
- Dynamic Workflows: Gantt charts are becoming more interactive, allowing teams to connect timelines directly to task boards or Kanban views. This makes it easier to transition between high-level planning and detailed task management.
- Visual Customization: More tools are letting users adjust chart aesthetics like colors, labels, and layouts to better match branding or project requirements. Some vendors even include design templates for specific industries.
- Real-Time Collaboration Insights: New features focus on showing live updates about who’s working on what and tracking team workloads in real time. This helps distributed teams stay in sync without extra meetings.
- Scenario Planning: Vendors are now adding tools for “what-if” scenario testing, so users can model potential risks or changes before committing to a schedule. This is especially helpful for complex, long-term projects.
What is Gantt Chart Software?
Gantt chart software is a tool that lets you map out projects on a timeline so you can see how each task fits together. Project managers, team leads, and professionals in fields like construction, marketing, software development, and event planning use it to spot deadlines, assign tasks, and track how things are moving.
If you’ve got a complex project with lots of moving parts, Gantt chart software helps you keep everything visible and organized in one spot. It’s especially useful when you’re juggling shifting timelines or coordinating across different teams, and you can also look for specialized tools for your industry, such as construction Gantt chart software.
Features of Gantt Chart Software
When selecting Gantt chart software, keep an eye out for the following key features:
- Interactive timelines: Lets you drag and drop tasks to adjust schedules quickly, making it easy to adapt to changes in real-time.
- Dependency management: Enables linking tasks to show dependencies, helping teams visualize how delays in one task impact others.
- Milestone tracking: Highlights key project milestones to ensure critical deadlines and goals are visible and met.
- Progress tracking: Updates tasks with completion percentages, giving teams a clear view of project progress at a glance.
- Resource allocation: Lets you assign team members to tasks and track workloads to avoid overbooking or underutilization.
- Baseline comparison: Captures initial plans so teams can compare actual progress against the original timeline.
- Multiple project views: Provides alternative views like Kanban boards or task lists alongside the Gantt chart for diverse planning needs.
- Collaboration tools: Includes features like comments and file sharing directly within tasks to keep communication centralized.
- Export/import options: Lets you save or share Gantt charts as PDFs or Excel files for easy reporting and presentations, as well as import files from other tools such as Microsoft Project (you can also use a Microsoft Project viewer for this).
- Scenario modeling: Lets teams test different scheduling scenarios to see potential impacts before finalizing plans.
Benefits of Gantt Chart Software
Implementing Gantt chart software can provide several benefits for your team and your business. Here are a few you can look forward to:
- Clear project timelines: Helps your team understand deadlines and priorities by visualizing tasks in a simple timeline format.
- Better team coordination: Assigning tasks and tracking progress in one place keeps everyone on the same page and reduces miscommunication.
- Improved resource management: Lets you see workloads across your team and adjust assignments to prevent burnout or underutilization.
- Easier progress tracking: Gives you a clear picture of where your project stands and helps you spot delays early.
- Informed decision-making: Features like scenario modeling let you test changes to timelines or resources before committing to them.
- Increased accountability: Task assignments and status updates make it clear who’s responsible for each piece of the project.
- Enhanced client communication: Exportable charts let you share project plans and updates easily with stakeholders or clients.
Costs & Pricing for Gantt Chart Software
Selecting project management software with Gantt charts requires an understanding of the various pricing models and plans available. Costs vary based on features, team size, add-ons, and more. The table below summarizes common plans, their average prices, and typical features included in Gantt chart software solutions:
| Plan Type | Average Price | Common Features |
|---|---|---|
| Free Plan | $0 | Basic Gantt chart creation, limited projects, limited user seats, and no advanced reporting or integrations |
| Personal Plan | $5-$25/user/month | Unlimited tasks, color-coded timelines, export options, and simple integrations like Google Calendar |
| Business Plan | $25-$50/user/month | Advanced project tracking, resource management tools, real-time collaboration, and custom reporting |
| Enterprise Plan | $50-$100/user/month | Customizable workflows, dedicated account support, enhanced security features, and advanced analytics |
Gantt Chart Software FAQs
Here are the answers to some commonly asked questions about Gantt chart software.
What should a Gantt chart include?
The best Gantt chart software includes the ability to create horizontal bar charts that depict the timeline of a project’s schedule, the overlay of interdependent tasks (i.e. Task B cannot start until Task A is finished), time estimates, progress status, and team assignments. Most modern Gantt chart programs also have task management and collaboration features as well.
What is a Gantt chart used for?
Henry Gantt developed the first Gantt chart as a way to plan production and factory resource loading around the turn of the 19th century. And we still use Gantt charts to this day for resource tracking, deadline plotting, and project communication. A good Gantt chart should visualize the relationship between the work to be done and plotted over a set period of time. It will flag the intended start and due date of tasks and subtasks, dependencies between different pieces of work, and plot who is responsible for each item.
Is there a Gantt chart in Excel?
Not really but you can build your own or snag a Gantt chart template for Microsoft Excel online. I wouldn’t recommend this approach, though, as it is a ton of manual input for very little benefit. If one project element changes, you have to manually change every step afterward or craft a formula to do so for you.
If you are in the Microsoft ecosystem and loving it, check out MS Projects. You’ll get the familiar look and feel of Excel and other Microsoft platforms with a Gantt chart builder, project management tools, and more.
On a Mac? Check out Gantt chart tools designed specifically for macOS—many offer drag-and-drop builders, real-time syncing, and better integration with Mac-native productivity tools.
What is the best free Gantt chart software?
The most common free Gantt chart software is probably Excel or Google Sheets. You’ll find templates for creating Gantt charts in those programs if you do a search online, although the templates might cost a few bucks. It works in a pinch, but it’s not great.
Or, you can try a free tool like ClickUp, which offers 100 Gantt charts for free on their basic level plan. There are many other free and open-source Gantt chart software options available online, including RedBooth, GanttProject, Bitrix24, Agantty, and Instagantt for Asana, as well as free versions of paid tools such as Wrike, Paymo, and others.
How can Gantt charts support resource management?
Gantt charts support resource management by visually aligning tasks with assigned resources, ensuring efficient allocation and avoiding overallocation. They provide clarity on resource availability, timelines, and dependencies, helping teams manage workloads effectively. Additionally, real-time updates in Gantt charts enable teams to make proactive adjustments to resources as project needs evolve.
What are the benefits of multiple view options in Gantt chart software?
Multiple view options in Gantt chart software allow users to switch between perspectives like timelines, calendars, or task lists, catering to different team needs and preferences. This flexibility enhances collaboration by providing tailored insights for stakeholders, project managers, and team members. It also improves productivity by simplifying complex data and ensuring everyone stays aligned with project goals.
What’s Next?
If you're in the process of researching Gantt chart software, connect with a SoftwareSelect advisor for free recommendations.
You fill out a form and have a quick chat where they get into the specifics of your needs. Then you'll get a shortlist of software to review. They'll even support you through the entire buying process, including price negotiations.