Free Gantt Chart Template For Excel and Google Sheets

A Gantt chart template is a pre-built framework that displays project tasks as horizontal bars across a timeline, making it easy to track schedules, dependencies, and progress without building a chart from scratch.
I've been using this exact format for 10+ years managing projects across fintech, consumer goods, and digital agencies. It's the first thing I set up at the start of any new project — and I'm sharing it here as a free Excel Gantt chart template and Google Sheets version you can download and use today.
It includes everything needed to run a real project:
It suits most project types — construction, marketing campaigns, software sprints, event planning, and product launches.
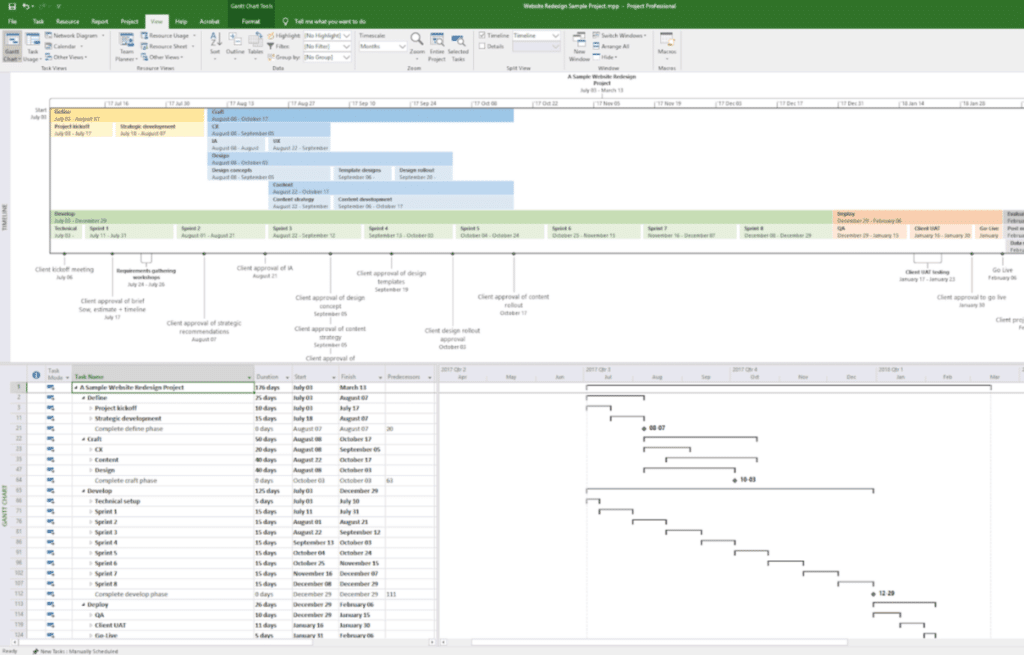
However, I recommend using Gantt chart software for super complex projects. This software can provide more functionality, integrations, and is easier to handle if you are running a large-scale project with many team members and stakeholders.
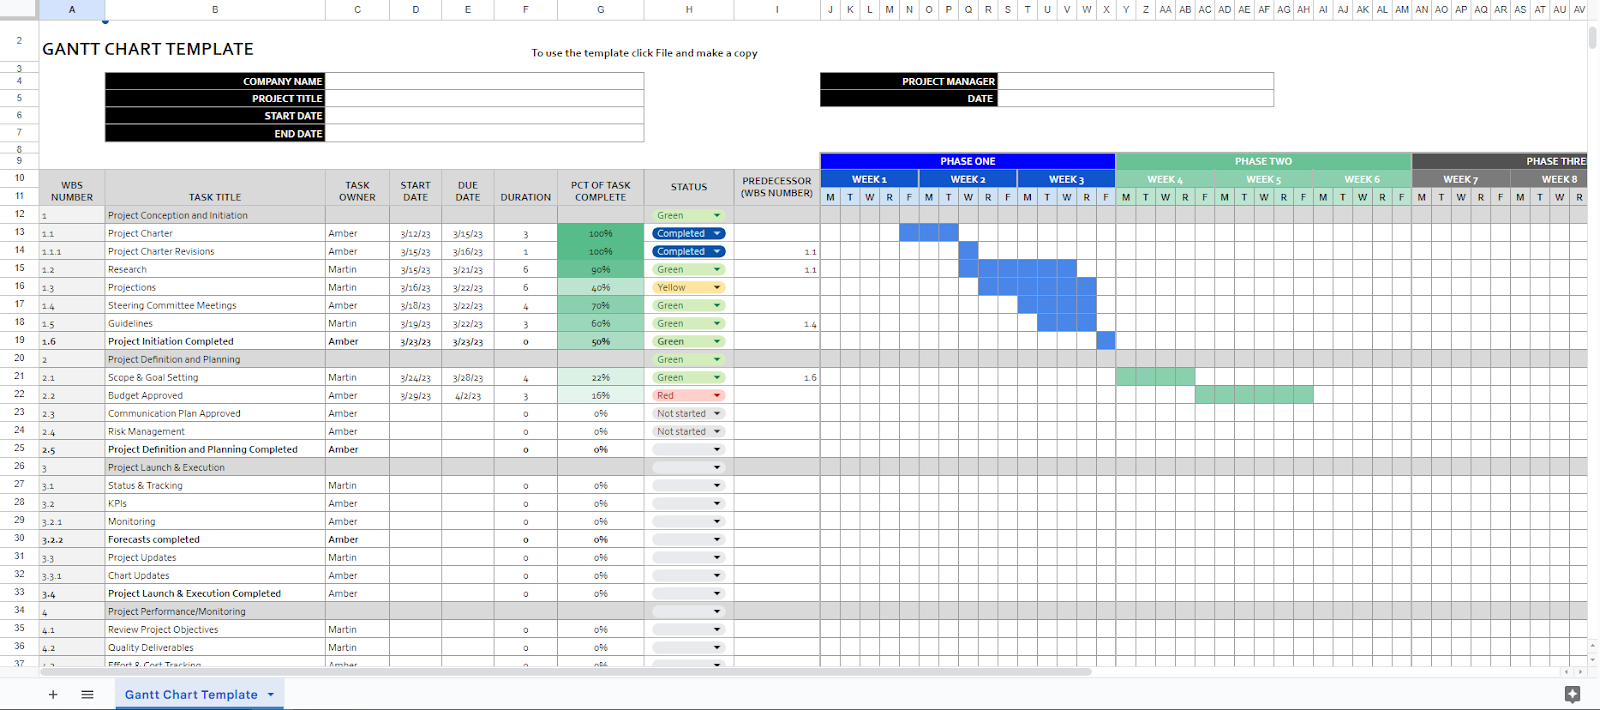
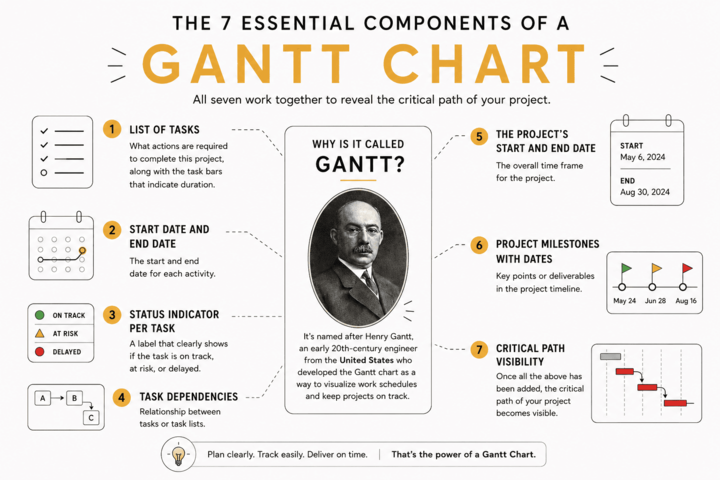
7 Elements I Included In The Template
The Gantt chart template consists of seven components that every Gantt chart should include:
- List of tasks
- Start and end date for each activity
- Status indicators (on track / at risk / delayed)
- Task dependencies
- Project's start and end date
- Project's milestones
- Critical path visibility
Other Gantt Chart Templates
If you're looking for Gantt charts for specific projects, you can find those through the DPM Membership. There are Gantt chart/timeline templates on offer for website redesign projects and landing page projects, as well as templates that work with more agile delivery styles.
You can also find more templates for other project management processes in the project management templates roundup.
How to Use The Template in Google Sheets
- Make a copy of the template document, so you can edit it (see the instructions at the top of the template)
- Change the file name to your project name and delete line 1
- Add the following details: company name, project title, project's start and end date, your name under ‘project manager’, and today’s date under ‘date’
- Enter all your project tasks and deliverables into the project schedule along the vertical axis in column B, and add more lines via drag and drop if needed
- Enter the task owner's name for each task in column C
- Add the start date and end date for each activity: The task duration gets calculated automatically
- Update the percentage of completion for each task in column G
- Based on the percentage of completion, select an appropriate color-coded status indicator from the dropdown menu for each task
- Add project milestones and enter dates and the owner accordingly—I recommend bolding these entries (see template)
- Predecessor task dependencies: For tasks that relate to each other, add the work breakdown structure (WBS) number in column I
- Update the visualization of the tasks: Update the names of the project phases, add calendar weeks, and take into consideration the tasks that need to be completed before another one can begin—this will essentially highlight the critical path of your project
How To Use The Template In Excel
- Download the Excel Gantt chart template
- Open the worksheet in Excel
- Then follow the instructions above starting from point 2.
Read more about how to create a Gantt chart here, and get detailed instructions on Gantt charts in Excel here.
7 Example Use Cases for the Gantt Chart Template
Gantt charts have helped to accomplish some of the world's greatest achievements, from building the Hoover Dam to laying down America's interstate network.
To give you some inspiration when it comes to putting the Gantt chart template to best use, think about the following possible Gantt chart use cases for your organization:
- Project management for various applications in projects of all sizes, including:
- Construction projects
- Event planning
- Software development
- Website creation
- Human resource management, including staff management activities such as:
- Onboarding
- Offboarding of employees
- Payroll management
- Training schedules
- Creating a business plan
- Visualizing your sales process and different funnel stages
- Executing marketing campaigns
- Product management activities from planning a product roadmap to launch to ongoing optimization
- Social media content creation and publication scheduling

How To Create a Gantt Chart Video Tutorial
Ready to build one from scratch instead? Our step-by-step guide on how to create a Gantt chart walks you through the full process — from defining project scope to mapping dependencies and identifying your critical path.
FAQs
Does Excel have a built-in Gantt chart template?
Excel doesn’t include a native Gantt chart feature. That said, you can build one using a stacked bar chart with conditional formatting, or simply download a pre-built template that works in Excel immediately.
What's the difference between a Gantt chart and a Gantt chart template?
A Gantt chart is built for one specific project. A template is a reusable framework you copy and adapt for any project — same structure, no setup time.
What should a Gantt chart include?
Task list, start and end dates, task owners, status indicators, milestones, and dependency tracking. Once all six are in place, the critical path becomes visible automatically.
How do I make a Gantt chart in Google Sheets?
Copy the free template above, rename it to your project, and fill in tasks, dates, and owners. Duration calculates automatically.
When should I use software instead of a template?
If you have 50+ tasks, multiple teams editing simultaneously, or dependencies that need to reschedule automatically when dates change, dedicated software is the better choice. For most projects, however, a template is enough.
Can I use a Gantt chart for agile projects?
Yes — for sprint planning, release scheduling, and roadmap visualization. For day-to-day agile task management, pair it with a kanban board.
What's Next?
Want to connect with other digital project managers to share resources and best practices? Join our membership community and get access to 100+ templates, samples, and examples and connect with 100s of other digital project managers in Slack.

