Not too long ago, I witnessed a dramatic change in the way a team was approaching a project. They had spent over a year trying to figure out how to accomplish their goal, but faced with challenges and changing requirements, they never seemed to progress beyond the initial execution stages. 

The project manager was in a bind. His team was upset, burnt out, and disengaged. The process was a mess and communication was haphazard. He knew he needed to get everyone on the same page, but he didn't know how.

He tried organizing meetings, but that only made things worse. People would show up late, unprepared and angry. He tried sending out emails with updates, but that only generated more confusion.

Finally, he had an idea. He gathered everyone together and explained the situation. Then he pulled up a blank workflow diagram on the projector and started asking the team for their input on how each project task should flow through the team—how could they get to done?

People were skeptical at first, but as they saw how clear life could be with a workflow diagram, they engaged and built a process that was simple, practical, and sustainable. 

In the world of project management, there are a million and one things to keep track of. Schedules, budgets, resources—it can be difficult to keep everything straight. One way to make your job a little bit easier is to create workflow diagrams.

Workflow diagrams show the flow of tasks from beginning to end, and can help you identify potential bottlenecks in your process. In this blog post, we'll discuss how to create and use workflow diagrams in project management to demystify the process and help others understand what happens next as you move towards your goals. 

Let’s dive in! 

What Is A Workflow Diagram?

A workflow diagram is a graphical representation of the steps that are necessary to complete a project. This diagram can help you to identify and track the progress of each step or task in the project as it progresses towards desired outcomes.

Workflow diagrams are also often known as process diagrams or workflow charts. In most cases, these terms are interchangeable in conversations with project team members and stakeholders.  

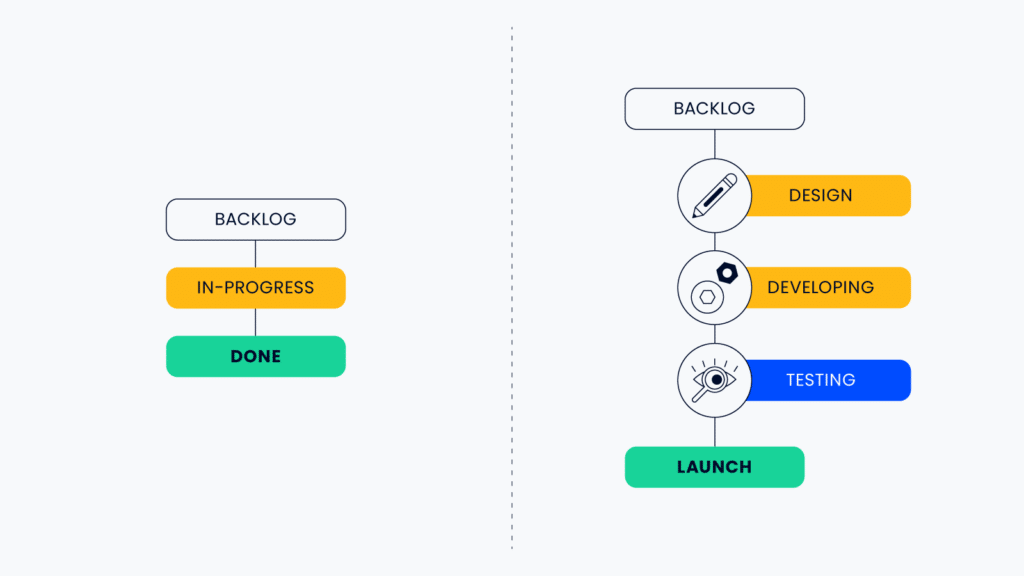
Workflow diagrams are often visualized in the format of a flowchart, either showing the process steps each work item will go through to be considered done (think Backlog, In-Progress, Done), OR the workflow diagram might describe the process at a more macro-level, showing the stages of the process of task completion or project completion overall (think flowchart).

graphic comparing a simple workflow with three steps to a longer one with 5 steps
Use flowcharts and workflow diagrams to map out your processes.

Read more about workflows here.

What Are Workflow Diagrams Used For?

Workflow diagrams are used to illustrate the sequence of steps that are necessary to complete a project. They show the flow of a process and include the steps involved in a process, as well as the different people or different departments who are responsible for each step. 

You might already be familiar with business process mapping or process flow diagrams—that’s great! Process flow diagrams are used to illustrate the sequence of steps that are necessary to complete a process, and similarly, workflow diagrams in project management illustrate the steps, stages or activities required to move a project forward. 

Workflow diagrams can be used in a variety of different ways, from mapping out a process for a new employee to understanding how a process could be improved. 

In my work at Smarsh, I have found workflow diagrams to be especially useful when collaborating with a team to re-tool a process or scale operations. Last summer, the People Services team was charged with scaling onboarding because we were hiring more people, faster than ever!

Using a workflow diagram, the onboarding process was overhauled and highly automated because we were able to identify steps that were the same for each new employee and that required no unique intervention to complete. Workflow diagrams in action!

Workflow diagrams can be used in process improvement initiatives as a tool to help identify opportunities for positive change. For example, a workflow diagram may show that a process is taking too long, that there is too much waste, or that the process is not being completed correctly. By identifying these problems, the diagram can help to identify ways to optimize the process.

Workflow diagrams can also be used to train employees. Workflow diagrams can show new employees the steps in a process and how they should be performed. They can also help to identify areas where employees need more training.

The benefits of using a workflow diagram in project management include:

  1. A workflow diagram can help you visualize the path toward DONE for each task in a project and minimize bottlenecks and inefficiencies
  2. A workflow diagram can help you identify and fix potential problems early on, especially when things get stuck
  3. A workload diagram can help you track the progress of your project, especially between larger milestones
  4. A workflow diagram can help you efficiently assign tasks to team members, especially in moments where resources are constrained or one team is waiting on another to complete their portion of a task

Sign up for our emails and be the first to see helpful how-tos, insider tips and tricks, and a collection of templates and tools.

  • Hidden
  • By submitting this form you agree to receive regular emails filled with tips, expert insights, and more to build my PM practice. For further details, review our Privacy Policy.
  • This field is for validation purposes and should be left unchanged.

Types of Workflow Diagrams

There are several different types of workflow diagrams. The most common type of workflow diagram that you are likely to experience as a project manager is the workflow or process flowchart.

A flowchart diagram shows the steps in a process and the order in which they should be performed. Arrows indicate the direction that the process flows. Other types of workflow diagrams include the data flow diagram and the process map.

A data flow diagram shows how data flows through a system. It includes the different steps in the process and the type of data that is being processed at each step. The process map shows the physical layout of a process. It includes the different machines or departments that are involved in the process, as well as the flow of materials and products.

How To Create A Workflow Diagram

When creating a workflow diagram for your project, it's important to remember that the goal is not to prescribe a rigid set of steps that everyone must follow, but rather to provide a high-level overview of the tasks and steps involved in completing the project. As such, be sure to allow for some flexibility in the diagram as new tasks or steps may be added or old ones removed as the project progresses.

When creating a workflow diagram, you'll want to answer the following questions (over and over again, repeatedly, until you know the full picture and can document it thoroughly):

  1. What are the stages of the project?
  2. What are the individual tasks within each stage?
  3. Within each task, what inputs need to be transformed? What are the outputs?
  4. Who is responsible for completing each task; do you need swimlanes?
  5. What are the dependencies between tasks?
  6. How long should each task take?
  7. What are the potential roadblocks or bottlenecks in this process?
  8. What are the final outcomes of this process?

A workflow diagram can be a very helpful tool in project management, especially when it comes to tracking the progress of a project and identifying potential problems. When creating your diagram, be sure to keep in mind the flexibility required for project success. 

As you run the project, be sure to update the workflow diagram if you learn new information about the project, process, or best-case scenario, you’re able to automate out a portion of the process! 

When I look at projects, process, and workflow diagrams, I am always looking for opportunities to streamline processes. In most cases, this means seeking ways to eliminate tasks or processes that don’t add value, automate any task or process that is repetitive, and educate contributors on how to execute all remaining tasks with accuracy and efficiency. Eliminate, automate, educate. 

Learn more about workflow design and creation here.

Visualizing the Workflow Diagram

Visual representation of the workflow is key to socializing the workflow with others and having people of various learning types connect with the content. 

When considering the workflow diagram, think about 3 components: the inputs, the transformation of those inputs, and the output. If you get this right, outputs become outcomes and your project is considered successful. 

A well-constructed workflow diagram can help you avoid potential project bottlenecks.

  1. Having a clear and concise workflow diagram can save time and headaches down the road—build the diagram with the team early, and update as new info is learned!
  2. Workflow diagrams should be tailored to the specific project at hand and reflect the actual process of accomplishing work on that project.
  3. It's important to take into account the different roles and responsibilities of everyone involved in a project when creating a workflow diagram.
  4. Poor communication can often lead to problems down the line, so it's crucial to get everyone on board with the new process once it's been established.

Is There A “Right” Way To Create Workflow Diagrams? 

The answer to this question depends on the context, use case, industry, and complexity of the workflow diagram. In some cases, there will be a very specific format to follow to align with standards and existing documents. 

Consistent formatting and visualization, when used correctly can help connect business and technical users more closely; with consistent language, visualization, and formatting, business and technical users can start to communicate and collaborate more productively than before while minimizing assumptions and maximizing transparency across processes.

That said, in other cases and often in informal projects, it might be a win just to get a process documented and diagrammed visually at all. Mileage will vary. 

Here are a few of the types of standardized workflow diagrams you might run across: 

  • American National Standards Institute (ANSI): The ANSI style was first on the scene for standards in workflow diagrams and is a commonly used language for process and workflow diagrams. Learn more about ANSI
  • Unified Modeling Language (UML): UML Activity Diagrams are used to show the order of steps in a process and the flow of control. UML is often used in software engineering and systems design. Learn more about UML
  • Business Process Modeling Notation (BPMN): BPMN is similar to UML and uses a flowchart to visualize the process or project at hand. BPMN is not specific to software engineering and instead focuses more on the business processes rather than software or technology systems. Learn more about BPMN

These standards have a lot of commonalities, but they differ in how different items are represented visually in a workflow with standardized symbols. For example, in BPMN, the start of a workflow diagram is indicated with a gray circle and the word start, whereas in UML Activity, the start of a flow is indicated by a black circle, and in ANSI, the start is an oval.

The same goes for endpoints across the different standards. Does this all really matter? Maybe. The importance of using these standards depends on the industry, organization, and context of your workflow diagram (more on this below).

table showing common workflow symbols and their meanings
Common workflow symbols and their meanings. (Source)

In addition to these three types of diagramming standards, your organization might have a home-grown or org-wide standard. Whenever you are starting a workflow diagramming initiative, be sure to check with other employees or leaders at the organization to determine if there are any pre-existing standards that you're expected to follow. Always best to ask upfront! 

Expert Tip: In reality, I’ve found the best format is the one that the team and stakeholders can understand. You don’t need to be an expert in ANSI, UML, or BPMN to create a workflow diagram! Getting started on paper or a whiteboard is always a great option.

If you can sketch it out with key contributors, don’t obsess over the format on the first pass. Just get it on paper or digital space, save it (take a pic if in physical space) and come back to it later to pretty it up as you add it to your project documentation repository. Progress over perfection! 

Common Workflow Diagram Symbols & Shapes

There are a few common workflow diagram shapes and symbols that you’ll see show up across the various types. Remember, it doesn’t have to be perfect to be useful, so just get started! 

Often you will find the following diagram symbols: 

  • Terminator: the beginning or end of your workflow, often shown with an oval or circle
  • Flowline: this is the connector that moves between the steps, actions, processes, decisions, or start/endpoints. Take note of which direction the flow lines point with arrows! 
  • Step, Action, or Process: each item, step, action, or process in your workflow might show up as a square or rectangle. 
  • Decisions: decisions are commonly noted as a diamond. You might also see arrows coming out of a decision point with yes/no approved/denied, etc. to show what the outcome of the decision is and what happens next, according to the diagram. 

The symbols in the workflow diagram should be used consistently or aligned to the standard required by the organization or team. As you explain the workflow diagram with stakeholders and team members, adapt, clarify, or adjust anything that needs clarity as you go!

The creation of a workflow diagram is iterative and will adjust along the way as the team learns more about the process, project, or how to operate more effectively. The key to having a useful workflow diagram is to be sure to keep it up to date! 

Workflow Diagram Template Options

Workflow diagrams vary wildly depending on the use case, context, and intent of the diagram. To get started, consider how you will store and share your workflow diagram with stakeholders. Do they use PowerPoint mostly for presentations? That can be a good place to start. 

Does your team use LucidChart, Miro, SmartDraw, or another digital whiteboard tool? That can also be a great place to build workflow diagrams. In fact, taking a tool out for a spin might be a good way to get started as most tools include templates that are a great starting point and can be customized as you go.

As you look for templates, you might find them labeled as flowchart or flow chart diagram templates—that’s OK! 

Workflow Diagram Example

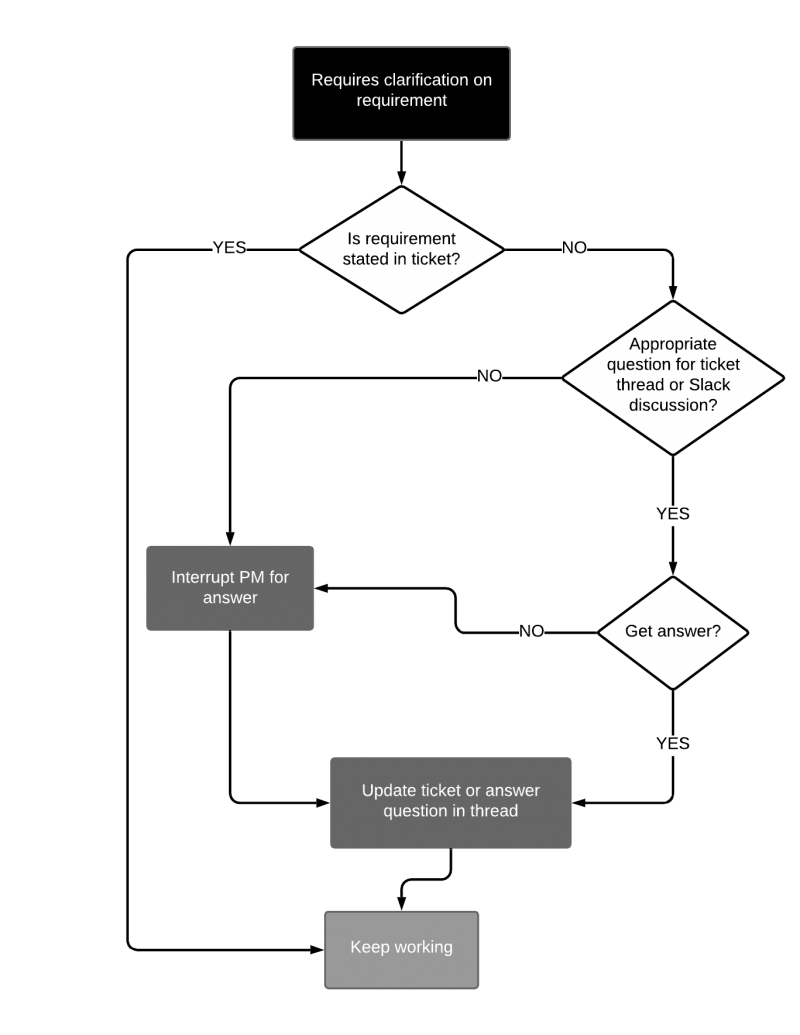
Examples are a great way to get acquainted with how a workflow diagram works as you plan to create your own. Here, let’s look at a great example from Digital Project Manager, Wes Knight. 

an example workflow diagram showing what to do if a requirement needs clarification
An example workflow diagram showing what team members should do if a requirement needs clarification.

In this example, the creator is documenting the process to get clarification on project requirements with a goal to increase the reliance on the project board, and chat tools for listing project requirements and maintaining a record of discussion (documentation, YAY!). Decisions are noted in diamonds and tasks, outcomes or actions are noted in rectangles. This diagram is simple and easy to understand—awesome! 

Workflow Diagram Software

The market for diagram tools has been growing steadily for decades, and now, with online collaboration being the norm, the need for good tooling has never been greater. 

Beyond diagramming, most project management tools include workflows which can be built into a project process. For a list tools that include workflows, check out these resources:

Next Steps!

Workflow diagrams are a great way to document, visualize and communicate the process of how work is done in your organization. By using common symbols and shapes, you can create a diagram that is clear and easy to understand for all stakeholders.

As you create your own workflow diagram, be sure to keep it up-to-date by adjusting as needed based on team feedback. And be sure to check out the wealth of templates and examples available online!

Getting started is the hardest part. Try this: on a piece of paper, draw an oval at the top of the paper to represent the start of your process, for example, getting out of bed in the morning. What does the rest of your routine look like? Add each task you do after getting out of bed in the morning down the page.

Draw a rectangle around each written step in the process of you getting ready for the day. Next, connect the rectangles with lines and arrows pointing to what you do next. How does it all end?

For me, it ends with me sitting down at the computer, coffee cup in hand, ready to join my first meeting of the day. If you’ve followed these instructions, voila! You’ve created your first workflow diagram! Here’s a sample of what it might look like: 

daily workflow routine infographic
A workflow diagram to start your morning.

Have you used workflow diagrams in your work? If so, I’d love to hear about it! Connect with us in the comments below or give us a shout on social media! 

Did you find this helpful or informative? Follow the workflow diagram below and be sure to subscribe to the Digital Project Manager for more news, information, and tips to make your work more effective and efficient. 

illustration of a workflow diagram showing how to subscribe to our newsletter
A workflow diagram showing how to get the most from The Digital Project Manager.

Related Lists of Tools:

By Liz Lockhart Lance

Liz is an agilist and digital project manager with a passion for people, process, and technology. In her day-to-day, Liz works as the Chief of Staff at Performica, an HR software company revolutionizing how people give and receive feedback at work. Liz also teaches an Operations Leadership course in the MBA program at the University of Portland, and is working towards completing a Doctorate at the University of Southern California in Organizational Change and Leadership. Liz holds numerous project management-related certifications including: PMP, PMI-ACP, CSP-SM, and a SPHR from HRCI to round out the people-focused side of her work. Liz has 15-years of experience leading people and teams across education, consulting, and technology firms.

Leave a Reply

This site uses Akismet to reduce spam. Learn how your comment data is processed.