As a project manager, it can be a complicated balancing act to ensure that your project teams have the right proportions of skills, qualifications, experience, and perhaps trickiest of all, availability. When you’re able to resource your projects with the right staff, you avoid delegating high-end work to inexperienced staff or overburdening your existing crew. But how do you get that right?
This is where the true power of capacity planning reports unfold. As the linchpin to any Business Intelligence(BI) framework, custom reports can usually be generated by a resource management tool and allow you to quantify your project’s billability while also providing accurate effort estimates for the future. As a result, you no longer remain in the dark about the activities occupying your team’s bandwidth and can ensure that your projects have the right knowledge upgrades, experience, and available capacity.
Check out these 5 essential capacity planning reports centering around resource excellence, that’ll help you think about resourcing smarter.
1. Capacity Versus Demand Forecasting Reports
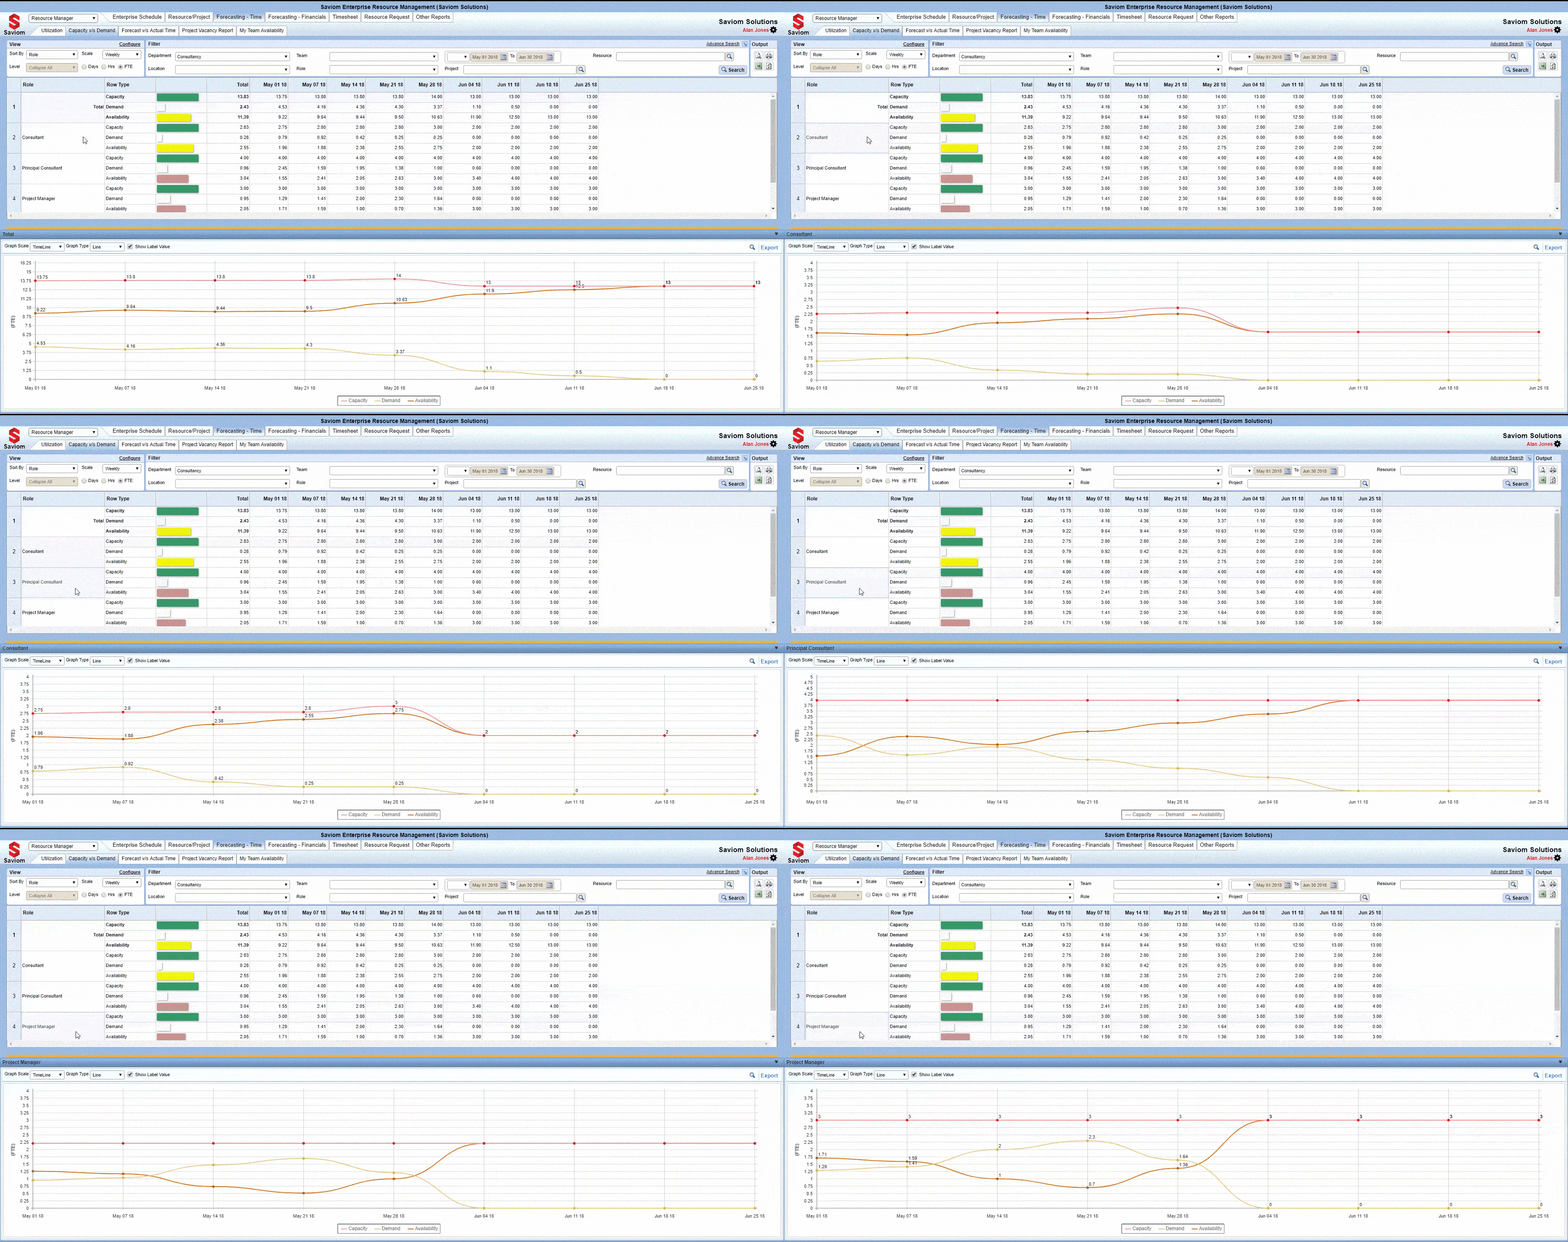
Capacity management analyzes your resource capacity in advance. The capacity planning reports within intuitive resource management solutions like Saviom Software roll out future capacity estimates based on current demand patterns. It ensures optimal performance and right investments in future, with manifold benefits. For one, any deviations from the task objectives affecting your staff can be detected and resolved in the early stages. Besides, your team members can support one another on different bodies of work and keep abreast of upcoming training dates for in-demand skills.

The first step is to have an updated skills inventory and list down the proportion of the most sought-after on-the-job knowledge and skills you need. Next, you can search for the current staff who fit the bill. You can accordingly reshape your enterprise and remove surpluses of outdated skills in order to optimize your resource allocation.
Demand forecasting in project management lets you collate feasible projects in the pipeline that later become actual work. Your resources can then be notified of these future commitments within a reasonable time frame and can smartly upskill as actual deployments draw nearer.
Capacity versus intuitive demand forecasting reports also oversee all-rounded availability during peak and off-season times in a financial year, such that your enterprise is unaffected by fluctuations in people’s movement and preventing bottlenecks.
2. Booked Versus Actuals Reporting Function
If you’re seeking to level resource efforts and their hours in one place, then you’re in luck! The Forecast Versus Actual time report, better known as the Booked Versus Actuals, consolidate all time-sensitive bookings such that you’ll accurately estimate your resource planning on future projects.
The ‘Booked’ hours refer to your project booking estimates while the ‘Actual’ hours are pulled from your staff’s timesheets. For instance, you can retrieve a summary of your project bookings from Saviom’s Enterprise Schedule dashboard.
What’s more, you can directly pull timesheeting information from external schedules such that existing data can be compared against future estimates in real-time. Minimizing the gap between your booked and actual efforts informs you of how different core tasks are distributed while factoring out non-BAU work. Plus, any disparities in hours, be it an increase or decrease, is highlighted to alert you of values that are over or underestimated.
3. Utilization Percentage Rate Reports
Resource utilization rates measure your staff’s long-term productivity and let you allocate optimally balanced workloads. Over-utilizing your existing staff not only induces stress but also creates a schedule where tasks spill over with no accountability whatsoever. In Tower Watson’s survey, 57% of the respondents cited overwork as the reason behind their disengagement at the office.
On the other hand, underutilizing resource potential causes you to overlook secondary skills and team capacity your current resources possess, which could easily have improved the pace at which the project runs. You end up offloading your project to external agencies, even as your bench-time increases with idling resources on it. As a result, there’s an imbalance between your payroll costs and assessable returns against it.

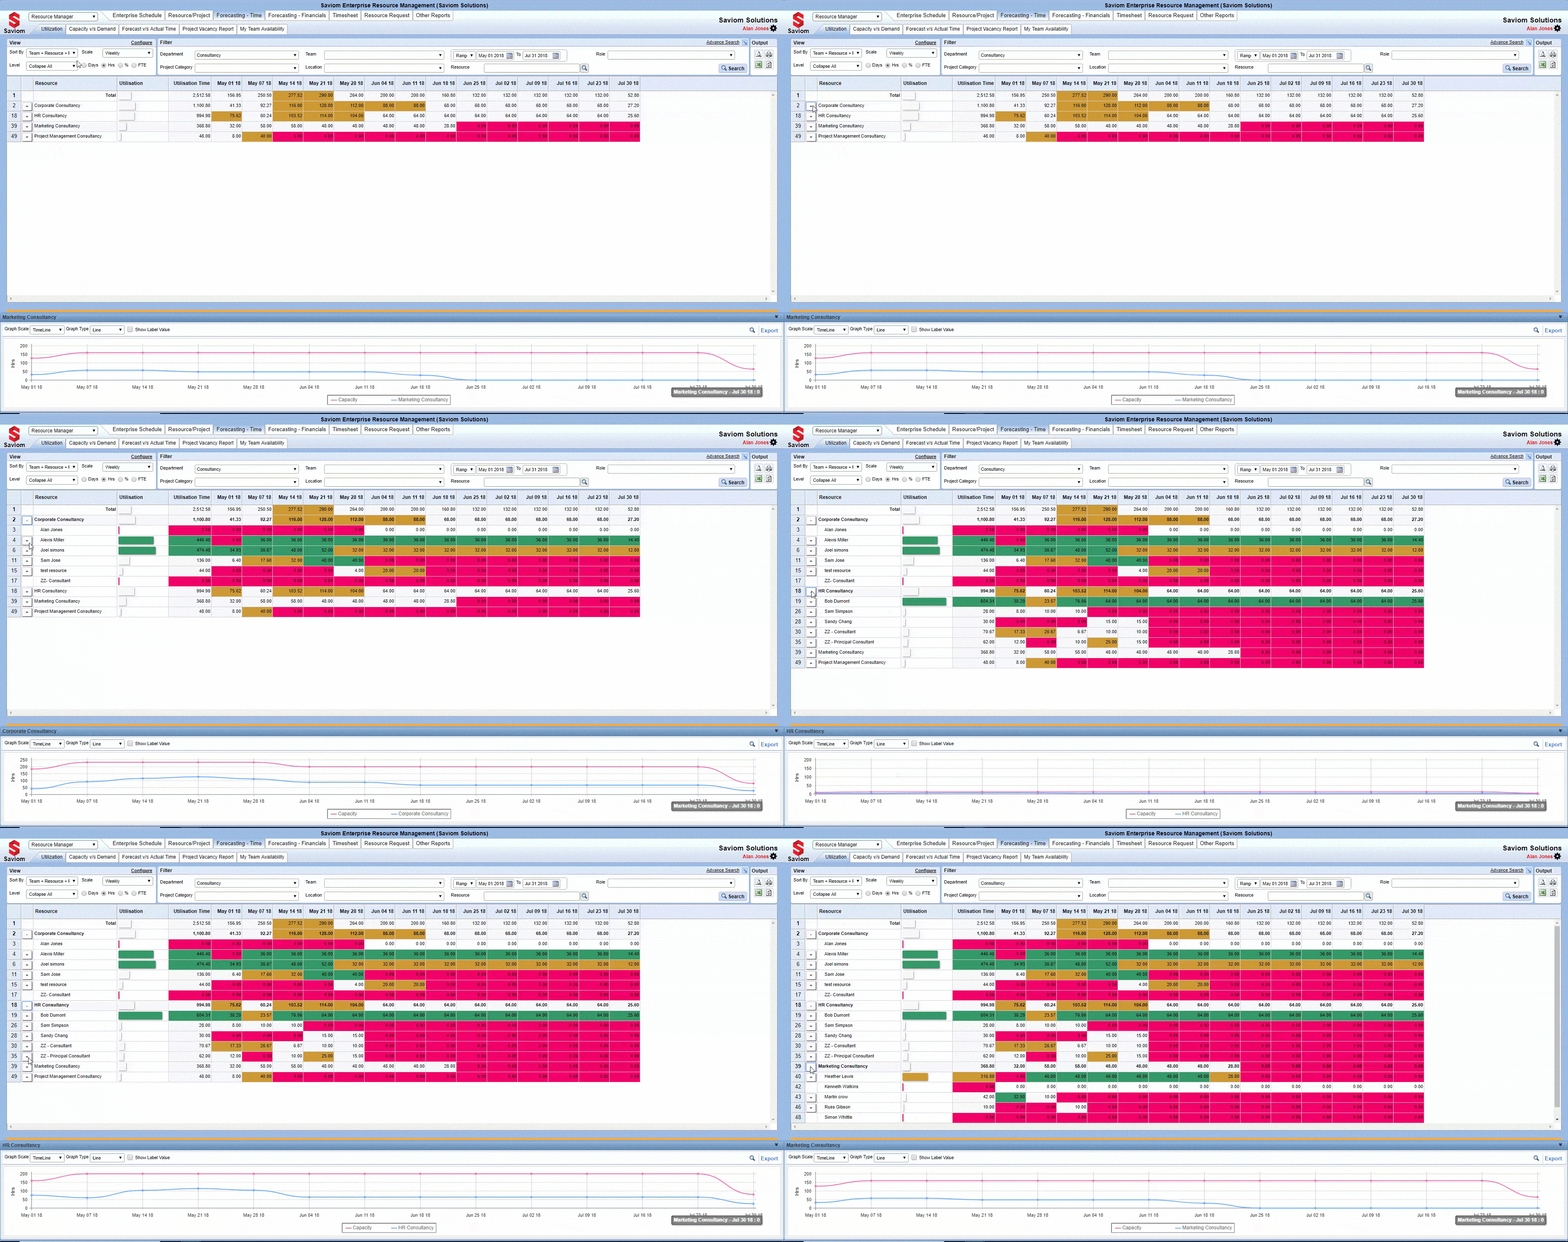
The utilization report uniformly measures everyone’s efforts across the standard work hours by assigning days, hours or percentage levels. It rectifies double bookings and imbalances between actual and projected clocked efforts. For example, if a particular resource is allotted several projects due on a single day, it would obviously overrun the standard working hours. With Saviom, this discrepancy would starkly contrast with the overall resource booking overview, letting you space out the workload over several days or weeks, as the case may be.
Utilization rate reports generate a resourcing heat map that informs you of the different activities your resourcing contracts are spread out on, such that a fair distribution of labor and logical task prioritization ensues.
4. Forecasting Financial Reports
You can reconcile your budget portfolio by calculating your predicted(forecast) and actual costs. While the former is generated by multiplying prospective hours with your staff’s billing rates, the latter is derived from the actual hours your staff spend for which they price their billing rates. A variance occurs from the difference arising between your actual and future costs down the line. You can make an informed decision on resource allocation based on the forecast versus actual costs report analytics.
Not only does the forecast versus actual costs report bring out your projects’ true billing worth but also points you to the most cost-efficient hourly rates. You can even determine the reason for any roadblocks or a slowdown that could cause the project’s duration to lengthen beyond the original prediction. For example, if the cost to execute the actuals exceeded the booked costs, it tells you that your resources spent more time on a particular activity. Conversely, if it’s lesser, you can safely conclude that the work finished ahead of time.
5. Resource Availability Reports
Be it peak or off-peak times, resource availability reports help you take a proactive approach towards optimal work allocations. After all, even with the right number of hands, you can’t assume they’re all readily available and adequately prepared for the next project in the works. For example, if resource A is taking several leaves-of-absence in April, this reduces his/her availability, which implies that your team capacity and project deadlines would have to be adjusted accordingly.

You’d have to find the next set of resources on standby who are not only available to take up the slack but also possess the skills and sufficient orientation around the task to get it going. This move drastically reduces your bench-time and prevents your projects from being derailed by sudden, inexplicable lapses in productivity once they commence.
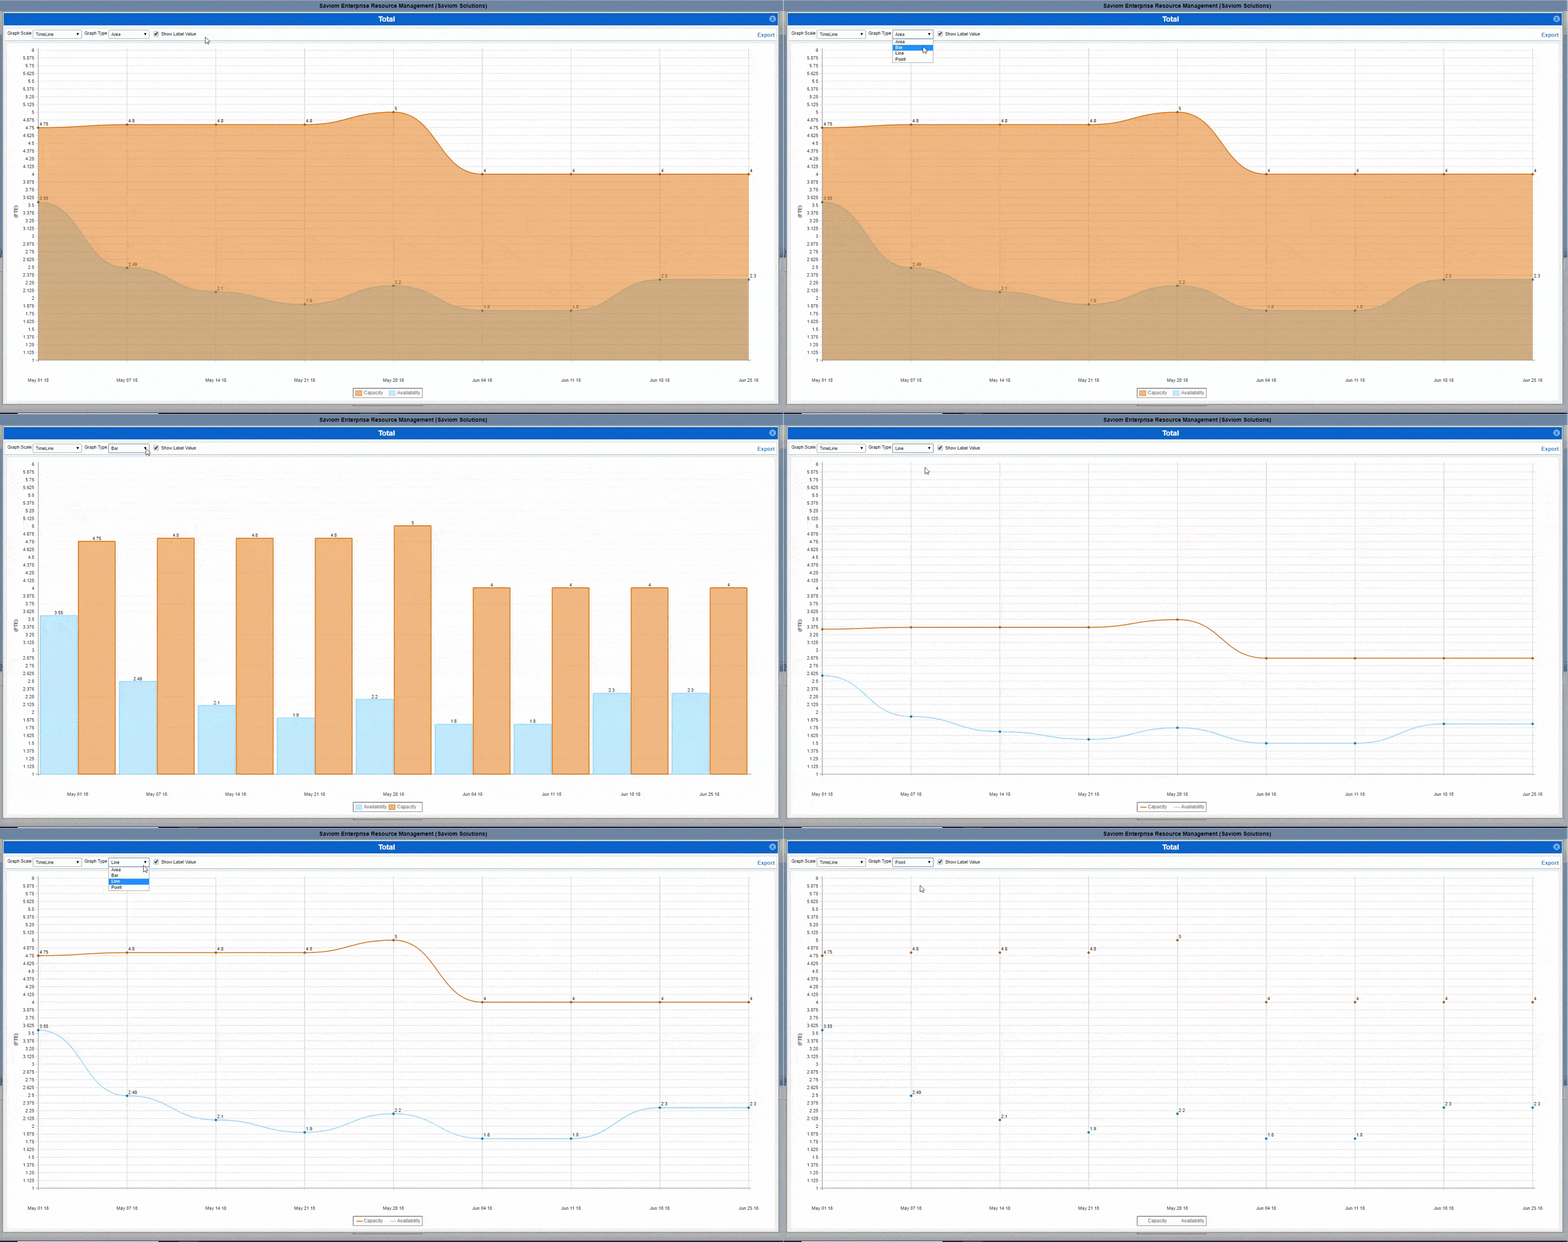
At the end of the day, a capacity report simplifies the art of decision-making by helping you base your figures on raw data science, including clear metrics and graphs. With the right intuition, you no longer will have to guesstimate how many people or which set of skills and experience are needed to drive a project forward or need to troubleshoot why a plan did not work. Thus, you can truly commit to the project windfall you set your sights on and reshape your enterprise around a smartly staffed workforce and a smart plan capacity.
Tell us how these 5 reporting analytics changed your resourcing perspective!
The Digital Project Manager is reader-supported. When you click through links on our site, we may earn a commission. Learn more.
Related Read: 10 Best Capacity Planning Software For Project Managers


