What Is A Gantt Chart? Complete Guide For PMs

Let me just come right out and say it. I love me a good Gantt chart. Is that nerdy? If it is, then you’ll be a big huge nerd by the time you finish reading this article, too.
But let me be clear: I said “a good Gantt chart”.
A good Gantt chart tells a visual story about the relationships between the work to be done plotted over a period of time.
- It shows what has to happen in order for something else to start, or what has to finish for something else to finish.
- It shows what work will be happening concurrently in a silo and what work will require collaboration.
- It articulates phases and gives logic to key dates.
- It takes the complexity of the project and distills it into simplicity.
- And it shows a viable path to success.
Contrast that against what I consider to be a bad Gantt chart. A bad Gantt chart is the one that only a project manager wants to look at. It regurgitates the complexity of the project onto a page and is about as visually interesting as mold growing on a piece of bread.
It’s the story that no one wants to hear because it’s jargony and dull. And because of that, the only inputs to it throughout a project come from the project manager and the project manager alone.
What A Gantt Chart Looks Like
Designed in the late nineteenth century by mechanical engineer Henry Gantt, the Gantt chart is a project management tool that allows the user to visualize project data quickly. Most prominent of this project data is task dependencies as well as current project progress.
All of this is shown in relation to the established project timeline. Much like an itinerary for a long trip shows what happens when, and what is next, a Gantt chart offers a bird’s eye view of a project’s steps, what happens next, and when it should all be done (which of course is an estimate, things can still change)!
As much as I LOVE starting my project scheduling on paper (I hold a firm belief that if you can’t map it out on paper, you aren’t ready to use the computer to map it out).
These days, Gantt charts are created in software, largely automatically. Learn more about Gantt chart software here.
Gantt Chart Setup
Any Gantt chart software will create a horizontal bar chart (which is what people think a Gantt chart is, in a nutshell).
The vertical axis on the left is composed of the task list that will be completed throughout the course of the project, potentially at a couple different levels if the project is complex.
The tasks are typically arranged from top to bottom in the order that they need to be completed for the project, or in a more complex project, tasks may be arranged by context, phase, team, or area.
The horizontal axis is a project timeline. The horizontal bars that are created for each project task are proportional to the amount of time needed for each task. If the entire project takes four weeks and the first task is expected to take a week, the bar chart for that task would fill a quarter of the timeline.
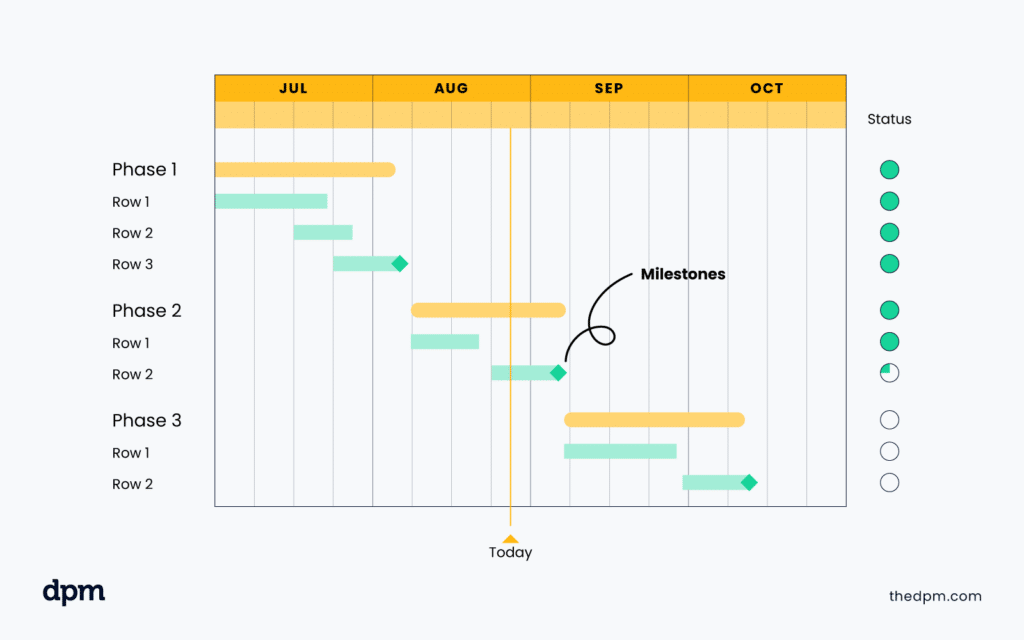
Most online Gantt chart software can also display which member of the project team has been assigned to each task. The amount of the bar that is filled informs the project manager, team, and stakeholders how much progress has been made on each task.
The Gantt chart affords the project manager, team, and stakeholders a consistent view of the project’s critical path and overall project progress.
By having a visual of this critical path, it is easy to see when scheduling adjustments need to be implemented so as to avoid bottlenecks in the project’s progress.
Related Read: 7 Elements To Include In A Gantt Chart + Other Gantt Chart Tips
Why Are Gantt Charts Used?
The Gantt chart identifies tasks that can be completed simultaneously and those that are dependent upon completion of another task. It's a way to visualize your project management and outline the most important aspects of it.
Because the bar chart is plotted against a timeline, a Gantt chart might also reveal where downtime exists in the project, plus the Gantt chart is a great way to identify any major pauses or time considerations (say it with me, PTO, Vacation) that will materially impact the team’s ability to progress forward.
Project managers, teams, and stakeholders can use the Gantt chart to see how they are progressing against the plan and make sure any time considerations are addressed and accounted for ahead of time.
Learn more about what Gantt charts are used for and their specific use cases here.
Pro Tip: A Gantt chart that stays in a tool and doesn’t make it into real conversation isn’t so helpful! If you’re a project manager, team member, or stakeholder of a team using a Gantt chart, make that chart visible as much as possible and use it as a tool to openly talk about how it's going and what is to come.
Benefits Of A Gantt Chart
The Gantt chart is designed to organize essential project tasks and timing data in one place in a visual manner.
Having such crucial information in one chart simplifies communicating the plan (and any updates) and makes it easier to understand the time needed to complete both individual tasks and an entire project.
It is beneficial to use a Gantt chart in project management because it allows you to see at a glance how each task relates to the other tasks, what is due when, and how much time is allotted for each task.
This helps you to stay organized and on track as you work on your project. Additionally, a Gantt chart can help to identify potential risks and problems early on in the project so that they can be addressed before they become too serious.
If updated consistently, even a simple Gantt chart can serve as a critical tool to enable any member of the project team to quickly see the project’s progress and plan over time.
Items To Keep In Mind
In order to create a Gantt chart, you first need a basic project plan including tasks, dates, and dependencies if applicable. Do not try to create a Gantt chart without these elements as inputs.
Even when using project management software to create a Gantt chart, you will first need to have a project plan that lists all (you can get started with some) of the individual tasks required for your endeavor.
It is also necessary to have an estimate of how long each task may take and if certain tasks are dependent on each other. Start and end dates should be established as well. Project milestones can serve as motivation for the project team, or they might be required by your stakeholders (or contract).
Like with any project management software, the user must provide as much input as possible. The project manager must then understand the terminal elements of the entire project and know the project’s work breakdown structure.
No Gantt chart tool will tell you a specific task is missing or who on your team should do what. Remember: A Gantt chart is just a visual representation of a project plan over time. It in itself is not the plan.
Best Uses For Gantt Charts
Project management professionals leverage tools such as Gantt charts because they can be used to visualize all types and sizes of projects for stakeholders.
The Gantt chart itself has been around for decades, and has been critical in visualizing and communicating the project progress for many large initiatives that you benefit from such as transit infrastructure, highway systems, and even The Digital Project Manager’s content creation process!
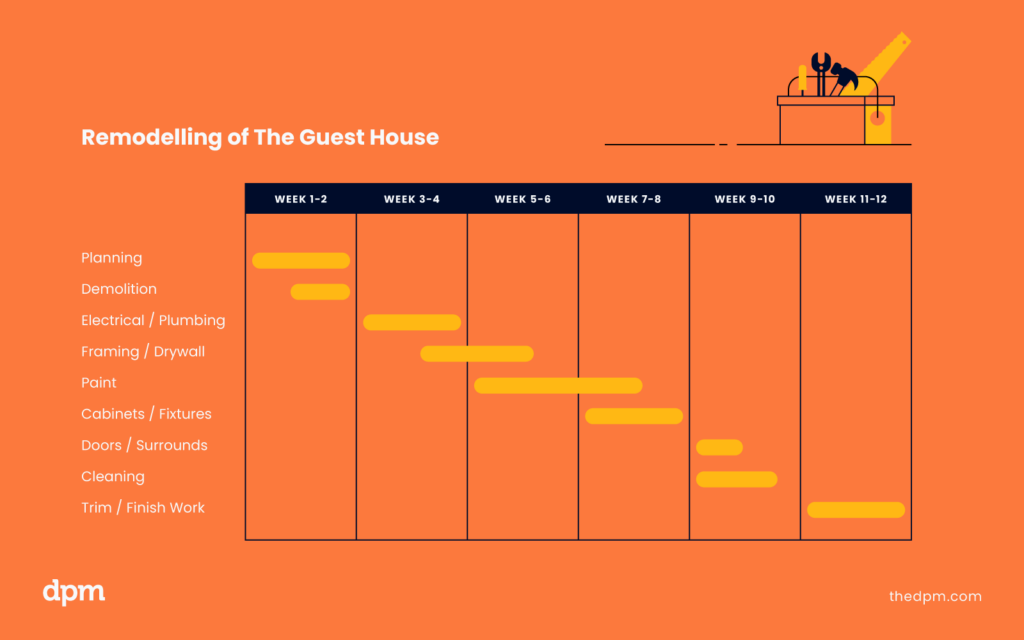
One of my favorite types of projects to visualize with a Gantt chart is construction, because we have all likely driven by a house or building as it is being built over time and we know that you shouldn’t start putting in cabinets until the roof is finished!
Today, Gantt charts are used throughout pretty much every industry and sector, which is evidenced by the myriad Gantt chart software that has been created and templates that have been created for many different contexts or scenarios (PS: Get our Gantt chart template here).
Project managers utilizing the predictive or Waterfall methodology typically leverage Gantt charts to visualize their team’s path to successful completion. In fact, in some ways that’s where Waterfall got its name, from the waterfall of the Gantt chart to the finish line.
Since the Waterfall methodology deals with a project schedule sequentially, with all plans defined at the outset, the Gantt chart is ideal for visually mapping this sequence.
Furthermore, Gantt charts provide project managers and teams with a visual way to divide their project into manageable chunks. This tool also helps them identify milestones within a project’s timeline, which gives them data they can use to provide feedback to an organization’s stakeholders.
Overlooked Uses Of Gantt Charts
Because a Gantt chart maps task dependencies and a project’s critical path, this project management tool can show how changing one individual task can potentially impact the entire project. Successful project management often requires the ability to be agile, so foreseeing how a change now will affect a project’s completion in the future is essential. This type of feedback is one of the underused elements of a Gantt chart.
Pro Tip: While it is true that Gantt charts are often leveraged in predictive, Waterfall-type projects, they can also be used in Agile projects to visualize what’s done and what is known to be done.
The key difference between Predictive/Waterfall and Adaptive/Agile projects is not whether or not we use a Gantt chart, it's all about how we do planning and if we need to know everything about the design and function at the outset (Predictive/Waterfall), or if we can discover, design, and build it along the way (Adaptive/Agile).
Limitations Of Gantt Charts
No project management tool or software is perfect. Neither is the Gantt chart—it can become too complex as the number of dependencies and activities increases.
In other words, an overly stacked bar chart can include so much detail that the overall impression is confusing. A Gantt chart should not be used just for the sake of doing so; it must add value.
If any project management activity, including Gantt chart creation doesn’t add value, don’t do it. As a project manager, focus your time and expertise on value-added activities.
For example, even if you have created a Gantt chart but your team and stakeholders aren’t using it or finding value in it, it is not valuable. Manage your time and energy to produce value, not paperwork.
Now, with that said, here are a few important omissions from Gantt charts.
Task Priorities
Since a traditional Gantt chart typically lists a project’s tasks sequentially, the chart does not accurately portray a task’s priorities. In a traditional Gantt chart, each task appears as important as all the others, which may not be an accurate reflection of the project’s process.
Required Resources
Although it is essentially a bar chart, the size of the bar for each task corresponds to time, not to the resources required to complete the task. Task management may need to see such information because some planning decisions may need to be based on resources more than time.
Project Costs
Another limitation to the Gantt chart is its emphasis on a project’s timeline instead of cost. Project management often requires cost to be a factor in decision-making, and a Gantt chart will not provide any data to help make this type of decision.
Complete Project View
The project management software that creates Gantt charts often breaks the charts into segments. This makes seeing the entire project on a single screen or a single piece of paper difficult, rendering these charts ineffective for sharing with an audience. In short, there can be so much information on a Gantt chart that the entire project is not viewable at one time.
If you face the problem of getting everything into one screen or on one sheet of paper, consider whether you might be able to “roll-up” the tasks to higher-level work streams or milestones to allow everything to fit into one view, even with an adjusted timescale. Try it out!
Other Project Visualization Methods
Successful project management often comes through utilizing multiple tools. Besides a Gantt chart, a PERT (program evaluation review technique) chart can also be useful. A PERT chart, unlike the critical path, focuses more on the dependency between tasks than on a timeline, which makes them useful for managing larger-scale projects.
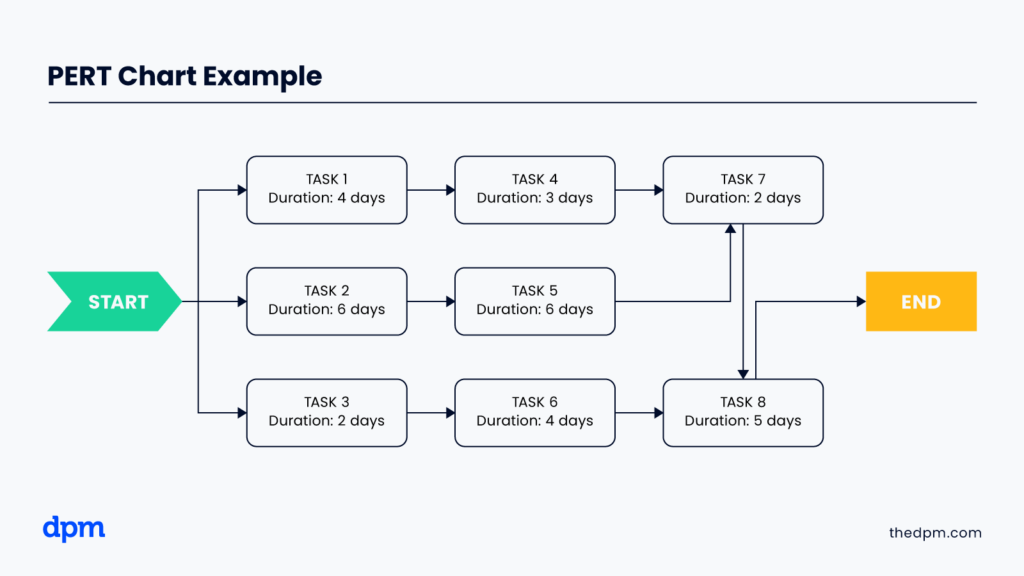
A network diagram is useful for visually representing how the components or tasks of a project interact, which a Gantt chart is not going to display (this is the main difference between Gantt charts and PERT charts).
There are also project management tools like Kanban boards that work by limiting work in progress/assigned to each person or team as opposed to setting timelines.
Final Thoughts
The Gantt chart has enjoyed decades of success as a project management tool because ultimately it is a user-friendly way to visualize the tasks and time needed to complete a project. But remember, the Gantt chart is not the project plan.
When utilized with other project management tools, the Gantt chart can provide a wonderful map for tracking the progress of a project and seeing what’s coming up next for the project team.
If you’re having a hard time visualizing what’s coming up or where your team needs to be in the future, a Gantt chart is a great place to start. In fact, every executive I have ever worked with has been familiar with Gantt charts and in some cases, a Gantt chart has been an indicator of a solid project plan. Give it a try!
Find the right Gantt chart software for your project needs here (after you make a basic plan, don’t skip that step!):
Subscribe to the Digital Project Manager newsletter to stay up to date on Gantt charts and other project management tools.

