What is a Gantt Chart? Free Template & How To Use One

Gantt charts provide a clear, visual way to plan, manage, and track projects from start to finish. Whether you're managing sprints, product launches, or long-term initiatives, Gantt charts make it easier to coordinate teams, spot delays early, and keep stakeholders informed without endless status meetings.
Here’s everything you need to know about what Gantt charts are, how to use them, their biggest benefits, and how to get started with our free template.
What Is A Gantt Chart?
Gantt charts are essentially bar charts, with each project task listed on the vertical axis of the chart. The horizontal axis is the amount of time, usually in days. Each task bar is proportional to how long the task will take, helping map out project phases and support better task management.
Most Gantt charts include these components:
- A list of specific tasks: what actions are required to complete this project?
- Start date and end date for each activity
- Status indicator per task: is it on track, at risk, or delayed?
- Task dependencies: do tasks relate to each other?
- The project's start and end date
- Project milestones with dates
- The critical path of the project, which maps out all tasks
Together, these features help teams stay aligned, manage timelines more effectively, and spot delays before they impact the entire project.
The History of Gantt Charts
Henry Gantt introduced the Gantt chart in the early 1900s to solve a simple problem: managers needed a faster way to track work, manage deadlines, and keep projects moving.
More than a century later, the tool is still everywhere. Gantt charts helped coordinate massive infrastructure projects like the Hoover Dam and the U.S. interstate highway system. Even today, they remain one of the most widely used tools in project management.
The reason is simple: they work!
Gantt Chart Template [Free Download]
The main benefit of Gantt charts is that they provide focused timelines and deadlines; they also offer insights into more complex projects than can ever be gleaned from to-do lists alone. This makes them a must-have resource for all PMs out there. They may not be the flashiest tool in a project manager's arsenal, but they are an absolutely integral piece of any successful project plan.
Gantt chart templates can be a lifesaver, and we've got the perfect one for you! Whether you're an Excel aficionado or partial to Google Sheets, our Gantt chart template is the answer to all your scheduling needs. Just download the template and start inputting your information right away!
I included instructions to make setting it up a breeze. No more spending hours trying to figure out how to create one—your Gantt chart solution is right here!
Read more about creating Gantt charts in Excel here.

Key Features of Gantt Charts
At the heart of every Gantt chart is a simple premise: making project timelines visible and actionable. While the concept is straightforward, the features packed into a well-built Gantt chart make it a powerhouse tool for project managers. Here's what you can expect to find:
1. Task Bars
Each task in your project is visually represented as a horizontal bar. The length of the bar reflects the duration of the task, and its position along the timeline shows when the task starts and ends.
2. Timeline Scale
The chart is aligned with a time scale—days, weeks, or months—depending on the scope of your project. This scale anchors all task bars, making it easy to see progress at a glance.
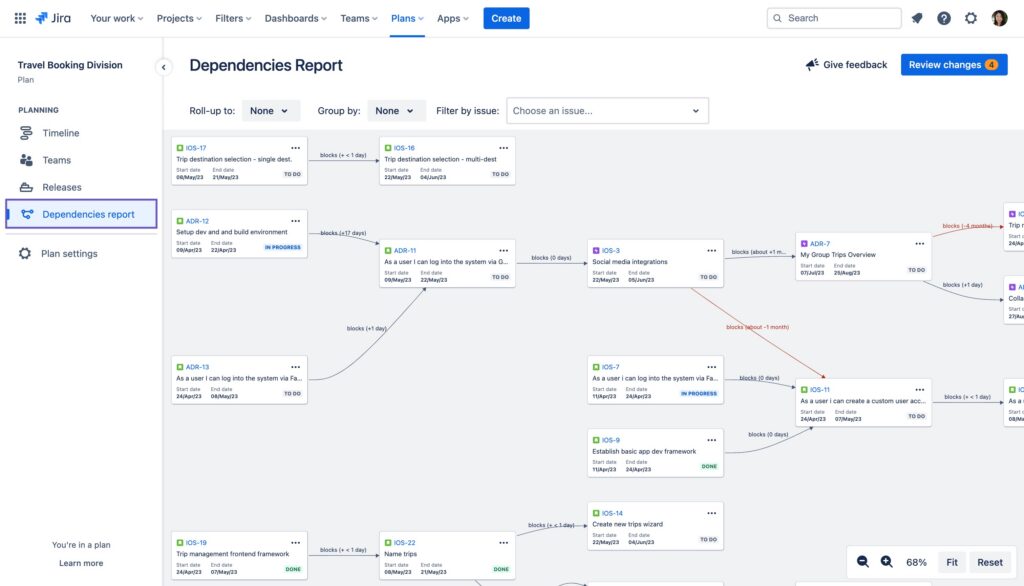
3. Task Dependencies
Tasks don’t exist in isolation. Gantt charts show how tasks relate to each other with arrows or connectors that indicate dependencies (like finish-to-start or start-to-start relationships), helping you identify the project’s critical path.
4. Milestones
Key deadlines or important events are often marked with distinct symbols (such as diamonds). These milestones help keep your team aligned on project goals and significant progress points.
5. Progress Tracking
Some Gantt charts allow you to visualize how much of a task has been completed by shading part of the bar. This real-time progress indicator helps teams stay accountable and pivot if delays arise.

6. Resource Assignment
Who’s doing what? Gantt charts often include resource labels next to each task, making it easier to manage team workloads and ensure balanced resource allocation.
7. Color Coding
Color adds clarity. Many modern Gantt charts use colors to differentiate task types, statuses (e.g. on track, delayed), or teams, enabling quicker comprehension and visual scanning.
8. Drag-and-Drop Editing
Especially in digital tools, Gantt charts allow you to adjust tasks on the fly. Need to shift a deadline or reassign a task? Just drag the task bar—no spreadsheet gymnastics required.
9. Zoom Functionality
To support both high-level planning and granular tracking, many Gantt tools let you zoom in and out—giving you control over how much detail you see based on your planning horizon.
10. Baseline and Forecast Views
Advanced Gantt chart software may include baseline comparisons and forecast views so you can measure current progress against original plans and evaluate project drift.
When & When Not To Use A Gantt Chart
Gantt charts are powerful, but they’re not the right fit for every project. In some cases, they can add unnecessary complexity instead of improving visibility.
Here are some use cases where you should and should not use a Gantt chart:
| Use A Gantt Chart When… | Avoid A Gantt Chart When… |
| Managing complex projects | Managing small projects |
| Tracking deadlines and milestones | Priorities change constantly |
| Coordinating multiple teams | Tasks are mostly independent |
| Planning long-term initiatives | Work is creative or exploratory |
| Managing task dependencies | Teams need lightweight workflows |
| Sharing progress with stakeholders | Detailed planning adds unnecessary complexity |
| Balancing workloads and resources | Flexibility matters more than structure |
Benefits Of Using Gantt Charts
Let’s look at the benefits of incorporating Gantt charts into your project plans:
1. Better time management
Gantt charts can help you to better manage your time, as they allow you to see exactly what needs to be done and when it needs to be done. This clarity on task duration can help avoid wasting time on nonessential activities and sharpen focus.
2. Increased productivity
Gantt charts can also help to increase your productivity, as they allow you to better plan and organize your work. By knowing exactly what needs to be done and when it needs to be done, you can work more efficiently and get more done in less time.
3. Improved communication
Gantt charts can also improve communication between team members, as they provide a clear and concise way to share information. By using a Gantt chart, everyone will be on the same page and will know exactly what needs to be done and when it needs to be done.
4. Reduced stress levels
Gantt charts can also help to reduce stress levels, as they can help you to better manage your time and your workload. By knowing exactly what needs to be done and when it needs to be done, you will be less likely to feel overwhelmed by your work.
5. Greater clarity
Gantt charts also provide greater clarity regarding project timelines. This clarity can help project managers to make better decisions about how to allocate resources, and can help team members to better understand their roles and responsibilities.
6. Enhanced team collaboration
Gantt charts can also enhance collaboration among team members, as they provide a clear way for everyone to share information and communicate. With a Gantt chart, team members will be able to work together more effectively towards the same goal of completing the project on time and within budget.
7. Increased flexibility
Whether for large programs or smaller projects, Gantt charts adapt well. With a flexible structure that supports project phases, dependencies, and updates, they help teams stay agile even when plans shift.
How To Use A Gantt Chart
Gantt charts are an invaluable tool for project managers and teams looking to stay organized, and efficient. Therefore, we will discuss now how to use a Gantt chart effectively so that you can save time and energy in the long run!
Keep in mind that Gantt charts are not necessarily as useful for agile projects or projects using Kanban or a similar methodology.
1. Planning and scheduling
Gantt charts are used in project management for planning and scheduling purposes. Use your Gantt chart to schedule tasks by breaking down work across the timeline. This ensures that all project phases are accounted for, and the entire team understands the project scope.
They can be used to create a timeline for a project, identify which tasks need to be completed and when, and track progress through the project duration.
2. Resource allocation
Gantt charts can also be used to allocate resources to different tasks in a project. This can help to ensure that each specific task is properly staffed and that there are no bottlenecks in the project.
3. Dependency management
Gantt charts can also be used to manage dependencies between tasks in a project. This is important in ensuring that the project is completed on time and that all tasks are properly integrated. A well-structured work breakdown structure ensures tasks are ordered correctly and executed on time.
4. Tracking deadlines and communication
Gantt charts can also be used as a communication tool between different stakeholders in a project for real-time updates, ensuring transparency around key milestones, deliverables, and progress. They can help to ensure that everyone is on the same page with regard to the project timeline and objectives.
They allow for resource planning visualization, dependency management and tracking of deadlines, helping to ensure that projects remain on schedule, stakeholders have all the information they need, and that project teams can stay productive when tackling complex projects.
Just don't let your Gantt charts get too crazy:

How To Make A Gantt Chart In 6 Easy Steps
Follow these steps to create Gantt charts with ease:
1. Determine the scope
The first step in creating a Gantt Chart is to determine the scope of the project. This means identifying the tasks that make up your project and estimating their task duration. This helps define boundaries and expectations early on.
During this step, it is important to consider any external factors that could impact the project timeline or overall success, such as the availability of materials or personnel.
2. Identify tasks and activities in the project
Once you have determined the scope of the project, list all specific tasks required to complete the project. These tasks should be organized into a work breakdown structure to give shape to the project phases. These tasks should be organized chronologically from start to finish so that they can be easily translated into a Gantt chart.
Depending on how detailed you want your chart to be, tasks can range from large-scale objectives such as “Create Brand Video” to small-scale subtasks such as “Design Storyboard”.
3. Sequence tasks and activities
After identifying all tasks necessary for completion of the project, sequence the tasks in chronological order. Map dependencies to ensure you’re aware of relationships between tasks that could affect your timeframe or critical path.
It is also essential to map any task dependencies; some may need to occur before or after other tasks are complete in order for them to work properly.
4. Beware of the critical path
Once you have sequenced all the tasks correctly, it is important to identify which ones are on what is known as the critical path. These are those tasks that must be completed on time in order for other dependent tasks to stay on schedule, as well as those that cannot slip without impacting the overall project timeline.
By locating these activities beforehand, you can adjust resources accordingly if needed so that everything runs smoothly during the execution phase. This is key to keeping your scheduled tasks aligned with milestones and avoiding cascading delays.
5. Resource constraints influence timings
Before creating your Gantt Chart, it is essential to consider resource constraints that may affect the timing of particular assignments or even entire projects. This includes items like team availability, tool access, or other resource limits when estimating task duration.
Therefore, it is always a good idea to assess these factors beforehand so that any potential problems can be addressed before they get out of hand later down the line.
6. Make it visual
Finally, make sure your Gantt chart is visually appealing by incorporating colors and labels into the design where appropriate. Doing this ensures information housed within the chart remains clear and easy to understand at a glance, enabling users to pinpoint key details quickly without needing to read through the entire document first—this is helpful for tight deadlines!
Additionally, using graphics instead of words where possible helps make the planning process easier to understand for both novices and experienced professionals alike. If you're looking to make a Gantt chart in Jira specifically, check out our tips and workarounds for Jira Gantt charts here.
Top Tools for Creating Gantt Charts
As a project manager, you always have your hands full with keeping track of projects and ensuring that all milestones on the project schedule are met. One way to make your life easier is to use Gantt chart software like the below:
Clicks on the links below may earn a commission, which supports our independent testing and review of software and services. Learn more about how we stay transparent.


When choosing project management software with Gantt charts, you’ll want to look at whether it offers integrations with your existing tech stack, workflow automations, resource management capabilities, drag and drop editing abilities, and capabilities for tracking and monitoring progress, dependencies, and project task start and finish dates.
It’s also worth looking into whether the tool has an app, which can be useful. Find out more about what to look for in a Gantt chart maker here.
Take Control Of Your Project
If you're ever feeling overwhelmed by a project, just remember: there's a tool to help with that, and it's very likely a Gantt chart. These charts are an incredible way to manage projects of any size, involving any number of people, and at any level of complexity. Plus, they provide tons of benefits!
If you want more helpful tips and tricks delivered straight to your inbox, subscribe to The Digital Project Manager newsletter now.

