How to Make a Gantt Chart: A Step-By-Step Guide


In this article, I’ll show you how to make a Gantt chart step by step, explain when to use one, and provide 4 methods on how to create a Gantt chart to help you build, update, and share your project timeline.
What is a Gantt Chart?
A Gantt chart is a horizontal bar chart that shows a project schedule over time. Each bar represents a task, milestone, or activity, with its position and length showing the start date, end date, and duration.
Gantt charts help teams see deadlines, dependencies, ownership, and progress in one view, making it easier to spot scheduling conflicts and keep work on track. They’re most often used in project management, but can also support editorial calendars, product launches, event planning, and other timeline-based work.

How to Create a Gantt Chart in 8 Steps
Here are the 8 basic steps you need to get started on how to create a Gantt Chart yourself:
1. Define The Project Scope
- Clarify objectives, deliverables, and boundaries before opening any tool.
- Reference a project charter or scope statement if one exists.
- Decide how much detail your Gantt chart needs to show.
A Gantt chart can show a high-level project timeline, a detailed task plan, or something in between. Before you build one, decide whether you need to show:
- A portfolio view: multiple projects, with each project shown as one bar
- A project view: one project broken into phases or workstreams
- A task-level view: individual tasks, owners, dates, and dependencies
Consider the "zoom level” (how high or low level you want your view to be) and how that fits into your overall project plan.
2. List Project Tasks
- Use a WBS to decompose the project into manageable pieces.
- Group related tasks under summary/parent tasks.
Tip: Aim for tasks that take between 1 day and 2 weeks — anything longer should be broken down further.
Learn more about what to include in your Gantt chart here.
3. Add start and end dates
- Use historical data, expert judgment, or three-point estimation (optimistic, most likely, pessimistic).
- Include buffer/contingency time for high-risk tasks.
4. Estimate task duration
- Calculate how long each task should take.
In most cases, duration is the number of working days between the start date and end date.
This is also where you'll add information about why a specific amount of time is required.

5. Map task dependencies and milestones
- Add key project milestones, such as approvals, handoffs, launches, or major deliverables.
- Map which tasks must precede others.
Once you have a list of all the things that need to be done in your given project or Gantt chart scope, identify which tasks need to happen before others can begin. These are your dependencies.
As you map dependencies, look for the critical path: the sequence of tasks that must finish on time for the project to stay on schedule. If one critical-path task slips, the whole project timeline may slip.
6. Assign owners
- Attach a responsible person or team to each task.
- Note resource constraints (e.g., one designer shared across three tasks).
A note on resource constraints: People and resources contributing to your initiative often have skills and experience you need to consider. Stay vigilant in identifying resource conflicts or times when you have a specialized resource over-committed!
7. Plot tasks on a timeline
- Turn your task list into a visual timeline.
Each task should appear as a horizontal bar, with the bar’s position showing the start and end dates and its length showing the task duration.
You can do this by hand, in Excel or Google Sheets, or in project management software with a Gantt chart view.
8. Review, share, and update the chart
- Check the chart for gaps, conflicts, missing dependencies, unrealistic dates, and overloaded team members.
- Share it with your team and update it as dates shift, tasks change, or blockers appear.
4 Examples on How to Create a Gantt Chart
1. How to Create a Gantt Chart on Paper
- List all the tasks and activities you have in your scope on the left side of a piece of paper (landscape orientation).
- Next, draw a line across the top of the paper, not overlapping the task list, denoting the beginning and end of the scoped project timeline.
- Then, for each task, draw a box or line at the appropriate spot in the timeline relating to each task.
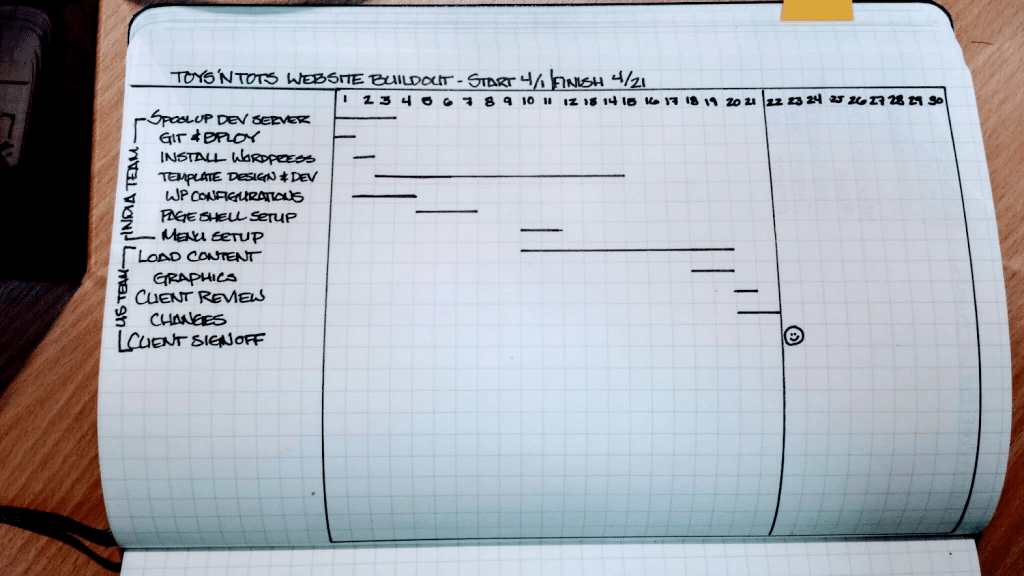
Tip: Use a pencil in case things change!
2. How to Create a Gantt Chart on a Whiteboard
1. Create a sticky note for each task or activity in your Gantt chart scope.
2. Draw a timeline across the top or middle of the board.
3. Drop in your sticky notes where they make the most sense.
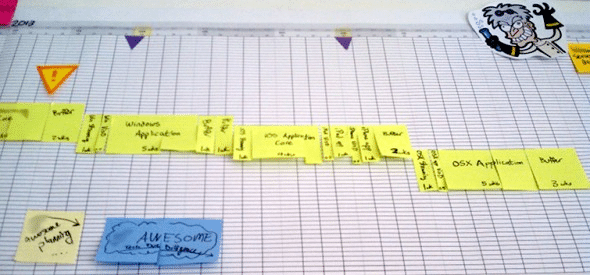
When I use this method, I often simplify my timescale by month or week at first, as many tasks need to be completed during that time. Once I drill down further, I can start sequencing the activities at a lower level of detail.

3. How to Build a Gantt Chart in Excel or Google Sheets
Create your task table
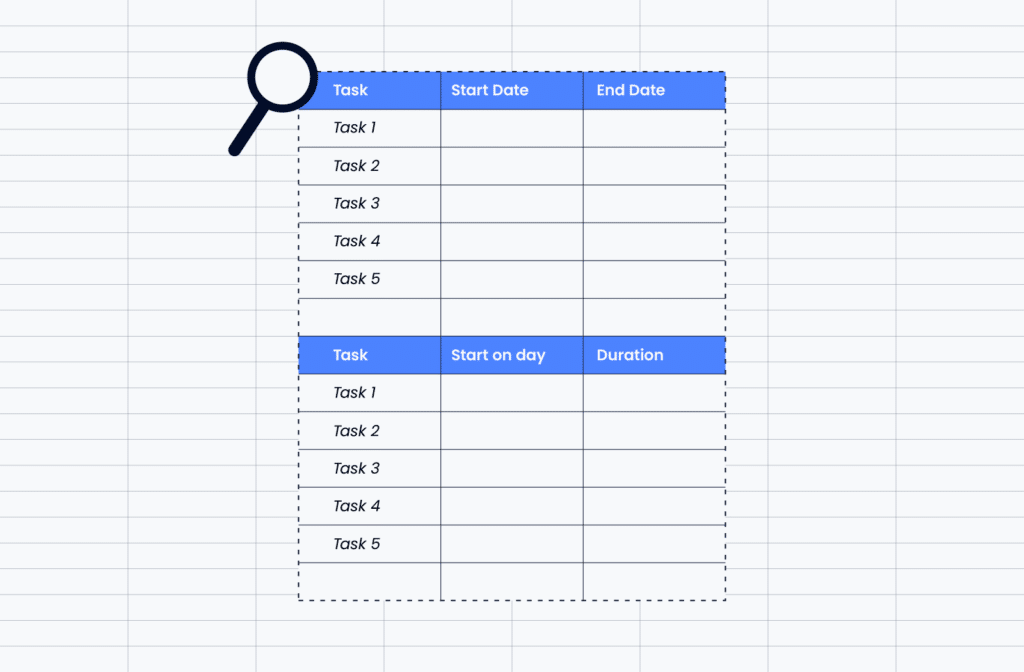
Add columns for:
- Task name
- Start date
- End date
- Duration
Calculate task duration
If you have a start date and end date, add a duration column using this formula:
End date - Start date = Duration
Insert a stacked bar chart
Highlight your task names, start dates, and durations, then insert a stacked bar chart. This will create bars that show both the start date offset and the length of each task.
Hide the start date bars
The start date portion is only there to push each task into the right place on the timeline. Format that part of the stacked bar so it has no fill or is fully transparent.
Format the timeline
Adjust the horizontal axis so the dates are easy to read. You may need to change the minimum date, maximum date, or date intervals so your chart shows the right project window.
Clean up the task order
Spreadsheet charts often reverse the task order automatically. If that happens, format the vertical axis and reverse the task list so your first task appears at the top.
Add helpful details
You can add colors, labels, milestones, or progress indicators to make the chart easier to scan. Just keep it simple enough that the timeline stays readable.
This gives you a basic Gantt chart that shows when each task starts, how long it lasts, and how the work fits together across the project timeline. It will not automatically adjust dependencies or flag scheduling risks, but it works well for simple project plans, editorial calendars, launch timelines, and other straightforward schedules.
P.S., If you're not ready to invest in a full-scale tool, see our list of free Gantt chart tools to get started.
4. How to Make a Gantt Chart With PM Software
Project management software is useful when your Gantt chart needs to do more than show dates on a timeline. Unlike paper, whiteboards, Excel, or Google Sheets, dedicated tools can connect your Gantt chart to the rest of your project plan, including task ownership, dependencies, progress updates, files, comments, and reporting.
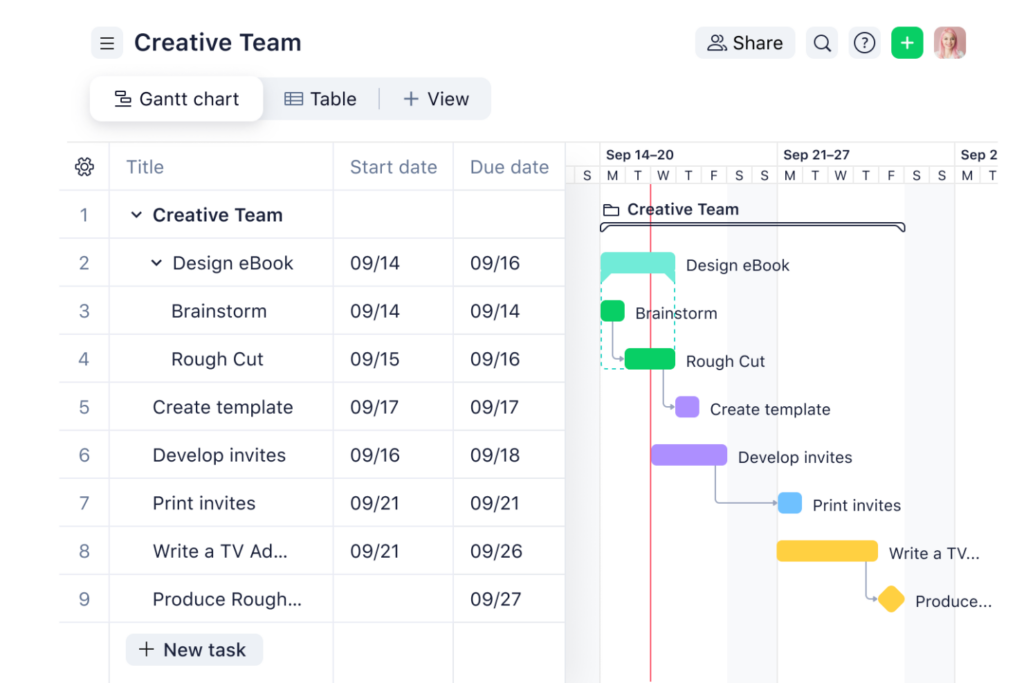
With a project management tool, you can:
- Use a Gantt chart template instead of building the timeline from scratch
- Drag and drop tasks when dates change instead of manually reformatting the chart
- Link dependencies so related tasks shift when one deadline moves
- Track progress in real time with task statuses, percent complete, or completed milestones
- Spot bottlenecks and resource conflicts before they delay the project
- Switch between views such as Gantt, Kanban, calendar, list, workload, or dashboard view
- Share a live timeline with stakeholders instead of sending static spreadsheet versions
- Use AI planning features to turn a project brief, task list, or meeting notes into a draft timeline
These features matter most when the project timeline is likely to change, multiple people are responsible for different tasks, or stakeholders need regular updates. A spreadsheet can help you create a basic Gantt chart, but a dedicated tool helps you manage the moving parts behind it.
For more options, see our full list of the best Gantt chart software tools to compare platforms with templates, dependencies, collaboration features, reporting, and AI-assisted project planning.
When Should You Use a Gantt Chart?
Use a Gantt chart when your project has multiple tasks, deadlines, owners, or dependencies that need to be understood in sequence. It is most useful when you need to see not just what needs to happen, but when it needs to happen and how one task affects another.
A Gantt chart is especially helpful when you need to:
- Plan a project timeline from start to finish
- Show task start dates, end dates, and durations
- Track dependencies between tasks
- Identify milestones, handoffs, and deadlines
- Spot scheduling conflicts before work begins
- Show stakeholders how the project is progressing
- Keep teams aligned when work overlaps across people or departments
You may not need a Gantt chart if your project is simple, has only a few tasks, or does not depend on a fixed timeline. In those cases, a task list, checklist, or Kanban board may be easier to maintain.
Why use a Gantt Chart tool?
While free programs like Excel can do the trick, using project management software is usually the right choice.
In most cases, without a dedicated tool, useful features such as identifying bottlenecks, periods of wasted time, or task dependency complications are not present. If you need those advanced features, you’ll want to invest in a dedicated Gantt chart tool.
Check out our guides on using tools like Asana for project management and tips and tricks for using monday.com to learn more about creating Gantt Charts in your PM software.
Tip: Gantt chart software also typically includes plenty of Gantt chart templates, so starting a project is quick and easy.
Get Started Creating Gantt Charts
Looking to learn more? Be sure to subscribe to The Digital Project Manager to stay up-to-date on all emerging trends in project management.