Gantt Chart vs. PERT Chart: Key Differences

Visualize Your Project Timeline: Gantt charts offer a clear, visual representation of your project schedule and make it easy to track task durations and monitor progress throughout the project's lifecycle.
Understand Task Dependencies Easily: PERT charts help you identify relationships and dependencies between tasks, so you can plan and anticipate potential delays on even the most complex projects.
When to Use Which: Gantt charts are ideal for defined timelines and predictable schedules, while PERT charts are best in situations with uncertain timeframes and complex dependencies.
Gantt charts are used when you need to visualize and map your project timeline, and PERT charts are used to identify task dependencies and determine the duration of each activity on your project. Both project management tools can help you plan your projects, set realistic due dates, and keep your project on the rails.
Gantt Chart vs. PERT Chart: Key Takeaways
A Gantt chart is a horizontal bar chart that represents a visual timeline used to plan and schedule tasks over a specific period.
A PERT chart is a network diagram that you can use to map out task dependencies and sequences. A Gantt chart provides a straightforward timeline view of tasks, and a PERT chart focuses on the relationships and dependencies between tasks.
What Is a Gantt Chart?
A Gantt chart is a bar graph that provides a visual representation of your project schedule and shows how tasks progress over time. You’ll typically create these using Gantt chart software—this is the easiest way to plan, coordinate, and track tasks on a clear timeline view, although there are plenty of other Gantt chart software benefits.
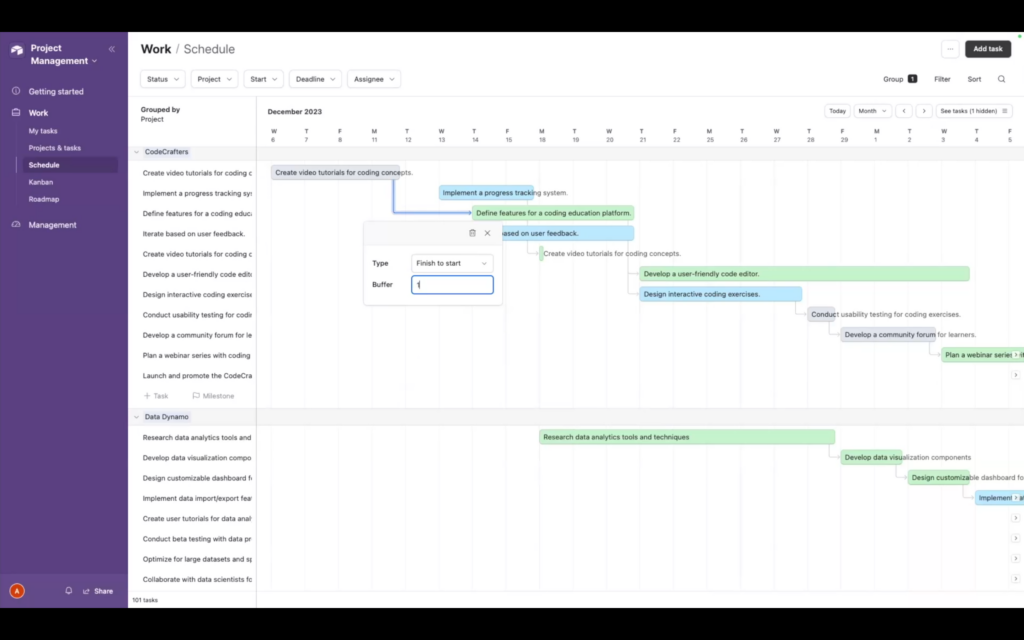
Tasks go on the Y axis (vertical) and a timeline goes on the X axis (horizontal). Each task is represented by a horizontal bar, with its length indicating the duration.
Start dates and end dates are typically annotated on the chart directly. You can easily identify start and end dates, as well as overlapping or dependent tasks and subtasks.
Gantt charts are useful for managing complex projects with interdependent tasks. They help you monitor project progress, allocate resources, and stay on top of deadlines.
You can also add color-coding and project milestone markers to make it easier to distinguish task categories and key dates. Gantt charts also help you identify bottlenecks early and adjust to keep projects on track.

What Is a PERT Chart?
A PERT (program evaluation and review technique) chart is a network diagram or flowchart-style tool used to analyze and represent the specific tasks involved in completing a project and the dependencies between them.
PERT charts are also used in the critical path method (CPM), which determines the sequence of tasks that represents the shortest possible project duration. It helps you visualize the relationships between project tasks, and schedule and coordinate complex projects.
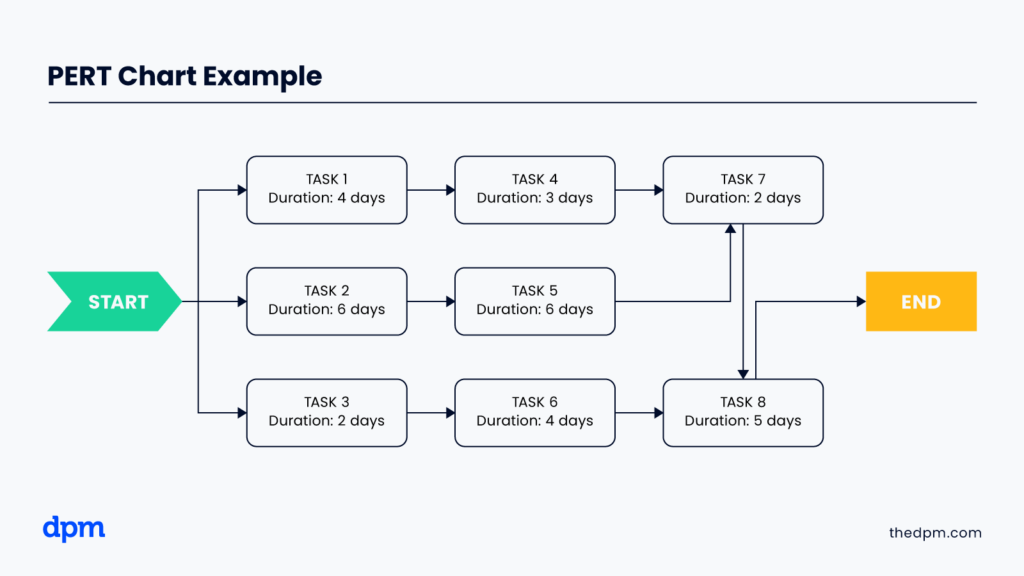
The nodes on a PERT chart represent individual tasks, and the arrows show task dependencies. PERT charts help you manage project timelines and set accurate project estimates. They can also improve planning and risk management by helping you anticipate potential delays in the project timeline.
Key Differences Between Gantt Charts and PERT Charts
Here are three essential distinctions between Gantt charts and PERT charts:
1. Time Representation vs. Task Dependencies
Gantt charts focus on time and show when tasks start and finish, as well as how they overlap on a timeline. PERT charts help you identify task dependencies and understand the sequence of tasks and how they relate to each other. While Gantt charts can also help you identify dependencies, they are more ideal for tracking progress and managing schedules.
2. Linear Timeline vs. Network Diagram
Gantt charts display tasks on a linear timeline, which makes them easy to read and ideal for tracking project schedules. PERT charts use a network diagram structure to map out task sequences and dependencies.
The linear format of Gantt charts provides a clear view of task completion times and overlaps, while the network structure of PERT charts helps you visualize complex relationships and identify the critical path.
3. Static vs. Dynamic Planning
Gantt charts offer a clear, static view that works well for straightforward, predictable project plans that follow more traditional methodologies like waterfall. They are ideal for simple projects with fixed timelines.
PERT charts offer a more dynamic, agile approach that is better suited for managing uncertainty and variability. They allow you to adapt to changes in task durations and dependencies, which is useful if your project timeline or requirements are changing frequently.
When to Use a Gantt Chart vs a PERT Chart
Gantt charts are best for projects with a clear timeline, defined requirements, and a predictable schedule. It’s ideal for visualizing task durations, overlaps, and deadlines, and you can use Gantt charts to monitor progress and keep team members aligned.
PERT charts are more suited for projects with complex dependencies and uncertain timeframes. You can use them to analyze task sequences and identify the critical path.
You’ll likely use both on your projects:
- Start with a PERT chart in the initial planning phase of the project. Use it to estimate the amount of time required for each task in the project and to determine the critical path.
- Just before you kickoff the project, create a Gantt chart based on the dependencies, minimum times, and critical path you determined using your PERT chart. Use your Gantt chart throughout the entire project to monitor progress and whether you’re on track to meet the project deadline.
What's Next?
Want to connect with other digital project managers to share resources and best practices? Join our membership community and get access to 100+ templates, samples, and examples and connect with 100s of other digital project managers in Slack.