Workflow Visualization: Benefits, Examples, & Steps

Dig into the Details: Workflow visualizations clarify process steps, dependencies, and relationships, so your workflows are easier for the team to understand and for you to analyze and iterate on.
Clean Up Your Processes: Workflow visualization helps you uncover and correct inefficiencies, and ultimately prevent project failures, smooth out processes, and achieve better outcomes.
Get Software Savvy: Workflow diagram and management software tools are the easiest way to create clear visualizations, orchestrate your workflows, and make adjustments to keep things running.
A lack of well-planned and orchestrated workflows can cause project failure, but you can easily uncover and rectify inefficiencies using workflow visualization.
You’ll likely be using workflow diagram software or workflow management software when it comes to workflow visualization (more on this below).
What Is Workflow Visualization?
Workflow visualization is the process of visually illustrating a workflow using diagrams, charts, or other graphical tools. It visually represents the workflow steps, dependencies, and relationships, making it easier to understand, analyze, and integrate into a larger process.
Some common visualization techniques include:
- Flowcharts: Project management flowcharts use symbols and arrows to represent the sequence of steps and decision points from the start to the endpoint of each business workflow.
- Swimlane diagrams: Swimlane diagrams divide a workflow into lanes, each representing a different role, department, or team.
- Kanban boards: Kanban boards use columns and cards to represent different workflow stages.
By visually representing the steps and dependencies of a workflow, you'll be able to identify bottlenecks, discover opportunities for optimization, make sure resources are allocated efficiently, and improve operational performance.
Examples of Workflow Visualizations
Workflow visualization is used in various industries and sectors to improve workflows. Let's take a look at some successful real-world examples of workflow visualization.
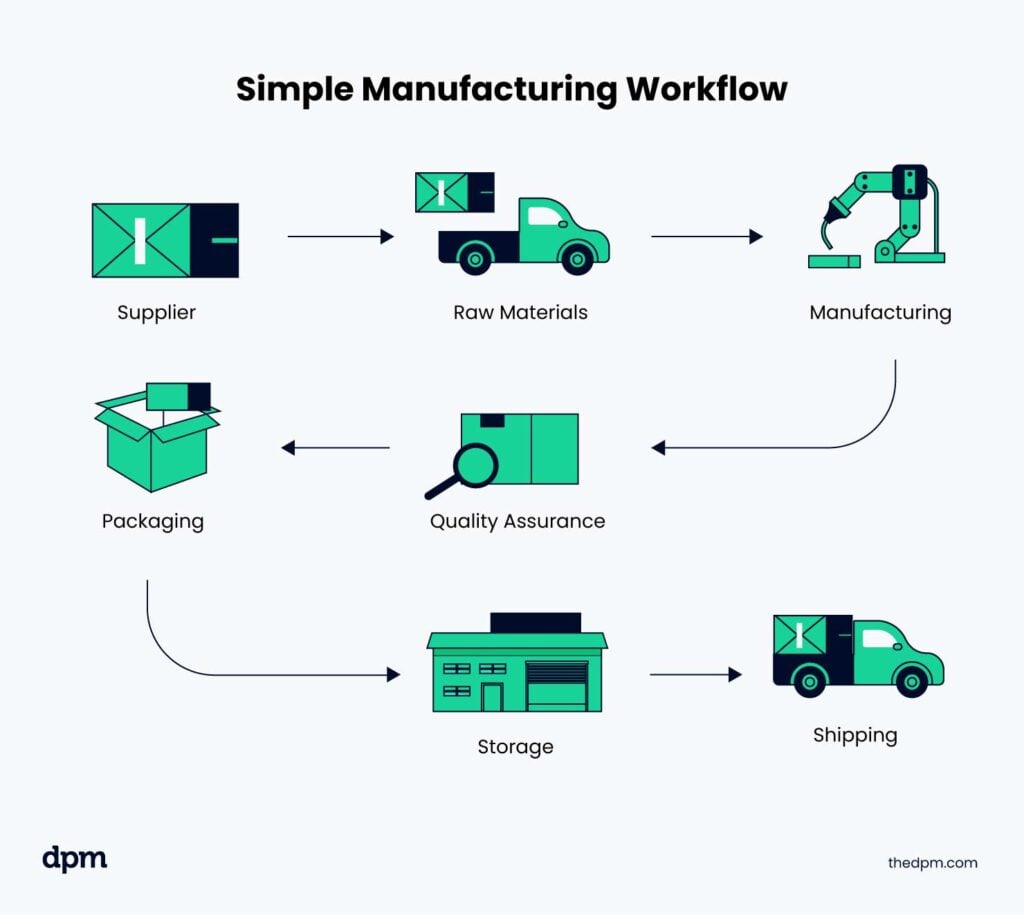
1. Optimizing Assembly Lines In The Manufacturing Industry
In the manufacturing industry, visualizing workflows helps optimize production workflow processes. Companies use value stream maps to visualize the flow of materials, information, and resources from raw materials to finished products. This helps identify bottlenecks, reduce waste, and improve overall efficiency.
For example, a car manufacturing company used visual workflow monitoring capabilities to streamline its business operations, specifically its assembly line.
Results: The car manufacturer achieved their goal of increasing overall car manufacturing profit margins by 15-20% and reduced the average manufacturing time frame to 12-13 hours.
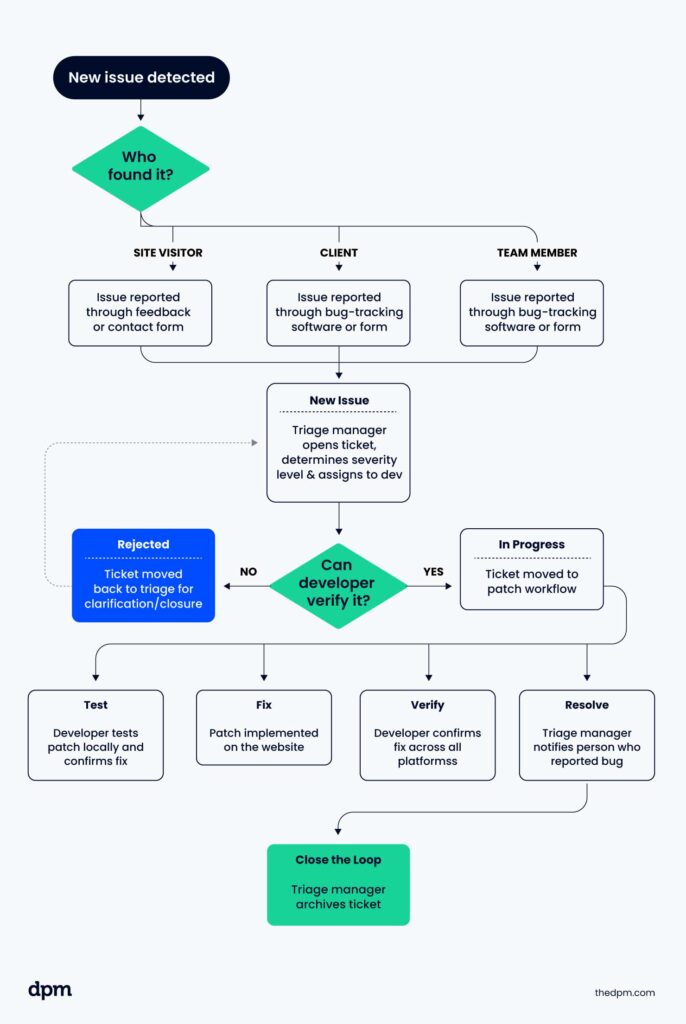
2. Improving Ticket Handling In IT Operations
IT teams use incident management boards or Kanban boards to plan capacity, visualize the status of different incidents, assign tasks, track progress to improve communication, reduce response time, and ensure transparency in the resolution process.
For example, one telecommunications company implemented workflow visualization for their help desk to keep up with support tickets.
Results: By visualizing the ticket handling process and introducing 20 automated workflows, the company reduced ticket handling time by up to 39% using a help desk software tool.
3. Automating Marketing Campaigns In The Software Industry
By visualizing the different stages of a marketing campaign, teams can track progress, allocate resources, and make sure work is executed in a timely fashion. This helps improve collaboration, align marketing activities with business goals, improve marketing resource management, and optimize campaign performance.
For example, one software company visualized and automated the steps in its telemarketing campaign workflows to invite customers to a webinar and demonstrate its new product.
Results: The campaign achieved a 40% increase in registrations, a 25% increase in attendees, and a 20% increase in product trials.
Benefits of Workflow Visualization
Workflow visualization offers a range of benefits for your projects:
- Increased clarity and transparency: Visual workflows allow stakeholders to understand the process clearly and the steps involved, dependencies, and handoffs. This helps you eliminate ambiguity, reduce miscommunication, and keep everyone is on the same page.
- Improved decision-making: Analyzing visualizations helps you identify bottlenecks, inefficiencies, and areas for improvement. You can then make informed decisions about priorities or resourcing based on this information.
- Increased collaboration and communication: Visualizing the team's workflow allows members to understand their roles, responsibilities, and dependencies easily. This fosters teamwork, improves coordination, and improved cross-functional collaboration.
- Better, more efficient processes: Visualization helps you identify areas of inefficiency and potential solutions. This eliminates waste, reduces manual effort, and leads to streamlined workflows, more productivity, and cost savings.
Drawbacks
Workflow visualization can be time-consuming, requires specialized skill sets, and isn't always well-received. I've found that teams are sometimes skeptical about changing processes due to fears about job security. Retraining and coaching team members on workflow changes also takes some time—not to mention the finesse needed to put your team at ease.
How To Do Workflow Visualization
The process of visualizing a workflow involves understanding the current state of your workflow, mapping it out, analyzing the data, and implementing improvements.
1. Identify The Scope of The Workflow
The first step is to thoroughly understand the workflow's full scope. Identify all the steps involved, dependencies, and handoffs between different stages. Involve all relevant stakeholders to ensure they have a comprehensive understanding of the workflow.
2. Select a Workflow Visualization Tool
Manually mapping out workflows is not efficient. Similar to improving your workflows, having the right workflow visualizer tools to complete this process can save you a significant amount of effort and time.
3. Map Out Your Workflow
Next, map your workflow visually. You can use various techniques, such as flowcharts, swimlane diagrams, or Kanban boards, to outline the stages and steps involved. The goal is to create a visual representation that is easy to understand and provides a clear overview of the entire workflow.
4. Analyze The Data
Once your workflow is mapped out, analyze the data to identify bottlenecks, inefficiencies, and areas for improvement. Look for patterns, delays, and dependencies that may hinder the workflow. This analysis will help you pinpoint areas where you can make changes to optimize the workflow.
5. Implement Improvements
Implement improvements to your digital workflow. This may involve eliminating unnecessary steps or introducing workflow automation to reduce manual effort. The benefit of workflow automation is that it will make your workflow and the team completing the work more efficient and productive.
6. Document and Communicate All Changes
Update your workflow documentation and communicate the purpose for the changes and what changes are planned. This gives ample time for everyone to weigh in and provide valuable input about potential issues, as well as for you to get buy-in.
7. Monitor and Iterate
Review your workflow management process regularly, gather feedback and data on performance metrics, and involve your team in identifying areas for further workflow optimization. Making iterative improvements will help you maintain an optimal workflow over time.
Tools For Workflow Visualization
Workflow software typically includes features for workflow diagramming, workflow automation, or workflow management.
Workflow diagram software will help you visualize our workflows, workflow management software will help you build out and organize your workflows, and workflow automation software is for speeding up and automating the manual parts of your processes.
Look for user-friendly functionality like whiteboards and workspaces to handle complex workflows that work with your company’s existing or planned integrations.
Here's a few of the best workflow diagram software to help you create a shortlist.
Clicks on the links below may earn a commission, which supports our independent testing and review of software and services. Learn more about how we stay transparent.


Workflow Visualization Best Practices
Here are some best practices for workflow visualization:
- Involve stakeholders: I find that including all relevant stakeholders in the workflow visualization process makes a huge difference in overcoming resistance to change. Everyone will have a comprehensive understanding of why workflow changes are necessary, which helps you get stakeholder buy-in.
- Keep it simple and clear: Make sure the design of your workflow is simple and easy to understand. Use clear labels, symbols, and colors to represent different steps, dependencies, and statuses. Avoid clutter and unnecessary details that may confuse or overwhelm viewers.
- Regularly review and update: Make sure your visualizations are up-to-date and reflect updates to processes, roles, or priority changes. This keeps it relevant to your organization's evolving needs. Keep gathering feedback and analyzing performance metrics to help identify areas for further improvement.
Join For More Workflow Management Insights
Want to connect with other digital project managers to share resources and best practices? Join our membership community and get access to 100+ templates, samples, and examples, and connect with 100s of other digital project managers in Slack.
