7 Elements To Include In A Gantt Chart + Other Easy Tips

A Gantt chart can be an effective tool for project managers to visually represent project progress. But how do you ensure that your Gantt chart includes the correct information to wow your stakeholders? As with any project management tool, the more you understand a Gantt chart, the more you can use it to you and your team’s advantage.
In this article, we’ll cover the elements of a basic Gantt chart, things to consider when building one, how to customize Gantt charts to your needs, and reporting guidelines.
Elements of a Basic Gantt Chart
By default, a Gantt chart is plain and rudimentary. That doesn’t mean, however, that this type of project management tool lacks substance.
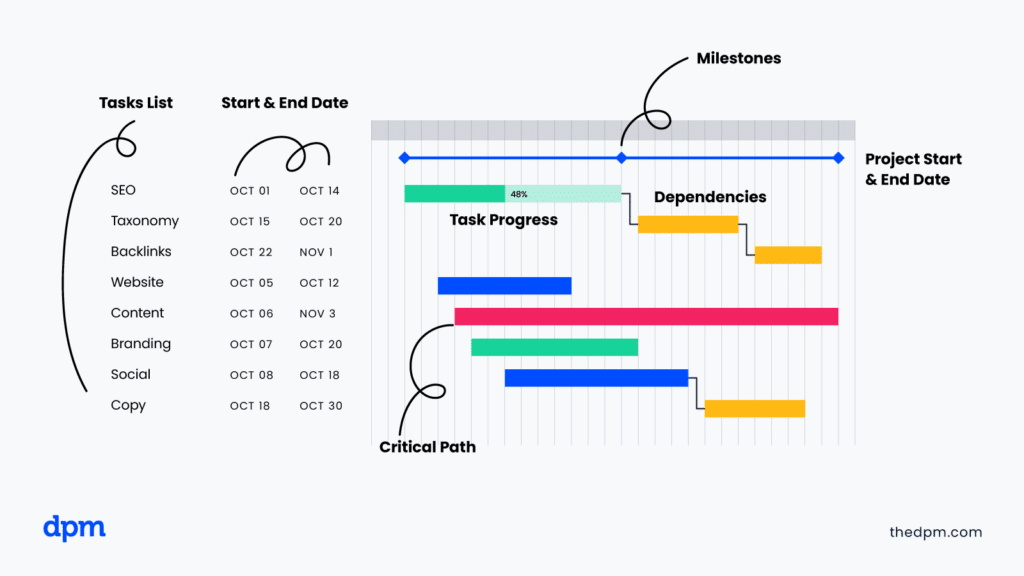
Gantt charts are typically configured with task names listed along the y axis, and the project timeline represented on the x axis. Even a simple Gantt chart should include the following 7 critical elements:
- The list of tasks needed for this project: what are the activities required for project completion?
- The start date and end date of each task
- The progress made toward the completion of each task: is the task on track, at risk, or delayed?
- The dependencies across tasks: Are there any predecessor-successor relationships across your project?
- The start date and end date for the entire project (if you only have estimates, it might be best to go back and create a PERT chart; these differ from Gantt charts but the two complement each other when used in tandem)
- Important milestone dates within the project’s timeline
- The project’s critical path: i.e., the set of tasks that take the longest time to complete in a project and so provide an estimate of project duration
It’s a lot easier to understand this type of essential project information in a visual format, especially for stakeholders that may not be as closely invested in day-to-day project activities. This is where the Gantt chart comes in handy.
Considerations When Building A Gantt Chart
In this section, we’ll highlight a few things to consider when building a Gantt chart.
1. Gantt Charts within The Project Planning Process
Before diving straight into the visualization, it’s helpful to take the time to plan and organize your thoughts. Successful project managers use many different project management tools for project planning.
Specifically, I’d recommend developing a work breakdown structure (WBS) as a precursor to creating a Gantt chart. Aside from providing a task summary, a WBS conveniently organizes tasks hierarchically into phases and groups.
Once project data is organized into chunks, it’s easier to establish milestones and timeframes that you can visualize using a Gantt chart.
Even if you are using a Gantt chart template from your project management software, make sure to clearly define each task in the project, along with each task dependency. This also makes it easier to assign team members to complete each project task.
2. Label Task Dependencies
Once project managers identify the tasks that comprise a project, the next step is to map task dependencies. Labeling task dependencies, along with the start and end date for each task, helps visualize the critical path for project completion.
Project managers use abbreviations to label the four types of task dependencies.
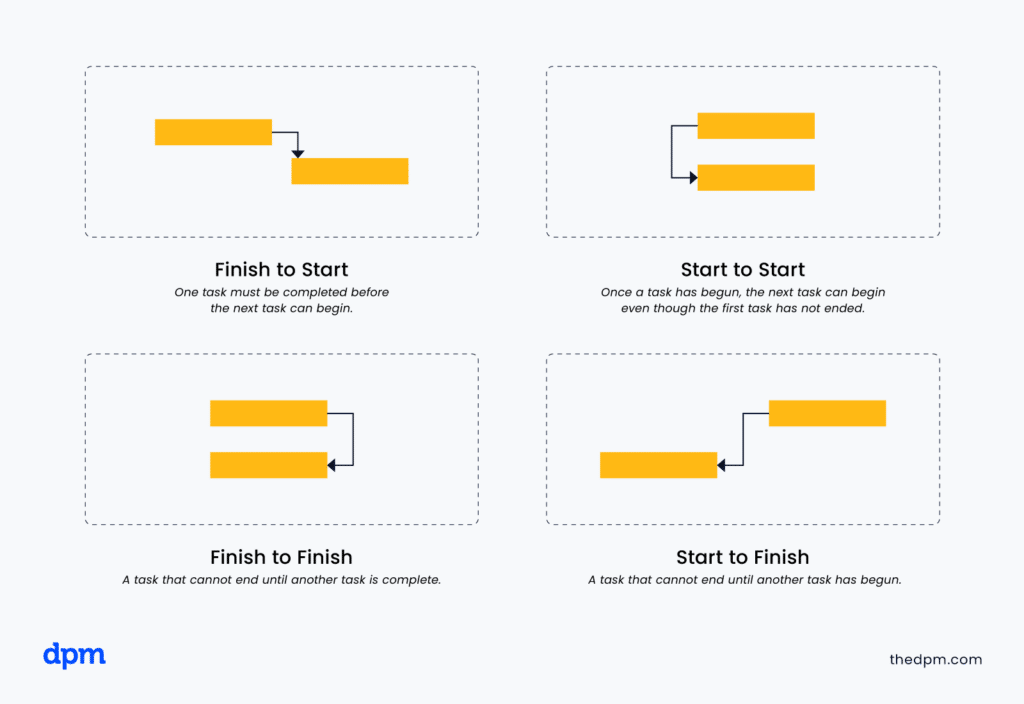
- FS – finish to start: One task must be completed before the next task can begin. This is the most common type of dependency in most waterfall projects.
- SS – start to start: Once a task has begun, the next task can begin even though the first task has not ended.
- FF – finish to finish: A task that cannot end until another task is complete.
- SF – start to finish: A task that cannot end until another task has begun. This is the least common type of dependency in most waterfall projects.
3. Take Account of Team Member Availability and Work Schedules
When creating a Gantt chart, make sure that you consider holidays and other non-working days that may fall within the project timeline.
You’ll also want to consider the work schedule of your team members. Knowing your team’s availability and how much of their workday can be devoted to a project is necessary for setting a realistic deadline.
4. Not All Information is Conveyed in a Gantt Chart
A Gantt chart is not a fail safe for effective project management. Specifically, project managers must:
- Accurately and comprehensively define tasks required for project completion—your Gantt chart is only as good as the data that goes into it
- Consider that a Gantt chart does not account for the resources needed for a project. This information is gathered when creating a project plan.
- Use an additional tool to keep up with the cost or scope of a project. Gantt charts are organized to report information based on the project’s timeline, not the project’s budget or scope.
Customizing Your Gantt Chart for Your Team and Projects
With such a vast array of Gantt chart software available, it is possible to create a customized Gantt chart that meets your team’s needs. The more specific your Gantt chart, the more clearly and accurately it will foster communication within your team.
A customized Gantt chart can be an effective visual when making presentations to senior management. You can also use this tool to report on your project’s progress to stakeholders who want reassurance that deadlines are being met.
More on specific use cases for Gantt charts here.
Some Advantages to Customization
Gantt chart software provides project managers with a myriad of customization options. You can use different colors to represent different team members, or different colors can represent different phases of a project.
By customizing the bars, you ensure information is visually conveyed with minimal confusion, which is the goal of any report.
A Gantt chart tool also lets you customize the project timeline. A project manager may need to adjust a chart from hours to days, from days to weeks, or even weeks to months.
Because this can be done in one click, Gantt chart software affords you the ability to adapt to the changing circumstances of a project.
Other Customization Options
An online Gantt chart allows teams to work collaboratively to keep stakeholders apprised of project progress. You can customize email alerts so those involved with a project’s execution stay on the same page. This reduces any lag time between departments or team members.
Project managers can customize Gantt charts with notes, videos, or links. When project management task dependencies are highly concentrated, the ability for team members to collaborate real-time can be invaluable in terms of worker efficiency.
Reporting from a Gantt Chart
Gantt charts offer project managers an effective way to produce real-time progress reports.
Beyond providing a real-time snapshot, Gantt charts can also be effective in predictive analysis. Project managers can use Gantt charts to predict when and where a project’s timeline may need to be adjusted.
For example, a change in the timeframe of one task will also affect the timeframes of dependent tasks. Since tasks can both be completed before they are scheduled to do so (according to the project schedule) or take longer than initially thought, the project manager who uses a Gantt chart as a project management tool remains one step ahead of the action.
Final Thoughts
Ultimately, the Gantt chart is not only for project managers but also a tool that benefits the entire project team. Gantt charts are accessible to stakeholders at varying levels of seniority and familiarity with project details. Furthermore, Gantt chart software makes it even easier to create these useful visualizations of project data.
If you're looking to make a Gantt chart in Jira specifically, check out our tips and workarounds for Jira Gantt charts here.
Continue reading to find the best Gantt chart software solutions that will help you manage your projects most successfully.

