Jira Gantt Chart: How To Create One + Best Plugins


Jira doesn't include a true Gantt chart out of the box. What it does have are two built-in planning views: Jira Timeline (free) and Jira Plans (Premium only, formerly Advanced Roadmaps), but neither of which supports milestones, critical path, or baselines. For most project managers, that means a Marketplace plugin is required.
Find out exactly what Jira can (and can't) do natively, which plugin is right for your team, and how to set it up.
What Is A Gantt Chart?
A Gantt chart is a visual representation of a project timeline, showing the scope of each activity, as well as when they should begin and finish.

This sort of graph lets you see how various activities must be combined to achieve the desired result, whether it's completing the construction of a new hospital or implementing new software. If you use only one tool for managing your projects, make it a Gantt chart.
Does Jira Have a Gantt chart? Timeline vs Plans vs True Gantt
Jira has two built-in planning views that look Gantt-adjacent, and neither is a true Gantt. Here's what each one actually does. Atlassian has rebranded these tools twice. "Basic Roadmaps" is now Jira Timeline. "Advanced Roadmaps" is now Jira Plans. Same tools, new names.
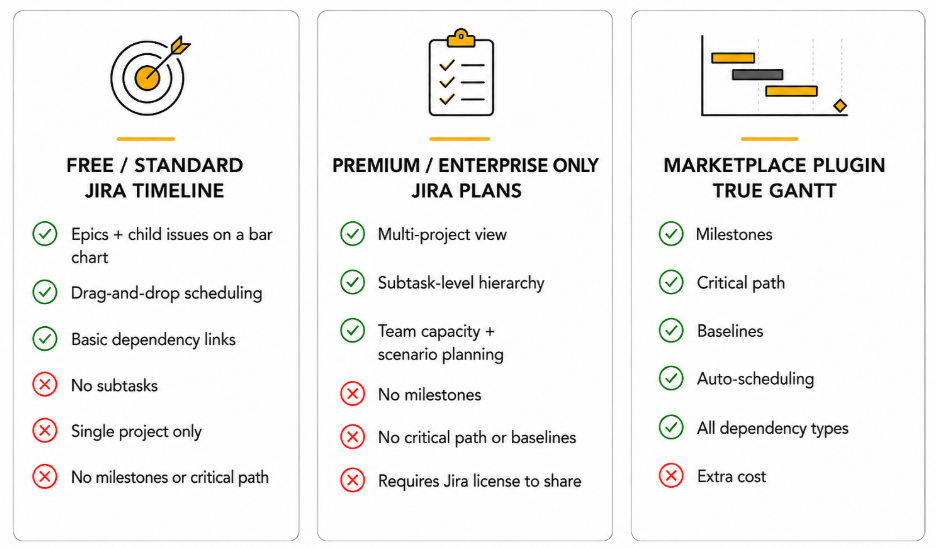
The key gaps in both native options: neither Jira Timeline nor Jira Plans supports milestones, critical path, or baselines, which are three things most project managers consider non-negotiable for real schedule management. And neither lets you share a view with stakeholders who don't have a Jira license.
If you need any of those features, a Marketplace plugin is the only path forward.
Why Use a Gantt Chart In Jira?
Specifically, a Gantt chart in Jira lets you:
- See the full timeline: features, start and end dates, dependencies, all in one view
- Manage stakeholder expectations: show progress without pulling people into Jira
- Spot schedule risk early: dependency chains make bottlenecks visible before they hit
- Plan resources: used as a resource loading chart, it shows who's assigned to what and when capacity runs thin
Despite being associated with waterfall, Gantt charts are just as useful for agile teams, particularly for communicating sprint timelines to non-technical stakeholders who don't live in your project roadmap day-to-day. Most project management tools support a Gantt view for exactly this reason.
How To Create A Gantt Chart In Jira
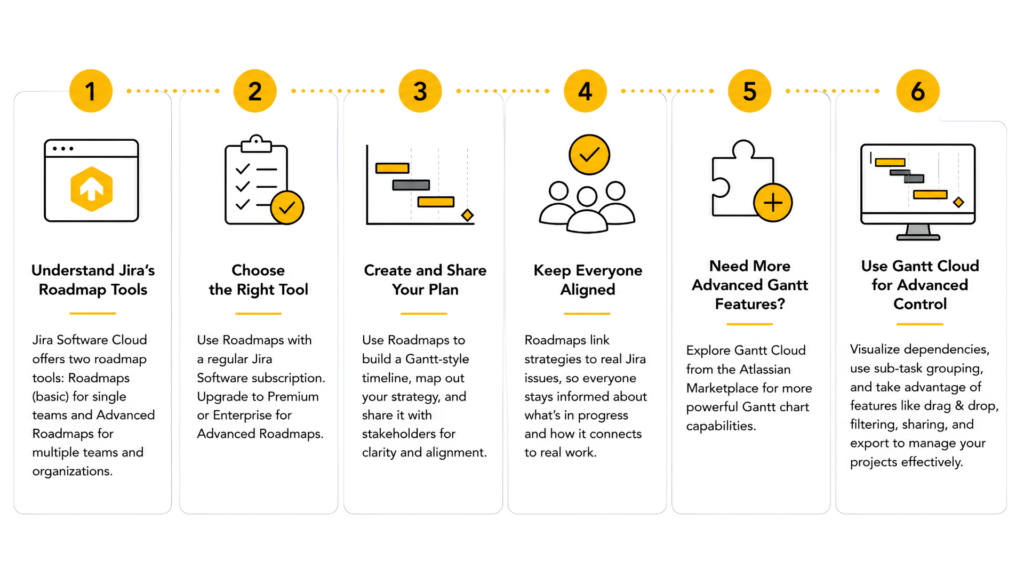
The approach depends on whether you're on Jira Cloud or Server/Data Center and what your subscription level is.
Jira Server/Data Center
Step 1: Check what you already have
Jira Server and Data Center don't include a Timeline view by default. To get Gantt functionality, you'll need to install a plugin from the Atlassian Marketplace. Native planning views like Jira Timeline and Jira Plans are only available on Jira Cloud.
Step 2: Install a Gantt plugin
Go to Administration → Manage apps → Find new apps and search for "Gantt chart." The three most widely used options for Server/Data Center are BigGantt, Gantt-Chart for Jira, and WBS Gantt-Chart for Jira, all covered in detail in the plugin section below.
Step 3: Configure your first chart
Once installed, open your project and look for the Gantt option in the left sidebar (exact placement varies by plugin). From there you can map your existing Jira issues to a timeline, set dependencies, and adjust start and end dates directly in the chart view.
Jira Cloud
Step 1: Check what you already have
Open any project and click Timeline in the left sidebar. If you're on a Free or Standard plan, this is your built-in option, good for epic-level scheduling within a single project.
If you're on Premium or Enterprise, you also have access to Jira Plans (formerly Advanced Roadmaps) under the Plans menu in the top navigation. This adds multi-project views, subtask hierarchy, and team capacity planning.
Step 2: Decide if native tools are enough
If you need milestones, critical path, baselines, or the ability to share with people outside Jira, the native tools won't cut it. In that case, skip to the plugin section below to find the right Marketplace option for your team.
Best Gantt Chart Plugins for Jira
Whether you're on Jira Cloud, Server, or Data Center, the plugins below add true Gantt functionality that Jira's native tools can't match. All three are available across platforms and free for up to 10 users. Install them from the Atlassian Marketplace under Apps → Explore more apps.
| Plugin | Best For | Key Features | Free Tier |
| BigGantt | Complex scheduling + agile roadmaps | Critical path, baselines, milestones, all 4 dependency types, auto-scheduling | Up to 10 users |
| Gantt-Chart for Jira | Agile teams with large issue volumes | Sprint/epic/story visualization, WBS, fast load at 20,000+ issues | Up to 10 users |
| WBS Gantt-Chart for Jira | MS Project migrants + traditional PMs | Critical path, baselines, milestones, MS Project import, Excel export | Up to 10 users |
BigGantt
Best for: Complex scheduling, dependency management, and agile roadmaps
BigGantt is the most widely installed Gantt plugin on the Atlassian Marketplace (7,000+ installs). It adds true Gantt functionality inside Jira: milestones, critical path, WBS, all four dependency types, and What-If scenario planning, without leaving the tool your team already uses.
Key features:
- Inline edits, drag-and-drop scheduling, and auto-scheduling
- Multi-project views with WBS and multi-level grouping
- Resource monitoring and high-level agile roadmaps
- Workflow management across epics, stories, and subtasks
Watch out: One review flagged 2–3 second lag on every change, regardless of server spec. Connecting issues also has an unintuitive quirk, changing a parent issue can drag its child along unexpectedly. Worth testing on your own data before committing.
Free up to 10 users · Cloud, Data Center, Server
Gantt-Chart for Jira
Best for: Agile teams and product owners managing large issue volumes across multiple projects
Built specifically for agile workflows, Gantt-Chart for Jira displays charts directly from your agile boards, showing sprints, epics, stories, and associated tasks in a single timeline view. It's one of the stronger options for enterprise project management teams dealing with high issue counts.
Key features:
- Sprint, epic, and story visualization pulled from agile boards
- Work breakdown structure organization across multiple projects
- Individual column configuration for custom views
- Fast load times even at 20,000+ issues, a genuine differentiator for large teams
Watch out: Fewer advanced scheduling features than BigGantt or WBS Gantt-Chart, if critical path or baselines are priorities, look elsewhere.
Free up to 10 users · Cloud, Data Center, Server
WBS Gantt Chart for Jira
WBS Gantt-Chart for Jira
Best for: Traditional project managers migrating from Microsoft Project, or teams needing the most cost-effective full-featured Gantt plugin
WBS Gantt-Chart for Jira is the closest thing to a Microsoft Project replacement inside Jira. It covers the full scheduling lifecycle, from planning through execution, with the advanced features that native Jira tools lack, at the lowest per-user cost of any major plugin (~$0.59/user/month at scale).
Key features:
- Critical path view, milestones, and baseline plan tracking
- All four dependency types for complex project structures
- MS Project import + one-click Excel export (more on creating Gantt charts in Excel)
- Automatic project completion percentage calculations
- Delayed task alerts to catch schedule slip early
- Resource management in Jira built in
- Multilingual support: English, French, German, Japanese, Korean
Watch out: Users consistently flag slow feature rollouts and maintenance cycles, if you need a rapidly evolving tool, BigGantt or ProScheduler move faster.
Free up to 10 users · Cloud, Data Center, Server
Alternatives To Gantt Charts In Jira
If Jira isn't the right fit, or you want Gantt functionality without the plugin overhead, these tools include native Gantt views out of the box. See our full roundup of the best Gantt chart makers for a deeper comparison, or browse the best Gantt chart software options by use case.
Clicks on the links below may earn a commission, which supports our independent testing and review of software and services. Learn more about how we stay transparent.


Whichever route you take, a Gantt chart brings workflow clarity that Jira's boards alone can't provide. For more on getting the most out of Jira, see our Jira tips and tricks.