10 Best ThoughtSpot Alternatives in 2026

Best ThoughtSpot Alternatives Shortlist


The strongest ThoughtSpot alternatives give you flexible reporting tools, real-time analytics, and self-serve data exploration without the steep learning curve. If you’re looking for reporting platforms that outpace ThoughtSpot—whether it’s to fit your workflow, satisfy unusual data requirements, or keep costs down—you’re in the right place.
Here, you’ll find trusted options that help your team analyze data, create interactive dashboards, and pull actionable insights faster. Use this guide to compare features, strengths, and reasons each tool could be the upgrade your reporting process needs.
What is ThoughtSpot?
ThoughtSpot is a self-service analytics and reporting platform that lets users query data using natural language searches. It’s designed to help business teams quickly create reports, analyze trends, and visualize data without relying on data experts.
ThoughtSpot’s intuitive interface allows users to explore large datasets, create dashboards, and share insights across teams, making it popular for organizations that want direct, on-demand access to business intelligence.
Best ThoughtSpot Alternatives Summary
This comparison chart summarizes pricing details for my top alternative selections to help you find the best one for your budget and business needs.
| Tool | Best For | Trial Info | Price | ||
|---|---|---|---|---|---|
| 1 | Best for pre-built metric visualizations library | 14-day free trial | From $120/month (billed annually) | Website | |
| 2 | Best for interactive dashboard design | Free trial + free plan available | From $15/user/month (billed annually) | Website | |
| 3 | Best for automated executive dashboards | Free plan + free trial + free demo available | From $64/month (billed annually) | Website | |
| 4 | Best for connections to cloud app data sources | 30-day free trial + free demo available | Pricing upon request | Website | |
| 5 | Best for custom embedding into products | 7-day free trial + free demo available | Pricing upon request | Website | |
| 6 | Best spreadsheet-style cloud analytics | Free demo available | Pricing upon request | Website | |
| 7 | Best for integration with Microsoft 365 tools | Free trial + free plan available | From $14/user/month (billed annually) | Website | |
| 8 | Best for open-source visualization flexibility | Free forever | Free forever | Website | |
| 9 | Best for associative data exploration capabilities | 30-day free trial + free demo available | From $300/month (billed annually) | Website | |
| 10 | Best for AI-powered natural language analysis | Free demo available | Pricing upon request | Website |
Why You Can Trust Us
We’ve been testing and reviewing project management software since 2012. As project managers ourselves, we know how critical and difficult it is to make the right decision when selecting software.
We invest in deep research to help our audience make better software purchasing decisions. We’ve tested more than 2,000 tools for different project management use cases and written over 1,000 comprehensive software reviews. Learn how we stay transparent & our software review methodology.
-

Celoxis
Visit WebsiteThis is an aggregated rating for this tool including ratings from Crozdesk users and ratings from other sites.4.4 -
Accelo
Visit WebsiteThis is an aggregated rating for this tool including ratings from Crozdesk users and ratings from other sites.4.4 -
Wrike
Visit WebsiteThis is an aggregated rating for this tool including ratings from Crozdesk users and ratings from other sites.4.3


Best ThoughtSpot Alternatives Reviews
Below are my detailed summaries of the best ThoughtSpot alternatives that made it onto my shortlist. My reviews offer a detailed look at the features, integrations, and best use cases of each reporting platform to help you find the best one for you.

Klipfolio is a cloud-based analytics platform for teams that want to centralize metrics and visualize data from multiple sources. It’s popular with marketing, sales, and operations teams who need fast access to ready-made dashboards and shareable insights.
Who Is Klipfolio Best For?
Marketing, sales, and operations teams at small to mid-sized businesses who need rapid, pre-built data visualizations and centralized dashboards.
Why Klipfolio Is A Good ThoughtSpot Alternative
I picked Klipfolio because its pre-built Klip library gives teams a concrete starting point instead of a blank canvas. When I'm setting up a new marketing or sales dashboard, I can pull a pre-built Klip for metrics like Google Ads spend or monthly revenue and have something meaningful live within minutes.
I also like the Klip Editor, which uses Excel-like formulas to let analysts transform and filter data without writing SQL. In practice, that means my team can build and share polished, real-time dashboards across departments without relying on a data engineering pipeline.
Klipfolio Key Features
- Dashboard sharing: Publish dashboards as public URLs or embed them in external platforms for stakeholder reporting.
- Data source connections: Pull live data from spreadsheets, databases, and APIs into a single workspace.
- Scheduled data refresh: Set automatic data refresh intervals to keep dashboards current without manual updates.
- PowerMetrics: Define and track business metrics centrally so every team references the same numbers.
Klipfolio Integrations
Klipfolio offers 100+ native integrations, including Google Analytics, Salesforce, HubSpot, Shopify, Xero, QuickBooks, Google Sheets, Facebook Ads, SQL databases, Mailchimp, and Zapier. An API is available for custom integrations.
Pros and Cons
Pros:
- Embeddable dashboards for public or private use
- Custom metrics creation via PowerMetrics
- Real-time data sync with multiple sources
Cons:
- Limited ad hoc querying for non-technical users
- No advanced natural language query support
Tableau is an analytics platform for professionals who want to transform complex data into interactive, visual dashboards. It’s especially well suited for teams in finance, operations, and analytics who need to present real-time data insights to business stakeholders.
Who Is Tableau Best For?
Data analysts and business intelligence teams in large organizations who need to deliver custom, interactive dashboards for leadership and stakeholders.
Why Tableau Is A Good ThoughtSpot Alternative
I picked Tableau because its drag-and-drop canvas lets my team go from raw data to a fully interactive dashboard without writing a single line of code. I specifically like how Marks cards give precise control over color, size, shape, and detail on any visualization—something I haven't found this granular in most alternatives.
Tableau's dashboard Actions feature lets me wire up filters, highlights, and URL navigation between sheets so stakeholders can explore the data themselves. In practice, that means I can hand off a finished dashboard and trust that leadership can answer their own follow-up questions.
Tableau Key Features
- Calculated fields: Create custom metrics and formulas directly within your data source without modifying the underlying dataset.
- Story points: Build guided, slide-by-slide data narratives that walk stakeholders through key findings in sequence.
- Ask Data: Type natural language questions about your dataset and get automatic visualizations generated in response.
- Data extract scheduling: Set automated refresh schedules to pull updated data from connected sources on a defined cadence.
Tableau Integrations
Tableau offers native integrations with Salesforce, Google Sheets, Microsoft Excel, Amazon Redshift, Snowflake, Oracle, Microsoft SQL Server, SAP, Google BigQuery, and Databricks, with an API available for custom integrations.
Pros and Cons
Pros:
- Advanced geospatial visualization tools
- Extensive governance controls
- Broad support for real-time data connectors
Cons:
- Desktop client required for some authoring
- Data blending can require data prep

Databox brings automated reporting to teams who want to monitor KPIs from multiple sources in real time. It’s a good fit for marketing and sales leaders who need unified dashboard views and custom performance snapshots without coding.
Who Is Databox Best For?
Marketing and sales teams at mid-sized companies who want an automated way to visualize and share business KPIs across departments.
Why Databox Is A Good ThoughtSpot Alternative
I picked Databox because it automates the reporting work that usually falls on someone to build each week manually. I particularly like the Scorecards feature, which delivers scheduled KPI summaries directly to stakeholders via email or Slack so leadership always has a current view without logging into a dashboard.
My team also uses the Goals feature to set targets against live metrics, which makes it easy to surface progress during reviews without pulling data from multiple sources. In practice, that means I can spend less time assembling reports and more time discussing what the numbers actually mean.
Databox Key Features
- No-code dashboard builder: Drag and drop metrics onto fully customizable dashboards without writing any code.
- Anomaly detection: Databox flags when a metric deviates from its typical performance pattern so you can act before it becomes a bigger issue.
- Performance forecasting: See projected best- and worst-case scenarios for any metric based on historical trend data.
- Data Stories: Embed dynamic elements like live metrics, time periods, and percentage changes directly into report text.
Databox Integrations
Databox offers 130+ native integrations, including Google Analytics, HubSpot, Salesforce, Google Ads, Mailchimp, Shopify, QuickBooks, Freshdesk, and Stripe. Zapier and an API are available for additional integrations.
Pros and Cons
Pros:
- No-code drag-and-drop dashboard builder
- Mobile app for on-the-go dashboard access
- Real-time dashboards with automatic data syncing
Cons:
- No relational data modeling like ThoughtSpot
- White-labeling requires higher-priced plans

Domo is a cloud-native analytics platform built for teams who need to unify and analyze data from hundreds of SaaS and business apps. I think it’s a good fit for fast-growing companies that want to empower business users to create dashboards and automate reporting workflows without IT bottlenecks.
Who Is Domo Best For?
Business operations and IT teams at enterprise or mid-market companies that need to centralize and automate cloud-based data analytics.
Why Domo Is A Good ThoughtSpot Alternative
I picked Domo for its connector library, which includes 1,000+ pre-built connectors to cloud apps like Salesforce, Slack, Google Analytics, and Facebook Ads—pulling live data without custom ETL pipelines. What I find especially useful is Domo's Beast Mode feature, which lets me create calculated fields directly on top of connected datasets without altering the source data.
In practice, that means my team can layer in custom metrics specific to our reporting needs and share them across dashboards instantly. Domo also has a mobile-first design, so stakeholders can access live dashboards on any device without losing interactivity.
Domo Key Features
- Data lineage tracking: Trace how data flows from its source through transformations to the final dashboard output.
- Scheduled report delivery: Automatically send dashboard snapshots to stakeholders via email on a defined schedule.
- Card-based dashboard builder: Assemble dashboards using individual visualization cards that can be filtered and customized per user.
- Domo Everywhere: Embed live Domo dashboards and data experiences directly into external websites or customer-facing products.
Domo Integrations
Domo offers native integrations with Salesforce, Google Analytics, Amazon Redshift, Snowflake, QuickBooks, Box, Microsoft 365, Shopify, Adobe Analytics, and Zendesk.
Pros and Cons
Pros:
- In-app collaboration features for teams
- Advanced data permission and governance tools
- Extensive library of cloud data connectors
Cons:
- Custom ETL can still require developer help
- Limited AI-driven insights

Sisense is a data analytics platform built for product and engineering teams who need to embed analytics directly into their apps or workflows. If you want to control the full data experience for your users, this platform gives you end-to-end tools for customized analytics delivery.
Who Is Sisense Best For?
Mid-sized and enterprise product teams building analytics into B2B SaaS, IoT, or vertical software platforms.
Why Sisense Is A Good ThoughtSpot Alternative
I picked Sisense specifically for teams that need to embed analytics directly into their own products. The Compose SDK is the standout tool here—it's a developer toolkit that lets you build and embed analytics in a code-first, modular way using React, Angular, Vue, or TypeScript, without relying on pre-built dashboards.
I also appreciate that Sisense.JS gives my team granular control over individual widgets and filters, letting us match the look and feel of our app exactly. White-label theming, role-based access, and multi-tenant architecture mean we can deploy it to customers without exposing data across accounts.
Sisense Key Features
- Natural language query: Ask questions in plain language using the built-in assistant and get visualizations without writing a single line of code.
- Data modeling tool: Blend and model data from multiple sources directly in the platform, without needing a dedicated data engineering team.
- 400+ data connectors: Connect to over 400 data sources, with options to consolidate data inside Sisense or maintain a live connection to your warehouse.
- MCP server connectivity: Connect external AI tools to your governed Sisense data models via the MCP server for cross-platform AI-driven analytics.
Sisense Integrations
Sisense offers native integrations with Salesforce, Snowflake, Google BigQuery, Amazon Redshift, Azure Synapse, PostgreSQL, MongoDB, Oracle, SAP HANA, Microsoft SQL Server, and REST API for custom integrations.
Pros and Cons
Pros:
- Native multi-tenant support for end-user isolation
- Granular permission control at the data layer
- White-label capabilities for embedded analytics
Cons:
- Complex setup for initial data modeling
- Pricing requires direct negotiation with sales

Sigma is a cloud analytics platform designed for teams who prefer a spreadsheet-style interface for advanced data exploration. It’s an appealing option for analysts and business users who want direct access to governed cloud data without relying on SQL.
Who Is Sigma Best For?
Data analysts and business teams in mid-sized and enterprise organizations seeking spreadsheet-style analytics directly on cloud data warehouses.
Why Sigma Is A Good ThoughtSpot Alternative
I picked Sigma because it lets analysts work directly on live cloud warehouse data using a familiar spreadsheet interface, which removes the bottleneck of waiting on BI developers to build views. My team uses Sigma's workbook model to explore millions of rows in real time without writing SQL, which makes ad hoc data analysis much faster.
I also appreciate the embedded analytics capability, which lets us publish interactive data experiences directly into internal tools and customer-facing products. In practice, that means my team can give stakeholders direct access to live data without rebuilding dashboards in a separate reporting layer.
Sigma Key Features
- Input tables: Create and write data back to your warehouse directly from a Sigma workbook.
- Version control: Track changes to workbooks and restore previous versions without leaving the platform.
- Custom visualizations: Build charts and pivot tables on top of live warehouse data using a drag-and-drop interface.
- Row-level security: Control data access at the user level without duplicating datasets or managing separate permission sets.
Sigma Integrations
Sigma offers native integrations with Google Cloud, Snowflake, Databricks, and Azure.
Pros and Cons
Pros:
- Row-level data security and governance
- Workbook version control for auditing
- Spreadsheet UI for direct data exploration
Cons:
- No on-premises data source support
- Requires strong data warehouse infrastructure
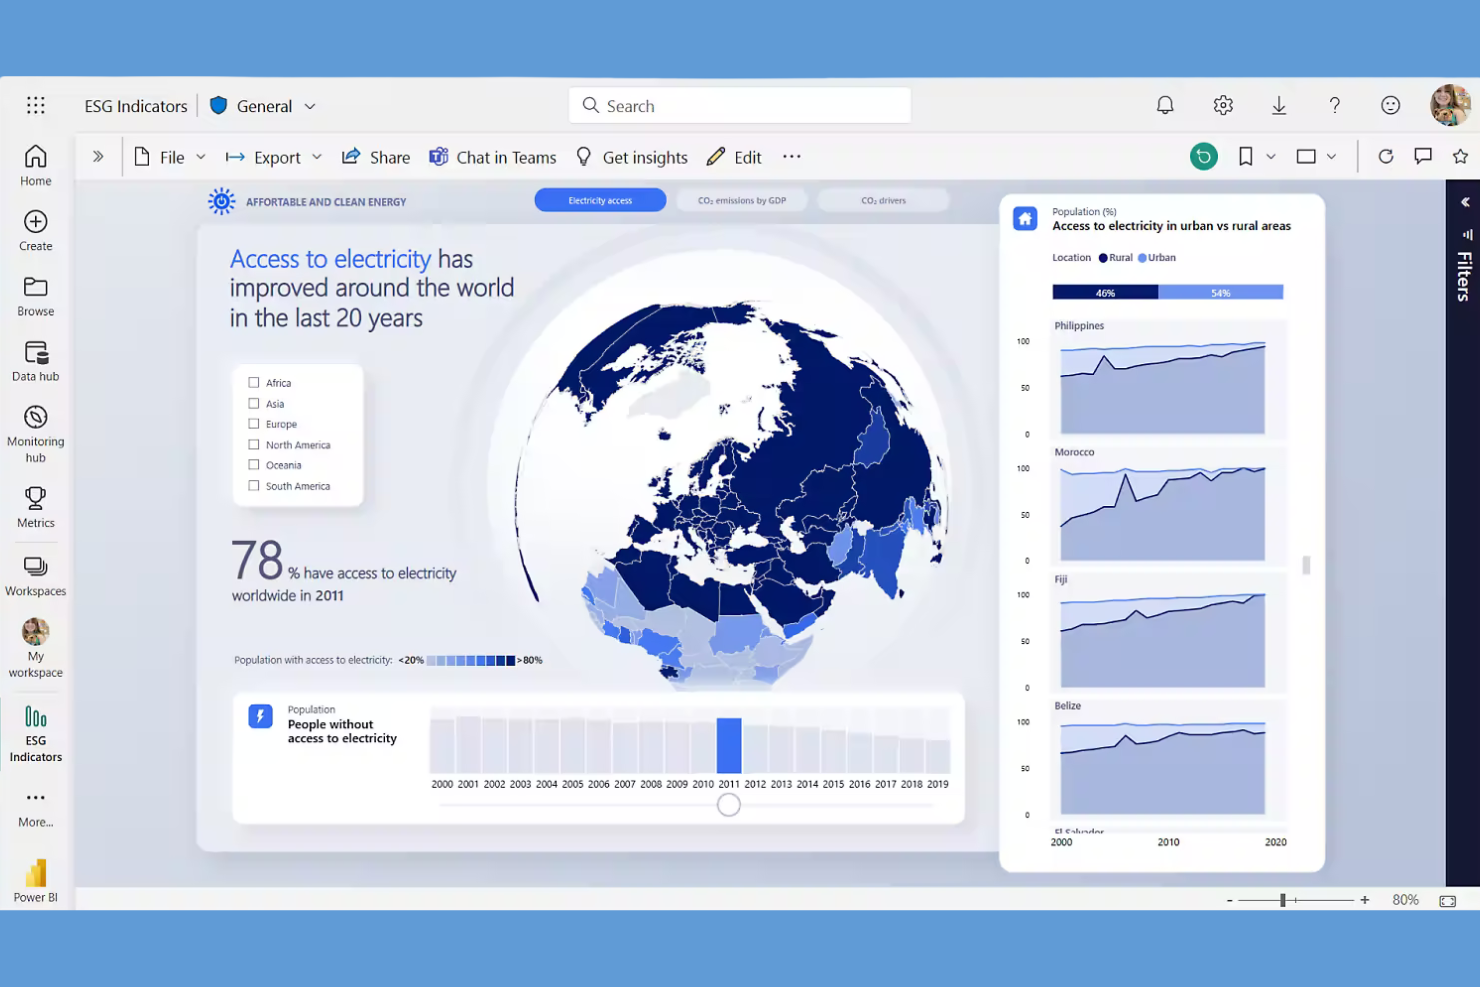
Power BI stands out for teams who need real-time dashboards and quick connections to data across their organization. If you work heavily in the Microsoft ecosystem, this platform helps you turn sprawling business data into actionable reports without a steep setup.
Who Is Power BI Best For?
Managers and analysts at companies using Microsoft 365 who want business-wide data visualization and reporting.
Why Power BI Is A Good ThoughtSpot Alternative
I picked Power BI for this list because of how naturally it fits into a Microsoft 365 environment. My team uses Power BI to pull live data directly from Excel, SharePoint, and Teams, then builds reports without ever leaving the Microsoft ecosystem. I particularly like the DirectQuery feature, which lets us connect to live data sources so our dashboards always reflect current numbers.
In practice, that means my team can skip the manual data exports that ThoughtSpot sometimes requires and go straight to building shareable, interactive reports.
Power BI Key Features
- Natural language Q&A: Ask questions about your data in plain English and get instant visualizations without writing queries.
- Custom dashboards: Build and arrange interactive visuals, KPIs, and charts in a single view tailored to your reporting needs.
- Row-level security: Control which users can access specific data within a shared report based on defined roles.
- Paginated reports: Create printer-ready, pixel-perfect reports designed for structured, multi-page data output.
Power BI Integrations
Power BI has native integrations across the Microsoft ecosystem, including Microsoft 365 and Azure. You can connect it to data sources like Microsoft Access, SharePoint, SQL Server, Exchange Server, and Microsoft Entra ID. An API is available for custom integrations.
Pros and Cons
Pros:
- Power BI Service enables cloud sharing
- Live data connection with DirectQuery support
- Deeply integrates with Microsoft 365 tools
Cons:
- Customization limited outside Microsoft products
- Performance slows with large datasets

Apache Superset is an open-source BI platform aimed at data teams and engineers who want more flexibility in designing and sharing dashboards. If you need complete control over custom visualizations and a no-cost solution for business intelligence, Superset is a strong option.
Who Is Apache Superset Best For?
Data engineers and analytics teams at organizations that want open-source BI tools with rich customization and self-hosting options.
Why Apache Superset Is a Good ThoughtSpot Alternative
I picked Apache Superset because the open-source model gives my team complete control over how we build, deploy, and extend our analytics environment. I appreciate that Superset supports over 40 chart types, and I can create entirely custom visualizations using the plugin framework—something most hosted BI tools simply won't allow.
My team also uses the SQL Lab feature to write and run queries directly against our connected databases, which keeps exploratory analysis close to the data without routing through a proprietary layer. For teams self-hosting on their own infrastructure, that flexibility is hard to match.
Apache Superset Key Features
- Row-level security: Restrict data access by user role directly within dashboards.
- Native database connectivity: Connect to dozens of SQL-speaking databases, including PostgreSQL, MySQL, BigQuery, and Snowflake.
- Dashboard filter controls: Add interactive cross-filter controls that let viewers slice data across multiple charts simultaneously.
- Embedded analytics: Embed dashboards into external applications using Superset's built-in embedding support.
Apache Superset Integrations
Apache Superset offers native integrations with PostgreSQL, MySQL, Google BigQuery, Snowflake, Presto, Amazon Redshift, Apache Druid, Apache Hive, and Microsoft SQL Server. An API is available for custom integrations.
Pros and Cons
Pros:
- Active open-source community for support
- Extensive SQL-based data querying options
- Complete control over self-hosted deployments
Cons:
- No official managed cloud hosting available
- Requires manual setup and maintenance effort

Qlik Cloud Analytics is a reporting and analytics platform designed for teams and enterprises that want more dynamic data discovery than traditional dashboards offer. It’s well-suited to analysts and leaders who need answers from large or complex data sets without bottlenecks.
Who Is Qlik Cloud Analytics Best For?
Data analysts and business intelligence teams at midsize to large enterprises who need robust self-service exploration across multiple data sources.
Why Qlik Cloud Analytics Is A Good ThoughtSpot Alternative
I picked Qlik Cloud Analytics because of its associative analytics engine, which sets it apart from most ThoughtSpot alternatives. Unlike query-based tools, Qlik's engine tracks relationships across every data point simultaneously—so when I click on a value in one chart, every other visualization updates to show what's associated and what's excluded.
That level of interactivity surfaces patterns that a standard search or dashboard approach would miss. I also appreciate the built-in predictive analytics, which lets my team build and deploy machine learning models without writing code.
Qlik Cloud Analytics Key Features
- Augmented analytics: Qlik's AI engine automatically surfaces insights and anomalies from your data.
- Multi-cloud data connectivity: Connect to data warehouses, databases, and SaaS sources without manual data exports.
- Collaborative analytics spaces: Share and co-develop apps and reports within organized team workspaces.
- No-code data preparation: Transform, combine, and clean data sources directly inside the platform.
Qlik Cloud Analytics Integrations
Qlik Cloud Analytics offers native integrations with Salesforce, Snowflake, Databricks, Google BigQuery, Amazon Redshift, Microsoft SQL Server, Oracle Database, SAP, and connects to data sources across the Microsoft ecosystem, including Microsoft 365 and Azure. An API is available for custom integrations.
Pros and Cons
Pros:
- Broad enterprise data source connectivity
- Strong multi-cloud and hybrid deployment options
- Supports real-time data refresh from sources
Cons:
- Custom visualizations require advanced setup
- High entry-level pricing for small teams

Zenlytic is an AI-powered analytics platform built for business teams who want to ask questions in natural language and get instant data answers. If you're looking to empower non-technical users with self-serve reporting, Zenlytic makes live data insights accessible to everyone.
Who Is Zenlytic Best For?
Teams in ecommerce or consumer brands that want direct access to data answers without relying on technical analysts.
Why Zenlytic Is A Good ThoughtSpot Alternative
I picked Zenlytic specifically because the AI isn't bolted onto a traditional BI tool—it's the foundation the entire platform is built around. Zoë, Zenlytic's AI analyst, understands business context through a semantic layer that learns your metric definitions as your team asks questions. That means when I ask a follow-up question like "why did that drop last Tuesday?", Zoë retains the context from the previous query and doesn't start from scratch. I also appreciate the Clarity Engine, which maps every query to a governed semantic layer to eliminate hallucinations—something most AI analytics tools still struggle with. For teams where data trust is non-negotiable, that's a meaningful differentiator.
Zenlytic Key Features
- Dynamic dashboards: Slice, pivot, and drill into live data directly within any dashboard view.
- Row- and column-level access permissions: Control exactly which users can see which data fields or records.
- dbt integration: Connect Zenlytic directly to your existing dbt project to keep metric definitions in sync.
- Scheduled dashboard delivery: Set up dashboards to be sent automatically to stakeholders on a recurring schedule.
Zenlytic Integrations
Zenlytic offers native integrations with Snowflake, Google BigQuery, Amazon Redshift, and Google Sheets. An API is available for custom integrations.
Pros and Cons
Pros:
- Query transparency with full SQL traceability
- Semantic layer maintains business metric definitions
- AI answers follow-up questions contextually
Cons:
- Limited self-service dashboard customization
- Advanced setup often requires SQL knowledge
Other ThoughtSpot Alternatives
Here are some additional ThoughtSpot alternative options that didn’t make it onto my shortlist, but are still worth checking out:
- Embeddable
For low-code analytics for SaaS platforms
- BlazeSQL
For direct SQL querying for fast reports
- GoodData
White-label reporting experiences
- Zoho Analytics
Built-in data preparation suite
- Plecto
Real-time KPI gamification
- Supermetrics
Marketing platform integrations
- Metabase
Open-source analytics simplicity
- Coefficient
For Google Sheets data automation
- Grow
No-code dashboard customization
- Omni
Self-serve query building


ThoughtSpot Alternatives Selection Criteria
When selecting the best ThoughtSpot alternatives to include in this list, I considered common buyer needs and pain points related to business intelligence platforms, like connecting to diverse data sources and enabling teams to build and share interactive dashboards. I also used the following framework to keep my evaluation structured and fair:
Core Functionality (25% of total score)
To be considered for inclusion in this list, each solution had to fulfill these common use cases:
- Connect to multiple data sources
- Build interactive dashboards and reports
- Visualize data with charts and graphs
- Share or export dashboards and reports
- Schedule automated report delivery
Additional Standout Features (25% of total score)
To help further narrow down the competition, I also looked for unique features, such as:
- Natural language query capabilities
- Advanced role-based access controls
- Embedded analytics for third-party apps
- Custom SQL editor or coding support
- White-labeling and branding options
Usability (10% of total score)
To get a sense of the usability of each system, I considered the following:
- Intuitive drag-and-drop interface
- Clear navigation and dashboard organization
- Ease of use for customization of visualizations
- Responsive performance with large datasets
- Minimal clicks to publish or share
Onboarding (10% of total score)
To evaluate the onboarding experience for each platform, I considered the following:
- Detailed setup and migration guides
- Availability of training videos and tutorials
- Interactive product tours and walkthroughs
- Pre-built dashboard and report templates
- Access to onboarding webinars and support
Customer Support (10% of total score)
To assess each software provider’s customer support services, I considered the following:
- Multiple support channels and fast response times
- Knowledgeable support agents
- Help center or documentation
- Community forums or user groups
- Availability of dedicated success managers
Value For Money (10% of total score)
To evaluate the value for money of each platform, I considered the following:
- Transparent and flexible pricing tiers
- Availability of free trial or freemium version
- Inclusions of advanced features in plans
- Cost compared to similar reporting tools
- No hidden fees or surprise charges
Customer Reviews (10% of total score)
To get a sense of overall customer satisfaction, I considered the following when reading customer reviews:
- Consistent positive feedback on performance
- High marks for reliability and uptime
- Reports of successful problem resolution
- Praise for the product’s continued improvements
- User comments on ease of learning and use
Why Look For A ThoughtSpot Alternative?
While ThoughtSpot is a good choice of reporting tools, there are a number of reasons why some users seek out alternative solutions. If you want to elevate your overall analytics experience and empower your team to make data-driven decisions for complex data processing, you might be looking for a ThoughtSpot alternative because…
- You need open-source or self-hosted deployment options
- Your team relies heavily on custom SQL or scripting
- The licensing costs exceed your current budget
- Your business requires advanced data integration capabilities
- You want a wider variety of visualization options
- You operate in regions with limited support availability
If any of these sound like you, you’ve come to the right place to help your organization make informed decisions. My list contains several reporting tools options that are better suited for teams facing these challenges with ThoughtSpot and looking for alternative solutions.
ThoughtSpot Key Features
Here are some of the key features of ThoughtSpot to help you contrast and compare what alternative solutions offer:
- Search-driven analytics: ThoughtSpot lets users type plain-language queries to generate analytics and reports instantly, making self-service data exploration accessible to non-technical users.
- AI-powered insights: The platform surfaces trends, anomalies, and automated insights using built-in AI and machine learning algorithms, helping users proactively spot relevant patterns in their data. For organizations requiring deep statistical modeling, these advanced analytics are crucial.
- Live analytics on cloud data: ThoughtSpot connects directly to leading cloud data warehouses like Snowflake, Google BigQuery, and Amazon Redshift, allowing users to run queries on up-to-date data without needing to manage data extracts. Alternative platforms like Qlik Sense also offer powerful associative engines to handle live data query optimization.
- Interactive dashboards: Users can build interactive, real-time dashboards that update automatically as data changes, with the ability to customize layouts, drill into metrics, and share views across teams.
- Collaborative sharing: ThoughtSpot enables users to share live analytics, dashboard snapshots, and query results securely with colleagues, fostering teamwork and aligning decision-making from a single source of truth.
- Embedded analytics: The platform’s APIs allow businesses to embed ThoughtSpot analytics and visualizations within web apps, products, or portals, extending analytics to customers and partners.
- Advanced security controls: Granular role-based access management ensures sensitive data is protected and only accessible by authorized users, supporting enterprise-scale governance needs.
- Mobile access: ThoughtSpot offers optimized mobile apps for iOS and Android, so users can view dashboards, run searches, and receive alerts on the go.
- Custom data connectors: Connectors for various databases, SaaS services, and business platforms let you integrate ThoughtSpot with a wide variety of data sources for unified analysis. Many teams seek an all-in-one platform that guarantees integration with their existing CRM systems and cloud infrastructure, like AWS data pipelines.
- Scheduled reporting: Users can automate the delivery of reports and dashboard snapshots at set intervals, ensuring stakeholders always have the latest information delivered to their inbox or preferred channels.