Databox Review: Key Features, Pros, Cons, and Updated Pricing for 2026


Databox is a marketing agency reporting software designed to help project managers centralize client data, automate reporting, and visualize performance metrics in real time. If you’re struggling with scattered analytics, manual report creation, or inconsistent client updates, Databox offers a unified platform to connect your marketing tools and present clear, actionable dashboards.
In this review, you’ll find a detailed look at Databox’s features, best and worst use cases, pros and cons, and current pricing—so you can decide if it fits your agency’s reporting needs.
Databox Evaluation Summary
- From $64/month (billed annually)
- Free plan + free trial + free demo available
Why You Can Trust Us
We’ve been testing and reviewing project management software since 2012. As project managers ourselves, we know how critical and difficult it is to make the right decision when selecting software.
We invest in deep research to help our audience make better software purchasing decisions. We’ve tested more than 2,000 tools for different project management use cases and written over 1,000 comprehensive software reviews. Learn how we stay transparent & our software review methodology.
Databox Overview
When judging Databox as a marketing agency reporting software, its visual dashboards, wide integration library, and robust functionality makes it a strong choice for agencies prioritizing quick setup and client-facing reports. Pricing is competitive for small to midsize teams, and onboarding is straightforward.
However, users needing highly granular data modeling or advanced custom metrics may find its capabilities limited compared to some alternatives. Databox is best suited for agencies that value ease of use, fast deployment, and clear, shareable insights over deep technical customization. For example, teams managing multiple client accounts will appreciate its automated reporting and scheduled updates.
pros
-
Real-time dashboards update automatically with connected data sources
-
Scheduled reporting automates recurring client report delivery
-
Prebuilt templates simplify setup for common marketing metrics
cons
-
Custom calculated metrics are limited compared to some competitors
-
Historical data retention is restricted on lower pricing tiers
-
Advanced white-labeling options require higher-tier plans
-

Celoxis
Visit WebsiteThis is an aggregated rating for this tool including ratings from Crozdesk users and ratings from other sites.4.4 -
Smartsheet
Visit WebsiteThis is an aggregated rating for this tool including ratings from Crozdesk users and ratings from other sites.4.5 -
Accelo
Visit WebsiteThis is an aggregated rating for this tool including ratings from Crozdesk users and ratings from other sites.4.4


Our Review Methodology
How We Test & Score Tools
We’ve spent years building, refining, and improving our software testing and scoring system. The rubric is designed to capture the nuances of software selection and what makes a tool effective, focusing on critical aspects of the decision-making process.
Below, you can see exactly how our testing and scoring works across seven criteria. It allows us to provide an unbiased evaluation of the software based on core functionality, standout features, ease of use, onboarding, customer support, integrations, customer reviews, and value for money.
Core Functionality (25% of final scoring)
The starting point of our evaluation is always the core functionality of the tool. Does it have the basic features and functions that a user would expect to see? Are any of those core features locked to higher-tiered pricing plans? At its core, we expect a tool to stand up against the baseline capabilities of its competitors.
Standout Features (25% of final scoring)
Next, we evaluate uncommon standout features that go above and beyond the core functionality typically found in tools of its kind. A high score reflects specialized or unique features that make the product faster, more efficient, or offer additional value to the user.
We also evaluate how easy it is to integrate with other tools typically found in the tech stack to expand the functionality and utility of the software. Tools offering plentiful native integrations, 3rd party connections, and API access to build custom integrations score best.
Ease of Use (10% of final scoring)
We consider how quick and easy it is to execute the tasks defined in the core functionality using the tool. High scoring software is well designed, intuitive to use, offers mobile apps, provides templates, and makes relatively complex tasks seem simple.
Onboarding (10% of final scoring)
We know how important rapid team adoption is for a new platform, so we evaluate how easy it is to learn and use a tool with minimal training. We evaluate how quickly a team member can get set up and start using the tool with no experience. High scoring solutions indicate little or no support is required.
Customer Support (10% of final scoring)
We review how quick and easy it is to get unstuck and find help by phone, live chat, or knowledge base. Tools and companies that provide real-time support score best, while chatbots score worst.
Customer Reviews (10% of final scoring)
Beyond our own testing and evaluation, we consider the net promoter score from current and past customers. We review their likelihood, given the option, to choose the tool again for the core functionality. A high scoring software reflects a high net promoter score from current or past customers.
Value for Money (10% of final scoring)
Lastly, in consideration of all the other criteria, we review the average price of entry level plans against the core features and consider the value of the other evaluation criteria. Software that delivers more, for less, will score higher.
Core Features
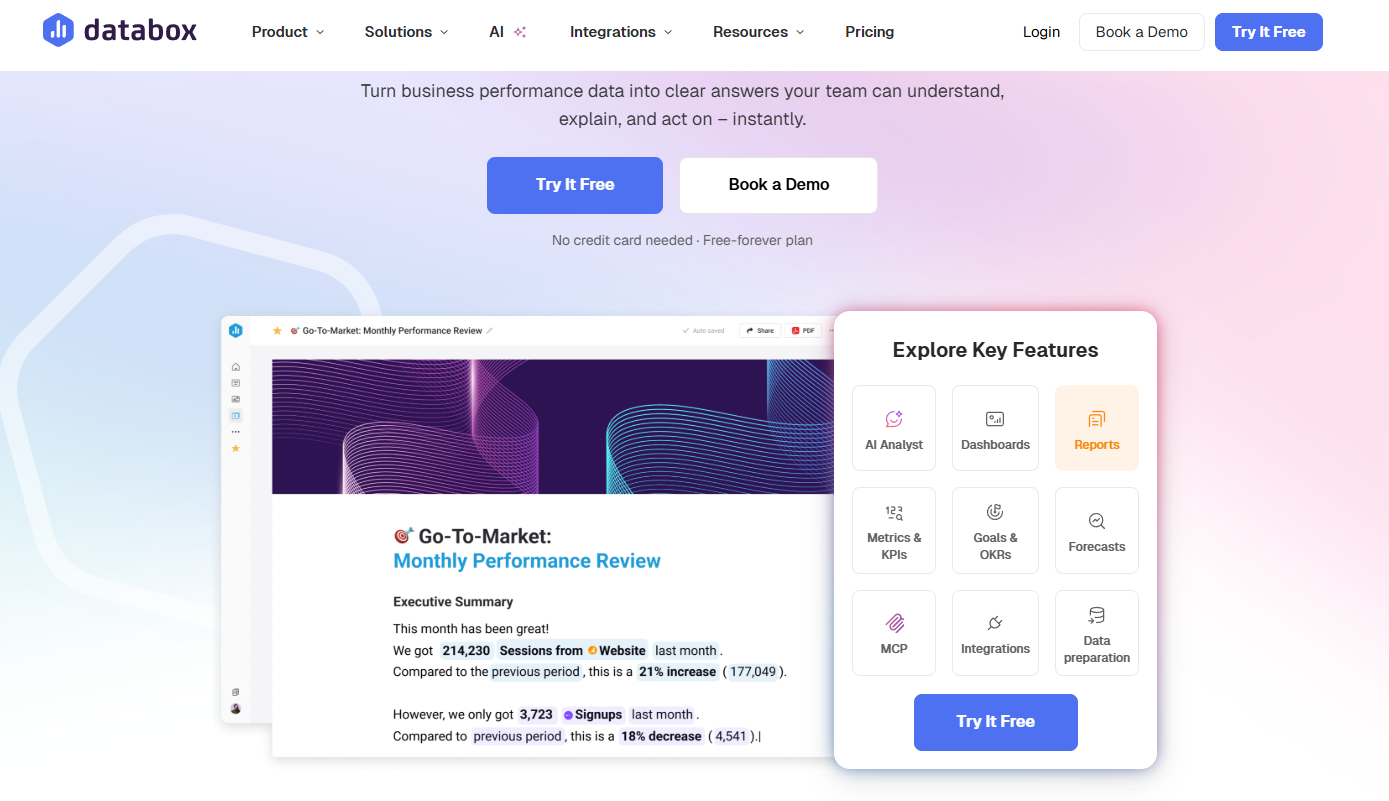
Real-Time Custom Dashboards
Visualize live marketing data from multiple sources in one place. Dashboards update automatically, so teams always see the latest results.
Scheduled Reporting
Automate recurring client reports with custom delivery schedules. Reports can be sent via email or shared as live links.
Prebuilt Templates
Choose from a library of templates for common marketing KPIs. Templates help agencies launch new client reports quickly.
Custom Metrics Builder
Create calculated metrics using data from connected sources. This allows teams to track unique KPIs specific to each client.
Goal Tracking
Set, monitor, and visualize progress toward marketing goals directly in dashboards. Teams can see how campaigns are performing against targets in real time.
Data Snapshots and Annotations
Capture and comment on specific data points within dashboards. This helps teams highlight trends or explain changes to clients.

Ease of Use
Databox is widely recognized for its clean interface and intuitive dashboard setup, making it approachable for both technical and non-technical users. Most users highlight the drag-and-drop dashboard builder and prebuilt templates as time-savers, especially during onboarding.
The platform’s guided setup and in-app tips help agencies get client reports running quickly. However, some users note that building complex custom metrics can require extra support or documentation. Overall, Databox prioritizes simplicity without sacrificing essential reporting features — as opposed to other analytics tools that usually have a learning curve.

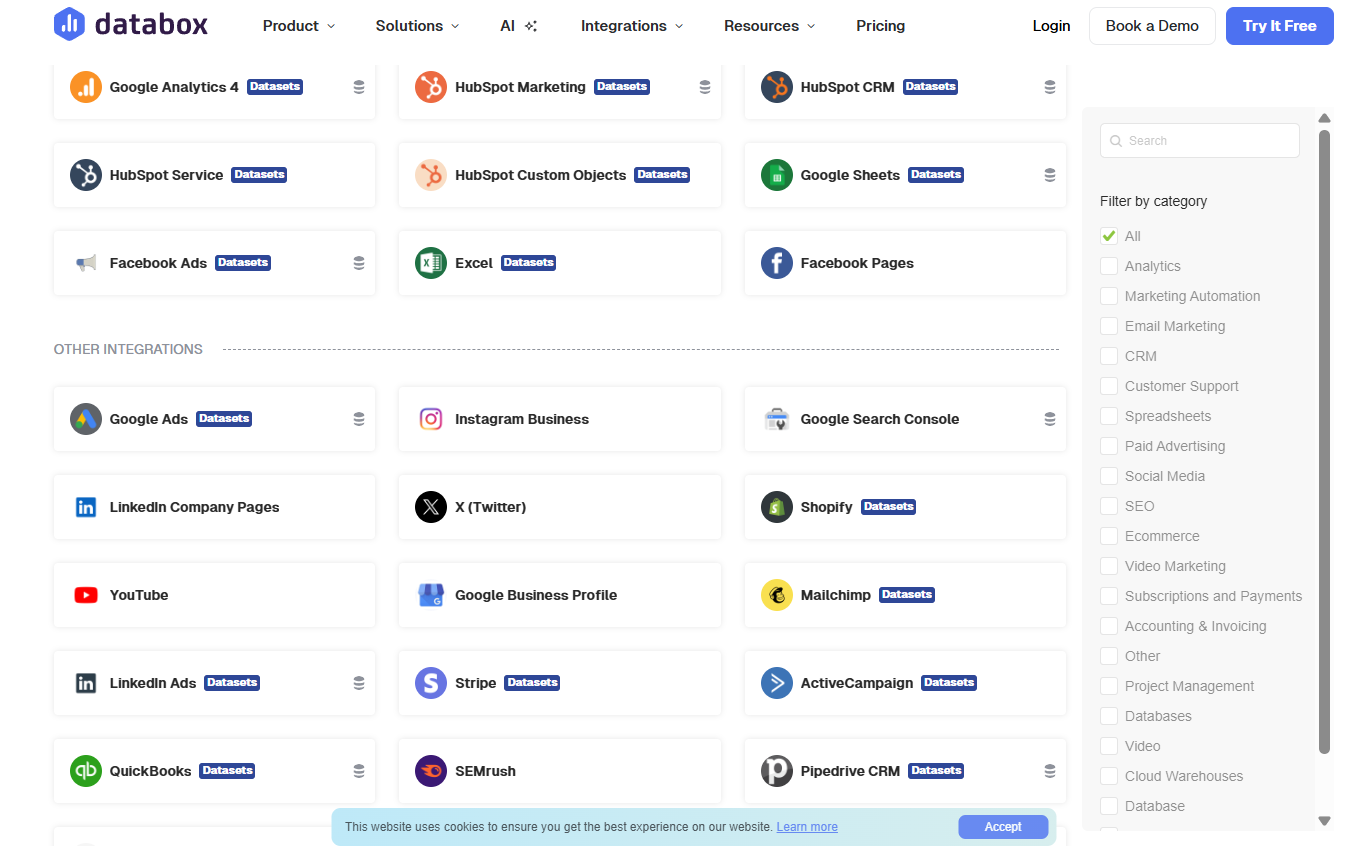
Integrations
Databox integrates with Google Analytics, HubSpot, Google Ads, Salesforce, Shopify, Mailchimp, LinkedIn Ads, SEMrush, and Pipedrive, among others.
Databox also offers an API and connects with third-party integration tools like Zapier for additional data sources.
Databox Specs
- 2-Factor Authentication
- A/B Testing
- Analytics
- API
- BitCoin
- Conversion Tracking
- Dashboard
- Data Export
- Data Import
- Data Visualization
- Design Templates
- External Integrations
- Inventory Tracking
- Keyword Tracking
- Marketing Automation
- Multi-User
- Notifications
- Order Management
- Payment Gateway Integration
- Payment Processor
- PayPal
- Product Catalog
- Review Monitoring
- SAP Integration
- Scheduling
- Stripe
- Third-Party Plugins/Add-Ons