10 Best AI Reporting Tools Reviewed in 2026

Best AI Reporting Tools Shortlist


Project reporting is time-consuming, detail-heavy, and leaves no room for errors. Having constant data to analyze, decisions to make, and presentations to create begs for a tool that simplifies your work, not adds to the chaos. That's where AI reporting tools come in. These tools leverage the power of artificial intelligence to help you and your team make sense of complex data, offering insights that drive better decisions.
I've spent time reviewing various AI reporting tools to provide you with unbiased, well-researched picks. In my experience, these tools can make a real difference in your day-to-day work.
In this article, I'll share my top recommendations for AI reporting tools. You'll find out what sets each one apart and how they can fit into your workflow. Let's dive into solutions that can help you manage your projects more efficiently.
Why You Can Trust Us
We’ve been testing and reviewing project management software since 2012. As project managers ourselves, we know how critical and difficult it is to make the right decision when selecting software.
We invest in deep research to help our audience make better software purchasing decisions. We’ve tested more than 2,000 tools for different project management use cases and written over 1,000 comprehensive software reviews. Learn how we stay transparent & our software review methodology.
Best AI Reporting Tools Summary
This comparison chart summarizes pricing details for my top AI reporting tools selections to help you find the best one for your budget and business needs.
| Tool | Best For | Trial Info | Price | ||
|---|---|---|---|---|---|
| 1 | Best with retroactive data transformation | Free trial + free demo available | Pricing upon request | Website | |
| 2 | Best for custom dashboards | 14-day free trial + free demo available | From $44/month (billed annually) | Website | |
| 3 | Best for real-time insights | 14-day free trial | From $120/month (billed annually) | Website | |
| 4 | Best for SEO tracking | 14-day free trial | From $20/client/month (billed annually) | Website | |
| 5 | Best for interactive dashboards | Free plan available | From $15/user/month (billed annually) | Website | |
| 6 | Best for data visualization | 30-day free trial + free demo available | From $300/month (billed annually) | Website | |
| 7 | Best for marketing reports | Free plan available | From $229/month (billed annually) | Website | |
| 8 | Best for team collaboration | 30-day free trial + free demo available | Pricing upon request | Website | |
| 9 | Best for Microsoft integration | Free trial + free plan available | From $14/user/month (billed annually) | Website | |
| 10 | Best for automated reporting | Free demo available | Pricing upon request | Website |
-

Accelo
Visit WebsiteThis is an aggregated rating for this tool including ratings from Crozdesk users and ratings from other sites.4.4 -
Celoxis
Visit WebsiteThis is an aggregated rating for this tool including ratings from Crozdesk users and ratings from other sites.4.4 -
Wrike
Visit WebsiteThis is an aggregated rating for this tool including ratings from Crozdesk users and ratings from other sites.4.3


Best AI Reporting Tool Reviews
Below are my detailed summaries of the best AI reporting tools that made it onto my shortlist. My reviews offer a detailed look at the key features, pros & cons, integrations, and ideal use cases of each tool to help you find the best one for you.
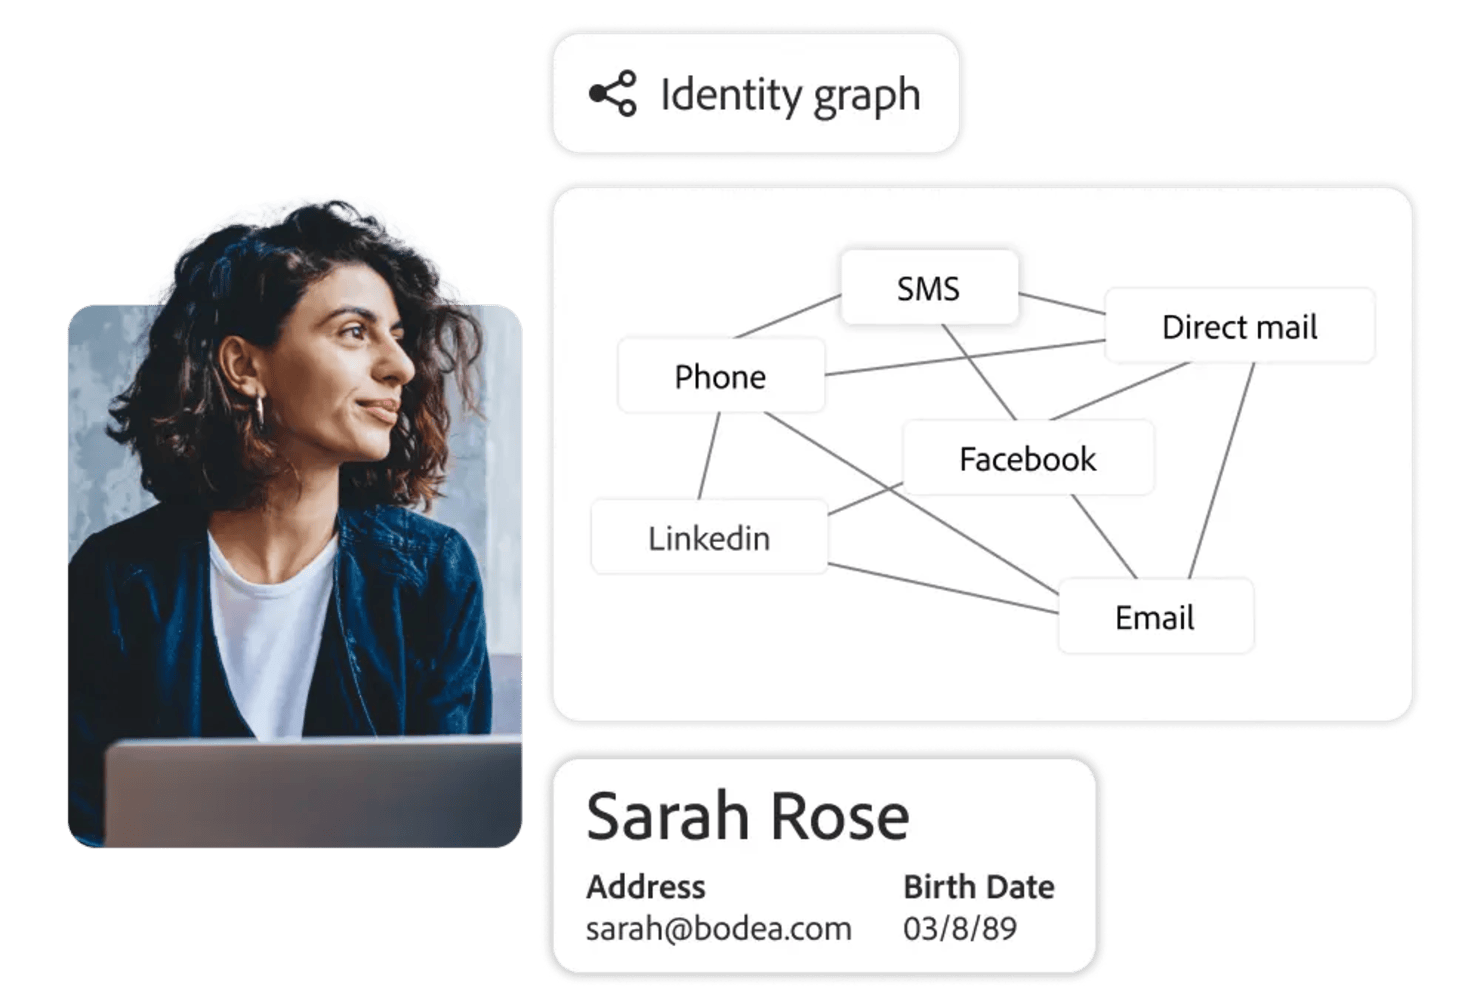
Adobe Customer Journey Analytics is an AI-powered analytics platform for tracking, visualizing, and reporting on customer journeys across multiple channels and data sources.
Who Is Adobe Customer Journey Analytics Best For?
Enterprise analytics teams in retail, finance, or media who need to unify and analyze customer data from multiple digital channels.
Why I Picked Adobe Customer Journey Analytics
I picked Adobe Customer Journey Analytics as one of the best because I can retroactively transform and reprocess historical data without losing fidelity. My team uses the data model editor to redefine dimensions and metrics after data collection, which lets us answer new business questions as they come up. I also like that we can apply new rules or segmentations to past data, so we’re not locked into decisions made at the time of implementation.
Adobe Customer Journey Analytics Key Features
- AI-powered anomaly detection: Automatically surfaces unexpected trends and outliers in your data.
- Cross-channel data stitching: Combines data from web, mobile, and offline sources into unified customer journeys.
- Custom dashboard builder: Lets you create and share interactive dashboards tailored to your reporting needs.
- Scheduled report delivery: Sends automated reports to stakeholders on a recurring schedule.
Adobe Customer Journey Analytics Integrations
Adobe Customer Journey Analytics offers native integrations with Adobe Experience Platform, Adobe Analytics, Adobe Target, Adobe Audience Manager, and Adobe Campaign. It also provides an API for custom integrations and supports connections to cloud data warehouses like Google BigQuery, Amazon Redshift, and Snowflake.
Pros and Cons
Pros:
- Advanced privacy and consent management controls
- Real-time segmentation updates as data streams in
- Retroactive data transformation for historical analysis
Cons:
- Complex setup for cross-channel data sources
- Limited native integrations outside Adobe ecosystem

DashThis is a reporting tool designed for marketers and agencies who need to create custom dashboards. It helps users consolidate marketing data into one place, making it easier to track performance and share insights with clients.
Why I picked DashThis: DashThis excels at providing AI-powered insights to help you quickly identify marketing wins and issues across your reports and dashboards. You can also create custom dashboards that allow you to present data in a way that suits your specific needs. The tool's drag-and-drop interface makes it easy to build dashboards without needing technical skills. You can automate data updates, ensuring your dashboards always reflect the latest information. DashThis also offers pre-set templates, which can save time for your team.
Standout Features & Integrations
Features include automated data updates that keep your dashboards current, pre-set templates for quick setup, and a drag-and-drop interface for easy customization. You can also schedule reports to be sent to clients automatically. The platform provides a variety of visualization options to suit different reporting needs.
Integrations include Google Analytics, Facebook Ads, Instagram, LinkedIn, Twitter, YouTube, Shopify, Mailchimp, HubSpot, and Google Ads.
Pros and Cons
Pros:
- Scheduled report delivery
- Automated data updates
- Customizable dashboard options
Cons:
- Not ideal for complex data analysis
- Requires learning for new users
- Limited advanced customization
New Product Updates from DashThis

DashThis Launches Shopify Integration in Beta
DashThis’s Shopify integration is now available to all users in beta, adding Shopify metrics, dimensions, and preset widgets to report on ecommerce performance alongside other marketing channels. For more information, visit DashThis's official site.
 .
.
Klips is a dashboard and reporting tool designed for businesses that need to monitor key performance indicators in real-time. It's used by business analysts and managers who require up-to-date data to make informed decisions quickly.
Why I picked Klips: Klips is ideal for real-time insights, offering live dashboards that keep you informed with the latest data. The tool's customizable dashboards let you tailor what metrics you monitor, ensuring they align with your business goals. You can set up alerts to notify your team of any significant changes. Klips also provides a wide range of visualization options to present data effectively.
Standout Features & Integrations
Features include customizable dashboards that let you focus on the metrics that matter most, real-time data updates for immediate insights, and alert notifications for significant changes. The tool offers a variety of visualization options to suit different reporting needs. You can also access historical data for trend analysis.
Integrations include Google Analytics, Salesforce, HubSpot, Dropbox, Mailchimp, QuickBooks, Shopify, Xero, Zendesk, and Twitter.
Pros and Cons
Pros:
- Historical data access
- Wide range of visualizations
- Alert notifications for changes
Cons:
- Limited offline access
- Requires data preparation skills
- Learning curve for new users

AgencyAnalytics is a reporting platform tailored for digital marketing agencies and SEO professionals. It provides tools to track and report on various marketing metrics, enabling users to create comprehensive SEO reports and dashboards.
Why I picked AgencyAnalytics: AgencyAnalytics excels in SEO tracking, offering features that let you monitor keyword rankings and website performance. You can customize dashboards to fit your clients' needs, which is perfect for agencies. The platform's automated report scheduling saves you time by keeping clients updated without manual effort. It also includes white-label options, allowing you to present reports under your brand.
Standout Features & Integrations
Features include customizable dashboards that let you tailor reports to your clients' needs, automated report scheduling to save time, and white-label options for agency branding. The platform also offers detailed SEO tracking tools to monitor keyword rankings and site performance. You can easily create comprehensive reports that combine multiple data sources.
Integrations include Google Analytics, Google Ads, Facebook Ads, Instagram, Twitter, LinkedIn, Mailchimp, Shopify, Moz, and Ahrefs.
Pros and Cons
Pros:
- Automated report scheduling
- Customizable client dashboards
- Strong SEO tracking tools
Cons:
- High cost for small teams
- Not ideal for non-marketing data
- Requires initial setup time

Tableau is a business intelligence tool designed for data visualization and analytics. It's popular among data analysts and business professionals who need to create interactive dashboards and reports. The tool excels in transforming complex data into visual insights, which helps in decision-making processes.
Why I picked Tableau: Tableau offers dynamic and interactive dashboards that make data exploration intuitive. You can drag and drop data to build visualizations without needing complex coding skills. Its ability to connect to various data sources sets it apart, allowing you to pull data from almost anywhere. Tableau's focus on visualization ensures you can create detailed and informative reports that engage your audience.
Standout Features & Integrations
Features include real-time data analytics, customizable dashboards, and a wide range of visualization options. You can easily connect to live data sources, ensuring your reports are always up-to-date. The drag-and-drop interface simplifies the process of creating complex data visualizations.
Integrations include Salesforce, Microsoft Excel, Google Analytics, Amazon Redshift, SQL Server, Oracle, SAP, Hadoop, Dropbox, and Box.
Pros and Cons
Pros:
- Real-time data updates
- Wide range of visual options
- Interactive dashboard creation
Cons:
- High cost for small teams
- Requires data preparation
- Steep learning curve

Qlik is a data analytics platform designed for businesses that need to transform raw data into visual insights. It's popular among data analysts and business intelligence professionals who require powerful visualization tools to enhance decision-making.
Why I picked Qlik: Qlik specializes in data visualization, providing interactive dashboards that allow you to explore data from multiple angles. Its associative data model lets you see connections in your data that might not be obvious otherwise. The tool's drag-and-drop interface simplifies the process of creating complex visualizations. Qlik also offers advanced analytics capabilities that help in uncovering trends and patterns.
Standout Features & Integrations
Features include an associative data engine that helps you discover hidden insights, advanced analytics that enable trend analysis, and a user-friendly interface for building visualizations. The platform supports self-service data exploration, allowing you to dive into data without needing technical expertise. You can also customize dashboards to fit your specific needs.
Integrations include Salesforce, Microsoft Azure, SAP, Oracle, Amazon Redshift, Google BigQuery, Snowflake, Microsoft SQL Server, Dropbox, and Box.
Pros and Cons
Pros:
- Supports self-service exploration
- Associative data model
- Interactive data visualization
Cons:
- Limited offline functionality
- Requires data preparation
- Steep learning curve for beginners

Whatagraph is a reporting tool tailored for marketing teams and agencies that need to create visual data reports. It simplifies data aggregation and presentation, making it easier for marketers to share insights with clients and stakeholders. The tool is designed to turn complex data into easily digestible visual reports.
Why I picked Whatagraph: Whatagraph is ideal for marketing reports due to its ability to pull data from multiple channels into one cohesive report. You can customize templates to fit your branding and reporting needs, which is perfect for agencies. The platform offers automation features that save time by scheduling regular report updates. It also provides white-label options, allowing you to present reports as your own.
Standout Features & Integrations
Features include customizable templates that let you tailor reports to your needs, automated report scheduling to save your team time, and white-label options for agency branding. The drag-and-drop interface makes report creation straightforward. You can also access historical data for trend analysis.
Integrations include Google Analytics, Facebook Ads, Instagram, LinkedIn Ads, Twitter, Shopify, HubSpot, Mailchimp, Google Ads, and YouTube.
Pros and Cons
Pros:
- White-label options for branding
- Automated report scheduling
- Customizable report templates
Cons:
- High cost for small teams
- Not ideal for non-marketing data
- May need tech support for setup

Domo is a cloud-based business intelligence platform that caters to large enterprises and teams needing real-time data analytics. It supports data-driven decision-making by offering a suite of tools for data visualization, reporting, and collaboration.
Why I picked Domo: Domo excels in team collaboration, providing you with tools to share data insights across your organization effortlessly. Its platform allows users to create interactive dashboards that can be accessed from any device, enhancing team communication. Domo's ability to handle vast amounts of data and deliver insights in real-time is beneficial for large teams. It also offers customizable alerts to keep your team informed about critical changes.
Standout Features & Integrations
Features include real-time data updates that keep your team informed, customizable dashboards that cater to specific needs, and mobile access for on-the-go insights. The platform's drag-and-drop interface simplifies dashboard creation. Domo also offers predictive analytics to help you anticipate future trends.
Integrations include Salesforce, Google Analytics, Slack, Shopify, Amazon Redshift, Snowflake, Microsoft Excel, Box, Dropbox, and Twitter.
Pros and Cons
Pros:
- Predictive analytics capabilities
- Custom alerts for changes
- Mobile access for dashboards
Cons:
- Complex for non-technical users
- High cost for smaller teams
- High learning curve for new users

Power BI is a business analytics tool designed for transforming raw data into actionable insights. It's widely used by business analysts and IT professionals who need to create reports and dashboards. The tool is known for its integration with Microsoft products, making it easy for teams already using Microsoft Office.
Why I picked Power BI: Power BI integrates smoothly with Microsoft Office applications, which is ideal if your team relies heavily on tools like Excel and SharePoint. This integration allows you to pull and analyze data directly from these sources without extra steps. Power BI's data modeling capabilities enable you to create detailed reports tailored to your needs. The tool's ability to handle large datasets ensures you can analyze your data efficiently.
Standout Features & Integrations
Features include a user-friendly interface that allows for quick report creation, data visualization options that cater to different analysis needs, and the ability to share insights across your organization. The tool offers a drag-and-drop functionality that simplifies the process of building dashboards. You can also customize your reports to match your specific requirements.
Integrations include Microsoft Excel, SharePoint, SQL Server, Azure, Dynamics 365, Google Analytics, Salesforce, Adobe Analytics, OneDrive, and GitHub.
Pros and Cons
Pros:
- Frequent updates and improvements
- Strong data modeling featuresc
- Handles large datasets
Cons:
- Requires data preparation skills
- Complex for non-technical users
- Requires Microsoft account

Rollstack is a platform that automates the creation and updating of presentations and documents, primarily serving data analysts and business teams. It enhances productivity by connecting to live data sources and offering AI-powered insights, making it suitable for various industries like finance and healthcare.
Why I picked Rollstack: Rollstack excels in automated reporting, saving users substantial time by reducing manual slide creation. It connects to multiple data sources, ensuring your presentations are always up-to-date. The platform's AI capabilities help analyze data for more informed decision-making. It also provides enterprise-grade security to protect your data.
Standout Features & Integrations
Features include live data connectivity that keeps your documents current, AI insights that improve data analysis, and enterprise-grade security to protect sensitive information. Scheduled updates ensure your presentations are always ready when you need them. The platform's user-friendly interface simplifies the reporting process.
Integrations include Tableau, Power BI, Looker, Metabase, Google Sheets, Microsoft Excel, Google Slides, Microsoft PowerPoint, Slack, and Dropbox.
Pros and Cons
Pros:
- Enhances data analysis
- Keeps data live and updated
- Reduces manual slide creation
Cons:
- Not ideal for small datasets
- May need tech support for setup
- Learning curve for beginners
Other AI Reporting Tools
Here are some additional AI reporting tools options that didn’t make it onto my shortlist, but are still worth checking out:
- Zoho Analytics
For small businesses
- Heap
For user behavior analytics
- Venngage
For infographic creation


How I Evaluate AI Reporting Tools
Every tool on this list needs to do more than slap an AI label on basic dashboards—it has to turn raw project data into insights that save PMO leads and delivery managers real hours each week. I split my evaluation into core functionality a tool must have to qualify and differentiating factors that separate good options from great ones.
Core Functionality (Table Stakes For This List)
When I'm selecting tools for my list, I rank each one on a scale from 0 (does not offer the functionality) to 5 (excels in this area) for each core functionality listed below. Then, I calculate the tool's total score into a percentage. Each tool needs to achieve a minimum total score of 65% to be considered for inclusion.
- AI-Generated Report Drafting: I look for tools that auto-draft status reports from live project data, like turning sprint velocity and task completion into a stakeholder-ready weekly summary.
- Predictive Project Analytics: The tool should forecast schedule slippage or budget overruns using historical patterns, not just chart what already happened.
- PM Tool Integration: I check for native connections to tools like Jira, Asana, Monday, or Smartsheet, with real-time or near-real-time data sync rather than manual CSV imports.
- Auto-Refreshing Dashboards: Dashboards should populate and update on their own with relevant PM KPIs like milestone progress, utilization, and delivery health across portfolios.
- Natural Language Querying: I evaluate whether users can ask plain-language questions like "which projects are over budget this quarter?" and get a usable answer or visualization back.
- Risk & Anomaly Flagging: The tool should surface risks proactively, such as detecting resource conflicts or scope creep patterns, rather than relying on manually configured threshold alerts.
Once I have a list of tools that meet this criteria, I consider what sets each platform apart.
Differentiating Factors (What Sets Vendors Apart)
Here's how I compare and contrast different vendors:
Standout Features
Scenario simulation is a big differentiator—I look for tools that let me model what happens to a delivery timeline if I shift resources between projects or cut scope. Cross-project benchmarking adds another layer, helping PMO leads compare velocity or budget adherence across teams to spot patterns worth acting on. I also check whether a tool can pull insights from meeting recordings, extracting action items and risks directly into reports without manual notes.
Beyond Features
AI transparency matters a lot here. I check whether a tool shows the source data behind its predictions and flags confidence levels, since PMO leads need to trust what they're presenting to leadership. Data security is another factor I weigh—especially AI data handling policies, like whether project data gets used to train models. I also evaluate scalability, looking at how well a tool performs when rolling up reports across hundreds of projects in a multi-program portfolio rather than just a handful of workstreams.
How to Choose AI Reporting Tool
It’s easy to get bogged down in long feature lists and complex pricing structures. To help you stay focused as you work through your unique software selection process, here’s a checklist of factors to keep in mind:
| Factor | What to Consider |
|---|---|
| Scalability | Will the tool grow with your business? Consider if it can handle increased data volume and user numbers as your company expands. |
| Integrations | Does it work with your current systems? Evaluate if it connects easily with your existing software to avoid data silos and manual data entry. |
| Customizability | Can you tailor it to your needs? Look for options to customize dashboards and reports to suit your team's workflow and preferences. |
| Ease of use | Is it user-friendly? Check if the interface is intuitive, reducing the learning curve for your team and enabling quick adoption. |
| Implementation and onboarding | How quickly can you start? Consider the time and resources needed for setup and training. Look for tools with guided onboarding processes. |
| Cost | Is it within budget? Compare pricing plans and check for hidden fees. Ensure the tool provides good value for the features you need. |
| Security safeguards | How secure is your data? Ensure the tool complies with data protection standards and offers encryption and access controls to protect your information. |
| Support availability | Can you get help when needed? Look for accessible support channels and consider the quality of customer service based on reviews. |
What Are AI Reporting Tools?
AI reporting tools are software solutions that automate the collection, analysis, and presentation of data in a visual format. They help by processing large datasets quickly, identifying patterns, and generating insights. This automation reduces manual work and allows your team to focus on strategic decisions rather than data crunching.
AI reporting tools are generally used by data analysts, business managers, and marketing professionals to make informed decisions. Among its features are real-time data updates, customizable dashboards, and automated reporting, which help users understand complex data quickly and efficiently.
Overall, these tools provide valuable insights that drive better decision-making and improve business outcomes.
Features of AI Reporting Tools
When selecting AI reporting tools, keep an eye out for the following key features:
- Data visualization: Transforms complex data into easy-to-understand visuals, helping users quickly grasp insights.
- Real-time updates: Provides up-to-the-minute data, ensuring decisions are based on the latest information.
- Customizable dashboards: Allows users to tailor dashboards to fit specific needs and preferences, enhancing usability.
- Automated reporting: Saves time by generating reports automatically, reducing manual effort.
- Integration capabilities: Connects with existing software systems, streamlining data flow and reducing manual input.
- Predictive analytics: Offers insights into future trends, helping users anticipate changes and make proactive decisions.
- Security safeguards: Protects data with encryption and access controls, ensuring sensitive information stays secure.
- User-friendly interface: Simplifies navigation and reduces the learning curve, enabling faster adoption by teams.
- White-label options: Allows users to brand reports as their own, which is especially useful for agencies presenting to clients.
- Alert notifications: Keeps teams informed of significant changes, allowing for quick response to important data shifts.
Benefits of AI Reporting Tools
Implementing AI reporting tools provides several benefits for your team and your business. Here are a few you can look forward to:
- Improved decision-making: Access to real-time data and predictive analytics helps your team make informed choices quickly.
- Time savings: Automated reporting reduces manual work, freeing up time for more strategic tasks.
- Enhanced data accuracy: Integration capabilities ensure data consistency across platforms, minimizing errors.
- Increased collaboration: Customizable dashboards and shared insights foster teamwork and align goals.
- Better data security: Security safeguards protect sensitive information, giving you peace of mind about data privacy.
- Greater flexibility: User-friendly interfaces and customizable features allow you to adapt the tool to your specific needs.
- Brand consistency: White-label options let you present reports under your brand, maintaining a professional image with clients.
Costs and Pricing of AI Reporting Tools
Selecting AI reporting tools requires an understanding of the various pricing models and plans available. Costs vary based on features, team size, add-ons, and more. The table below summarizes common plans, their average prices, and typical features included in AI reporting tools solutions:
Plan Comparison Table for AI Reporting Tools
| Plan Type | Average Price | Common Features |
|---|---|---|
| Free Plan | $0 | Basic reporting, limited dashboards, and standard support. |
| Personal Plan | $10-$30/user/month | Customizable dashboards, email support, and basic data integration. |
| Business Plan | $50-$100/ user/month | Advanced analytics, team collaboration features, and priority support. |
| Enterprise Plan | $150-$300/ user/month | Full data integration, dedicated account manager, and advanced security features. |
AI Reporting Tools FAQs
Here are some answers to common questions about AI reporting tools:
What should you consider before using an AI tool?
Before using an AI tool, consider your specific business needs and data sources. Ensure the tool integrates well with your existing systems and complies with data security standards. Evaluate the learning curve and support available to help your team adopt the tool effectively.
How can AI improve report accuracy?
AI improves report accuracy by minimizing human error in data processing and analysis. It uses algorithms to identify inconsistencies and anomalies in data, ensuring more reliable outputs. This accuracy helps your team make better-informed decisions based on solid data.
What are the limitations of AI reporting tools?
AI reporting tools can be limited by their reliance on data quality and availability. If data is incomplete or inaccurate, the insights generated may be flawed. Additionally, these tools might require significant initial setup and integration effort, which can be complex for non-technical users.
How do AI reporting tools handle data security?
AI reporting tools handle data security by implementing encryption, access controls, and compliance with data protection regulations. Ensure that the tool you choose has robust security measures in place to protect your sensitive information from unauthorized access or breaches.
What’s Next:
If you're in the process of researching AI reporting tools, connect with a SoftwareSelect advisor for free recommendations.
You fill out a form and have a quick chat where they get into the specifics of your needs. Then you'll get a shortlist of software to review. They'll even support you through the entire buying process, including price negotiations.