AgencyAnalytics Review: Pros, Cons, Features, and Pricing Explained



AgencyAnalytics is a marketing agency reporting software built for agencies that manage reporting across multiple client accounts. It's worth considering if your team needs white-labeled dashboards and automated client reports without stitching together tools. I'd choose it over Looker Studio if you want something built specifically for agency workflows. While Looker Studio is flexible, it requires far more manual configuration and doesn't include the client management features AgencyAnalytics has out of the box.
AgencyAnalytics Evaluation Summary

- From $20/month (billed annually)
- 14-day free trial
Why Trust Our Software Recommendations
Our team has been testing and reviewing software since 2012. As project managers ourselves, we know how difficult—and important—it is to choose the right software.
For this guide, we evaluated tools using hands-on testing and independent research, scoring tools using our selection criteria. We also draw on insights from industry thought leaders and practicing project management experts.
Our reviews reflect our human editorial judgment, not a sales pitch.
Expert reviewers:
AgencyAnalytics Overview
When comparing AgencyAnalytics against other marketing agency reporting software, its intuitive interface and broad integration library make it a top pick for agencies prioritizing quick onboarding and customizable reporting functionality. The drag-and-drop dashboard builder and automated report scheduling simplify client communication, while transparent pricing and responsive support add value. However, users needing advanced data transformation or highly granular permissions may find limitations. AgencyAnalytics is best suited for small to mid-sized agencies seeking a balance of ease of use, visual reporting, and integration breadth without the complexity or cost of enterprise-focused platforms.
pros
-
Automated report scheduling saves time on recurring client updates
-
White label dashboards support agency branding and client trust
-
Bulk reporting operations simplify managing multiple client accounts
cons
-
Limited data transformation options for advanced reporting needs
-
Granular user permissions are less flexible than some competitors
-
Custom metric creation can be restrictive for complex KPIs
-

Celoxis
Visit WebsiteThis rating combines scores from multiple user review sites to reflect overall customer sentiment about the product.4.5 -
Smartsheet
Visit WebsiteThis rating combines scores from multiple user review sites to reflect overall customer sentiment about the product.4.5 -
Accelo
Visit WebsiteThis rating combines scores from multiple user review sites to reflect overall customer sentiment about the product.4.4





Our Review Methodology
How We Test & Score Tools
We’ve spent years building, refining, and improving our software testing and scoring system. The rubric is designed to capture the nuances of software selection and what makes a tool effective, focusing on critical aspects of the decision-making process.
Below, you can see exactly how our testing and scoring works across seven criteria. It allows us to provide an unbiased evaluation of the software based on core functionality, standout features, ease of use, onboarding, customer support, integrations, customer reviews, and value for money.
Core Functionality (25% of final scoring)
The starting point of our evaluation is always the core functionality of the tool. Does it have the basic features and functions that a user would expect to see? Are any of those core features locked to higher-tiered pricing plans? At its core, we expect a tool to stand up against the baseline capabilities of its competitors.
Standout Features (25% of final scoring)
Next, we evaluate uncommon standout features that go above and beyond the core functionality typically found in tools of its kind. A high score reflects specialized or unique features that make the product faster, more efficient, or offer additional value to the user.
We also evaluate how easy it is to integrate with other tools typically found in the tech stack to expand the functionality and utility of the software. Tools offering plentiful native integrations, 3rd party connections, and API access to build custom integrations score best.
Ease of Use (10% of final scoring)
We consider how quick and easy it is to execute the tasks defined in the core functionality using the tool. High scoring software is well designed, intuitive to use, offers mobile apps, provides templates, and makes relatively complex tasks seem simple.
Onboarding (10% of final scoring)
We know how important rapid team adoption is for a new platform, so we evaluate how easy it is to learn and use a tool with minimal training. We evaluate how quickly a team member can get set up and start using the tool with no experience. High scoring solutions indicate little or no support is required.
Customer Support (10% of final scoring)
We review how quick and easy it is to get unstuck and find help by phone, live chat, or knowledge base. Tools and companies that provide real-time support score best, while chatbots score worst.
Customer Reviews (10% of final scoring)
Beyond our own testing and evaluation, we consider the net promoter score from current and past customers. We review their likelihood, given the option, to choose the tool again for the core functionality. A high scoring software reflects a high net promoter score from current or past customers.
Value for Money (10% of final scoring)
Lastly, in consideration of all the other criteria, we review the average price of entry level plans against the core features and consider the value of the other evaluation criteria. Software that delivers more, for less, will score higher.
Core Features
Automated Report Scheduling
Set up recurring reports to be sent to clients on a custom schedule. This reduces manual work and ensures clients always receive timely updates.
White Label Dashboards
Customize dashboards with your agency’s branding, colors, and logo. Clients see a professional, agency-branded interface every time they log in.
Drag-and-Drop Dashboard Builder
Easily create and rearrange widgets to display key metrics. This lets you tailor dashboards to each client’s specific needs.
Bulk Reporting
Generate and send in-depth marketing reports for multiple clients at once. This is especially useful for agencies managing a high volume of accounts.
Custom Metrics
Create unique metrics using available data sources to match client KPIs. This helps agencies report on what matters most to each client.
Multi-Channel Reporting
Combine data from SEO, PPC, social, and email campaigns into unified reports. Clients get a holistic view of their marketing performance in one place.
Ease of Use
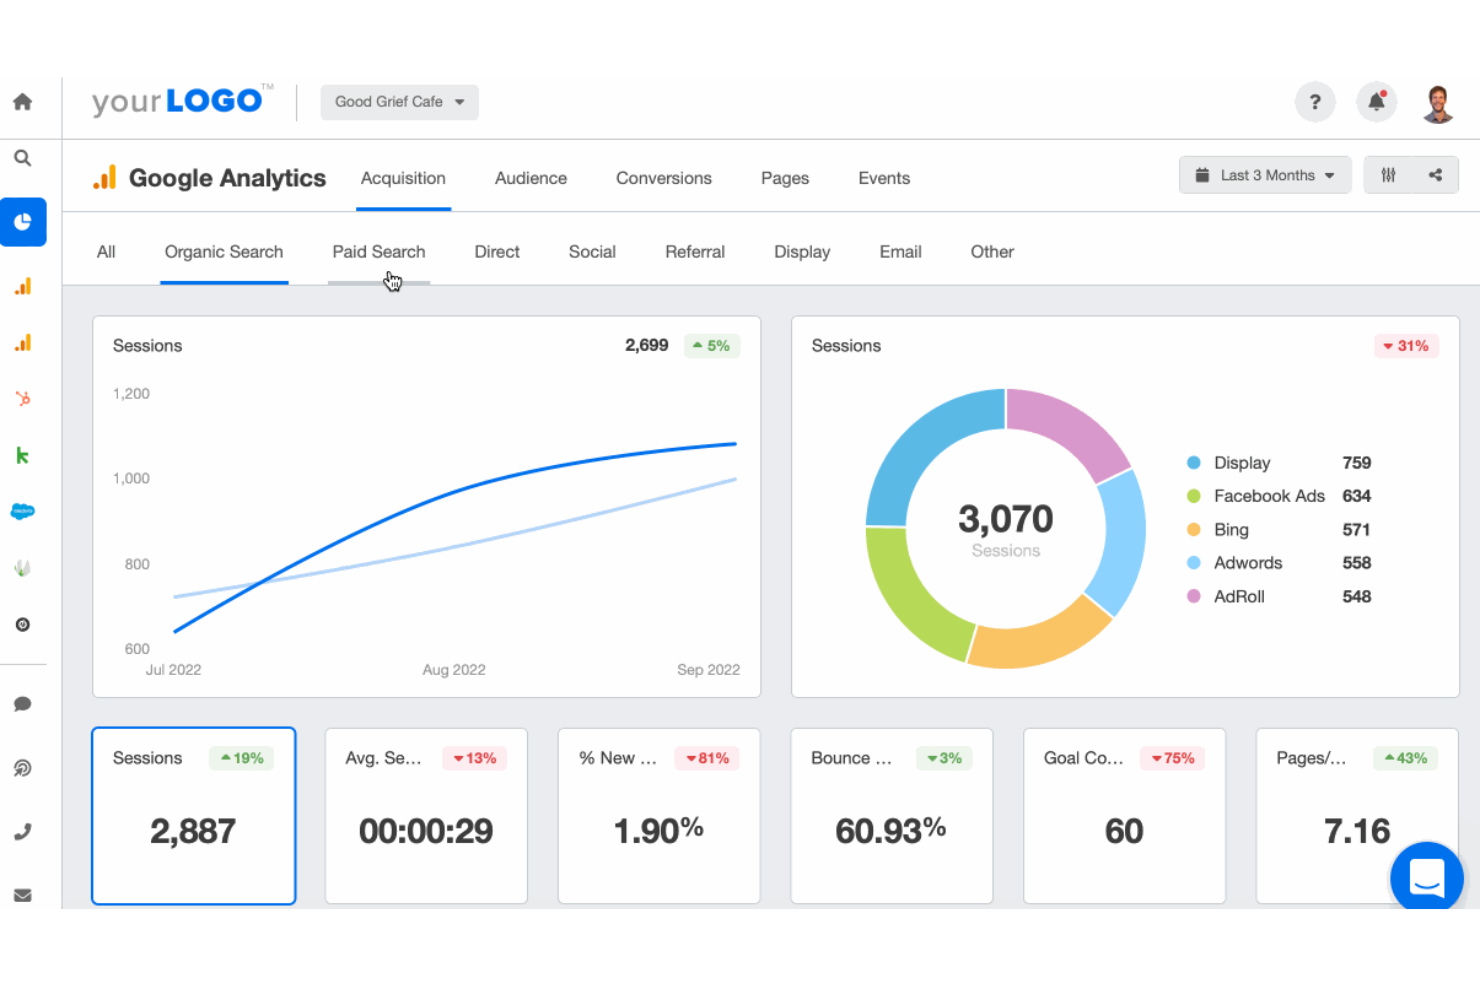
AgencyAnalytics is widely recognized for its intuitive interface and quick onboarding, making it accessible even for users with limited technical experience. The drag-and-drop dashboard builder, pre-built templates, and clear navigation help teams set up and deliver reports with minimal training. Users often highlight the platform’s straightforward workflow and logical layout, which reduces time spent on setup and troubleshooting compared to more complex reporting tools.

Integrations
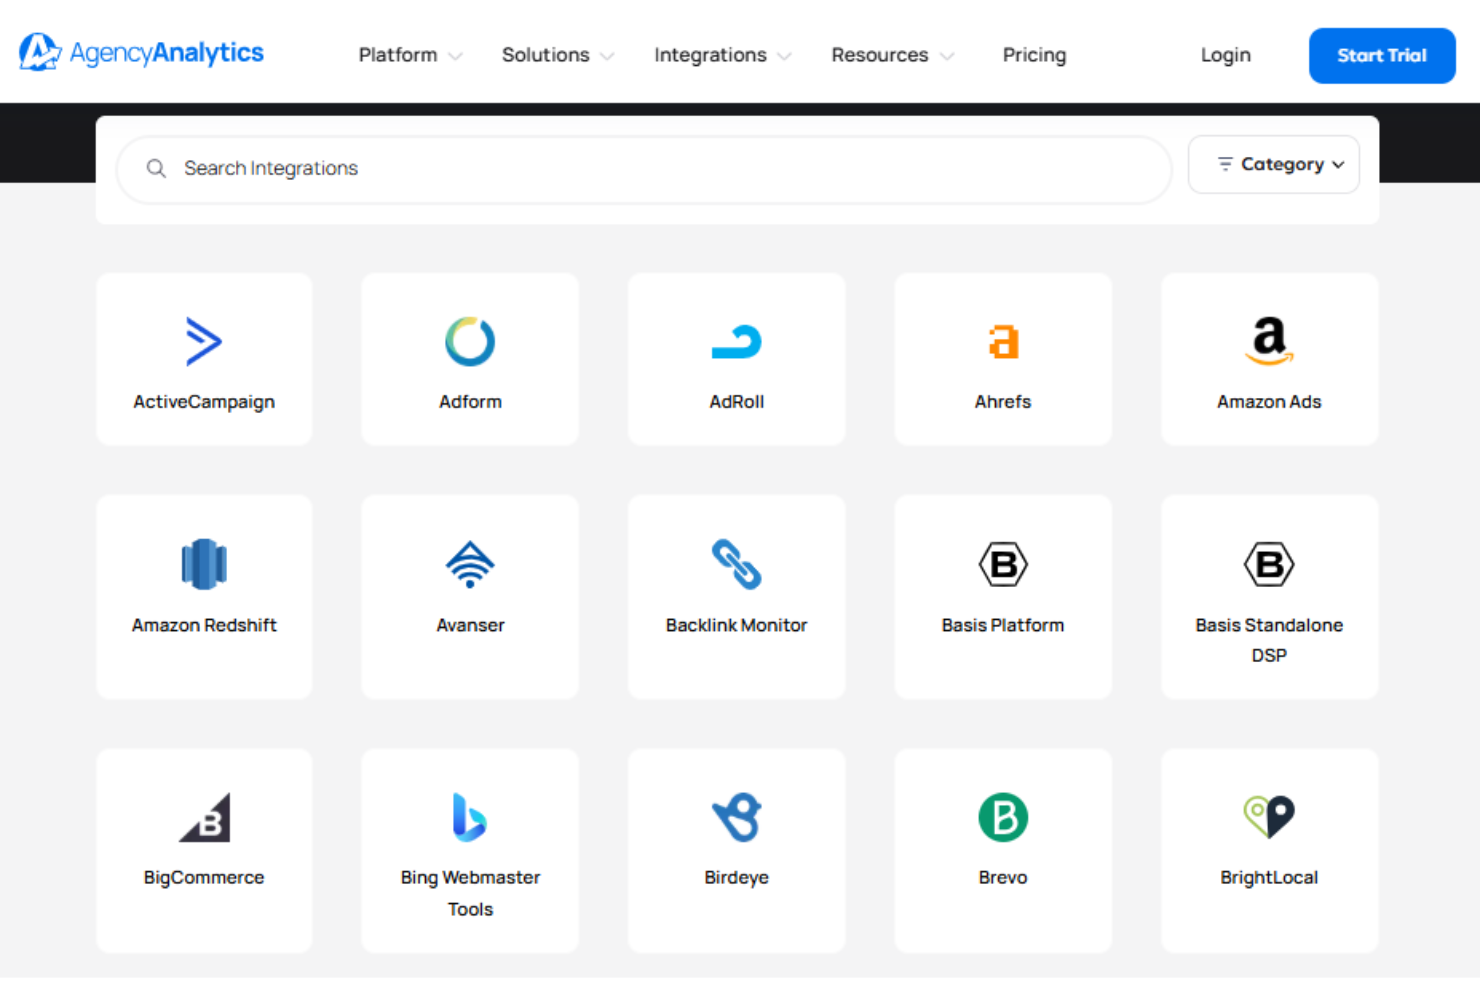
AgencyAnalytics integrates with Google Analytics, Google Ads, Facebook Ads, Instagram, LinkedIn, Twitter, Mailchimp, SEMrush, Ahrefs, and Stripe among others.
The platform also offers an API for custom data connections but does not natively connect with third-party integration tools like Zapier.
AgencyAnalytics Specs
- 2-Factor Authentication
- A/B Testing
- Analytics
- API
- BitCoin
- Conversion Tracking
- Dashboard
- Data Export
- Data Import
- Data Visualization
- Design Templates
- External Integrations
- Inventory Tracking
- Keyword Tracking
- Marketing Automation
- Multi-User
- Notifications
- Order Management
- Payment Gateway Integration
- Payment Processor
- PayPal
- Product Catalog
- Review Monitoring
- SAP Integration
- Scheduling
- Stripe
- Third-Party Plugins/Add-Ons