Project Management Dashboard: KPIs & How to Build One

Your project sponsor needs to understand how the project is progressing, but has no patience for the budget spreadsheet, the schedule, and the project plan. They need the big picture, not the day-to-day details. That's exactly what a project management dashboard is for.
What Is A Project Management Dashboard?
A project management dashboard is a real-time visual tool that consolidates your project's most critical data into a single, easy-to-read view. It's typically built into visual project management software and the best project dashboards do more than display data, they analyze project health and forecast future performance.
A project management dashboard typically visualizes:
- Project timelines, milestones, and critical path (a Gantt chart view works well here)
- Current and projected costs
- Task status, blockers, and dependencies
- KPIs tracked through project controls to monitor scope, schedule, and budget
Your dashboard should also integrate with your other project management apps, so stakeholders can drill into detailed project status information when they need it, without that detail cluttering the main view.
How To Create A Project Management Dashboard
- Set your metrics Decide what success looks like before the project starts, ideally during the project planning phase. Pick metrics that are meaningful and easy to collect and schedule variance, budget vs. actual, task completion rate. If a metric won't change a decision you make, cut it.
- Connect your data sources Your dashboard is only as good as the data behind it. Link it directly to where work actually happens, for example, your task tracker, time logs, budget tool, so it updates automatically rather than relying on manual input. Use it to track what's going on with your project in real time.
- Choose the right visualizations Match the chart type to the data. Use bar charts for comparisons, line charts for trends over time, and RAG status indicators (red/amber/green) for quick health checks. Prioritize clarity over visual complexity.
- Assemble the layout Arrange elements so the most important signals are visible without scrolling. Group related metrics together. Use a drag-and-drop report builder to iterate quickly based on stakeholder feedback.
- Review and maintain it A dashboard that nobody trusts is useless. Assign an owner, set a refresh cadence, and revisit the metrics whenever project priorities shift. A well-designed dashboard implements best practices for project management and should be accessible to all stakeholders via your project management platform.
7 Key Components of Project Management Dashboards
Project management dashboards are highly customizable and what you include depends on project size, stakeholder preferences, and the goals in your project plan. That said, most dashboards share a core set of components.
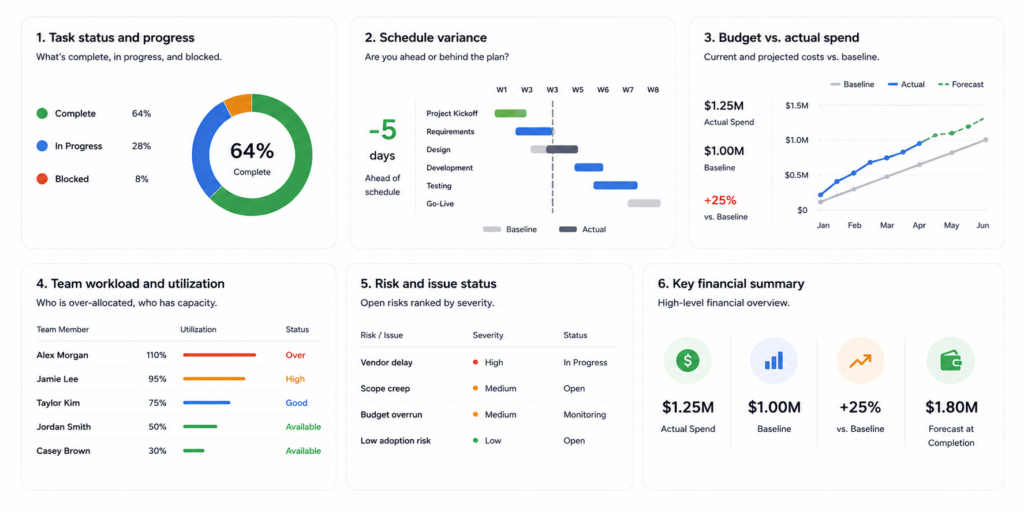
These core PM components belong on almost every dashboard:
- Task status and progress: what's complete, in progress, and blocked. The foundation of any project tracking view.
- Schedule variance: are you ahead or behind the plan? Visualize this alongside milestones and the critical path using a Gantt chart view.
- Budget vs. actual spend: current and projected costs against your baseline, tracked through project controls to catch overruns early.
- Team workload and utilization: who is over-allocated, who has capacity. Essential for managing resource allocation across the project.
- Risk and issue status: open risks ranked by severity so nothing critical falls through the cracks.
Additional components for specific use cases:
- Revenue and customer display: average revenue per customer, acquisition costs, and new customer volume. Useful when planning a marketing push.
- Customer satisfaction: retention rates, survey results, and likelihood to recommend. Good for client-facing projects.
- Sales performance: lifetime customer value, acquisition costs, and sales growth against targets.
- Cash management: rolling cash balance tracked weekly, monthly, or quarterly to monitor short- and long-term trends.
- Recruitment and hiring: recruiting spend, new hires onboarded, and billable hours. Relevant for workforce expansion projects.
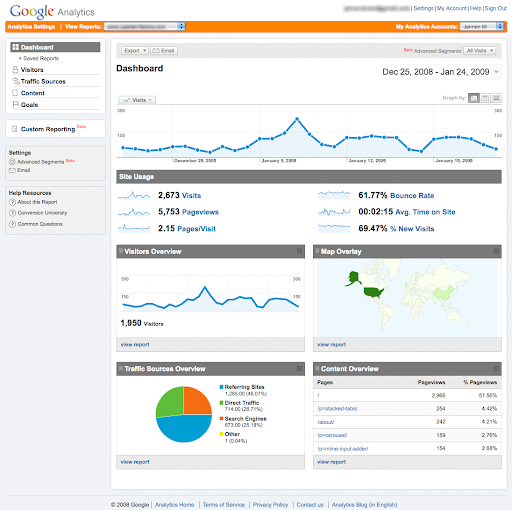
- Web analytics: page views, bounce rate, and goal conversion for teams managing a social media campaign or web presence.
- Procurement: supplier count, costs, and a status ranking by price, reliability, and communication to manage resource availability and supply chain risk.
Project dashboards vary widely depending on the specific project needs and the stakeholders involved. Here are some examples to inspire you for your own projects!
Project Management Dashboard Examples
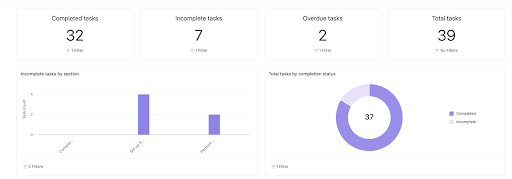
The second example dashboard reports on the status of the project tasks themselves, rather than metrics specific to the project scope. In this view, stakeholders can see the number of tasks by status and a view of incomplete tasks by project phase.
Benefits of Project Management Dashboards
There’s a lot to be gained from setting up and using project management dashboards. Well-designed dashboards offer several benefits:
- Improved project coordination: Project managers frequently use dashboards to coordinate with project team members on task status and streamline communication. This cuts down on uncertainty and helps reduce errors caused by miscommunication.
- Faster decision making: Make decisions faster with a clear, dynamic data tool at your fingertips. Aggregating key project metrics in one location in a user-friendly format reduces bottlenecks and lets you develop solutions to project problems more quickly.
- More detailed project insights: Look over KPIs and relevant metrics data at a glance. Use available project information to gain insight into how projects develop and the quality of your results.
- Enhanced scalability: Take a small project up to a big one easily. Use a project management dashboard to go from hiring a handful of employees to managing resource allocation across divisions or by expanding a limited social media presence into a digital marketing juggernaut.
- More efficient use of available resources: The time and effort saved with a simple and intuitive chart translates into money saved and projects delivered on time.
Different organizations might prefer a different type of project management platform based on their unique project demands for data, reporting, and dashboards.
Top Dashboard Tools You Can Use
Project management is a big job, and you need the best tools available to succeed. Sometimes you can get by with a Microsoft Excel spreadsheet or by spinning something up in Google Sheets, but specialized project management software makes the job much easier.
For specific project management dashboard software, check out our list of the best options here.
Clicks on the links below may earn a commission, which supports our independent testing and review of software and services. Learn more about how we stay transparent.


If you're on a tight budget, you can also try open source reporting software.
FAQs
What KPIs should be on a project management dashboard?
The five KPIs that belong on almost every project management dashboard: schedule variance, budget vs. actual spend, task completion rate, team utilization, and risk status. Beyond these, the right metrics depend on your audience, executives need portfolio-level roll-ups, delivery teams need task-level detail. A useful rule: if a number wouldn’t change a decision you make this week, remove it.
What is the difference between a project dashboard and a status report?
A dashboard is live, it updates continuously and is used for ongoing monitoring. A status report is a periodic document that summarizes project health at a point in time. The dashboard is the source; the status report is a curated extract from it. Neither replaces the other: dashboards catch problems early, status reports communicate decisions and context that raw data can’t convey.
How many metrics should a project management dashboard display?
Between five and ten. Fewer than five and you’re likely missing a critical dimension of project health; more than ten and the dashboard becomes a data dump that slows decisions rather than supporting them. Every metric should justify its presence by pointing to a decision, if no one would act differently based on seeing it, it doesn’t belong on the dashboard.
Get Started Using a Project Management Dashboard
Now that you’re in the know about what project management dashboards are and how they lead to successful projects, you’re probably eager to get set up for your next initiative.
Learn more by signing up for DPM membership and joining the conversation in Slack with 100s of other digital project managers.

