What Is a PERT Chart & How to Create One in 4 Steps

PERT Overview: A PERT chart visually represents project tasks, milestones, durations, and dependencies for clear tracking. It helps improve project predictability.
Difference From Gantt Charts: Unlike Gantt charts, which focus on timelines, PERT emphasizes task interdependencies and estimates so you can plan your projects earlier.
Use Cases: Use a PERT chart when you're running complex projects that need clarity, critical path identification, and risk management.
Developed by the U.S. Navy, the program evaluation and review technique (PERT) is designed for complex projects that demand clarity across project tasks, task dependencies, and timing. A well-constructed PERT chart provides a structured visual representation that helps your team monitor project scope, manage bottlenecks, and dramatically improve project completion predictability.
What Is a PERT Chart?
A PERT chart is a type of network diagram that maps out who does what, when. It shows every project activity, its interdependencies, and estimated durations.
Each task is broken into time estimates:
- Optimistic time (O)
- Most likely time (M)
- Pessimistic time (P)
From these, you calculate an expected time using:
Expected time = (O + 4M + P) / 6
Each node on the chart signifies key milestones (such as design approved or prototype ready). Arrows represent individual tasks which should be labelled with the task name and expected time, and you should also highlight which tasks are on your critical path.
This gives your team, especially team members and stakeholders, a clear visual of how far along your project schedule is and how much slack is available.
Whether it’s software development, a new product launch, or a company-wide implementation, a PERT chart shows you exactly how much time each phase needs and where the risks lie.
PERT Chart vs Gantt Chart
A PERT chart is a dynamic flowchart that focuses on task dependencies and forecasted durations, and is ideal for the early stages of project planning, while a Gantt chart is a static bar chart or roadmap that maps tasks to a calendar, showing actual start and finish dates.
Start your process with a PERT chart to evaluate uncertainties and schedule structure. Once you’ve defined the timeframes, export your PERT chart into a Gantt (or use a Gantt chart maker) for execution and team tracking.
What Is a PERT Chart Used For?
Use a PERT chart when you need to:
- Plan complex projects with many moving parts
- Model task dependencies early
- Estimate completion time when timelines are still fuzzy
- Identify the project’s critical path (which is related to but different from a PERT chart) to understand what mustn’t slip
- Present a clear visual to stakeholders showing impact and timing
PERT charts help align teams, especially during brainstorming or kickoff sessions, by showing how delays in one task can cascade across the project timeline.

What to Include in a PERT Chart
Here’s what to include in your PERT chart:
- Nodes marking milestones or task start and finish points
- Arrows for tasks, labeled with the task name and estimates for optimistic, most likely, and pessimistic durations
- Clear mapping of task dependencies and interdependencies
- Computed expected time using the PERT formula
This structure creates a layered visual tool that helps manage your project scope and track where you’re losing (or gaining) time.
How to Create a PERT Chart
Here’s a 4-step process to build your PERT chart:
- List all project activities: Use a work breakdown structure to list every project task, tiny or large. Every task, from “draft email copy” to “migrate data,” gets listed.
- Identify task dependencies: Draw links between dependent tasks. Can user testing run before UI design? Usually not—this clarity is the backbone of your diagram.
- Draw the network diagram: Use tools like Lucidchart, ClickUp, Microsoft Visio, or SmartDraw to create a flowchart of nodes and arrows. Label each arrow with O, M, and P, and calculate the expected time.
- Identify the critical path: Sum expected times across all paths. The longest one is your critical path; it dictates your earliest possible end date and spotlight phases that can’t slip. This gives you a clear roadmap to a realistic, achievable project schedule.
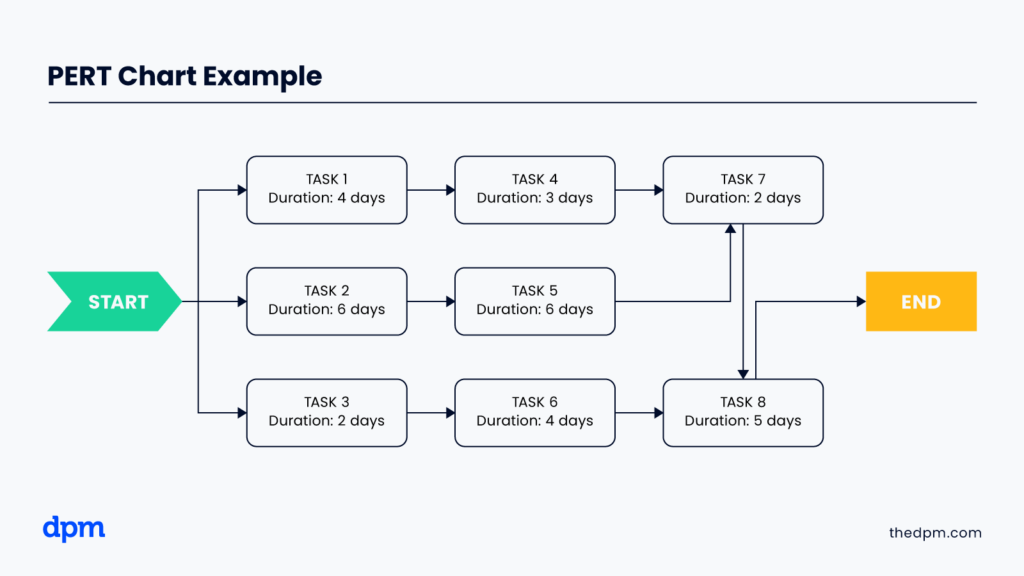
PERT Chart Example
Here’s a PERT chart example for a project involving building an explainer video.
| Task Name | O | M | P | E (Expected Time) |
|---|---|---|---|---|
| Draft script | 1 | 2 | 4 | 2.33 |
| Storyboard creation | 2 | 3 | 5 | 3.33 |
| Record footage | 1 | 2 | 3 | 2 |
| Edit video | 2 | 4 | 6 | 4 |
| Final review & tweaks | 1 | 2 | 3 | 2 |
The dependencies are as follows: the script must be completed before storyboarding can start, recording can’t start until the storyboard is complete, editing can’t start until recording is finished, and a review can’t be completed until all other tasks are complete.
The total project duration along the critical path method is ~13.66 days.
When to Create a PERT Chart
Make a PERT chart:
- When you’re beginning project planning (add this step to your project planning checklist so you don't forget any key steps)
- If you have many interdependencies and flexible start times
- When stakeholders need clarity on how tasks are sequenced
- Before locking in dates in a Gantt schedule
Tools to Build a PERT Chart
Software tools are the easiest way to build PERT charts, and they’ll be able to do the math for you. Here are the best project management tools for this purpose:
Clicks on the links below may earn a commission, which supports our independent testing and review of software and services. Learn more about how we stay transparent.


Each tool helps you create, edit, and maintain your PERT chart— it’s a living document that can adapt as your project progresses.
PERT Chart Pros and Cons
Pros
- Provides a detailed visual representation of project scope
- Allows for accurate forecasts of completion time
- Highlights your project’s critical path and where to add a buffer
Cons
- Can become unwieldy for highly branched timelines
- Relies heavily on good data, and poor time estimates can compromise accuracy
- Doesn’t show date-specific tracking and requires handoff to a Gantt for execution
How to Use PERT with CPM & Gantt Charts for Planning
Each of these charts and methods can be used during project planning. Here’s how to build a full planning life cycle:
- Start with a PERT chart to identify dependencies and estimate times
- Use the critical path method to confirm float and risk points
- Import expected timings into a Gantt chart to manage actual task start, finish, and progress
- Update each throughout project execution so your PERT remains a living document
What’s Next?
A PERT chart isn’t just a diagram; it’s a planning system that brings clarity to complexity. Merge it with CPM and Gantt strategies, and you’ll lead your team to smoother timelines, better resource use, and more predictable project completion.
Want to connect with other digital project managers to share resources and best practices? Join our membership community and get access to 100+ templates, samples, and examples, and connect with 100s of other digital project managers in Slack.

