Workflow Diagrams: Uses, Templates, & Examples


Understanding Task Flow: Workflow diagrams illustrate the sequence of tasks in a specific process, so you and your team can easily see how activities progress from start to finish.
Finding Bottlenecks: Workflow diagrams can help you pinpoint potential bottlenecks that might disrupt the completion of specific tasks or your project as a whole.
Tools To Help: You can use templates and software tools to speed up and simplify the process of creating workflow diagrams, and there are a variety of options you can customize and edit to fit your needs.
Workflow diagrams show the flow of tasks through a process from beginning to end and can help you identify potential bottlenecks in your process. Learn how to create workflow diagrams and visualize your processes clearly so you understand what happens next as you move towards the project goals.
What Is A Workflow Diagram?
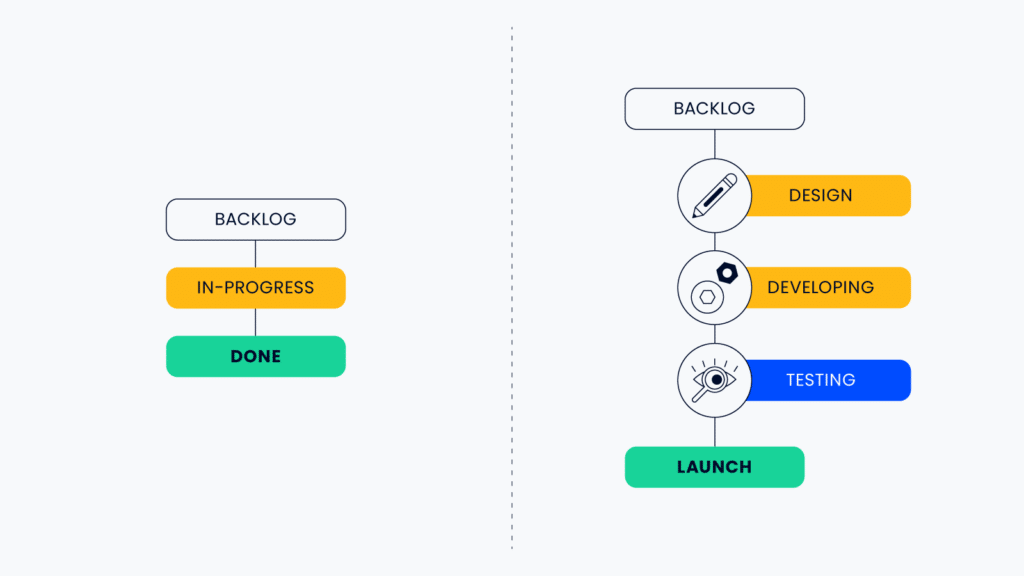
A workflow diagram is a visual representation of the steps that are necessary to complete a project. It can help you identify and track the progress of each step or task in the project as it progresses towards desired outcomes. Here's what a typical workflow diagram might look like:
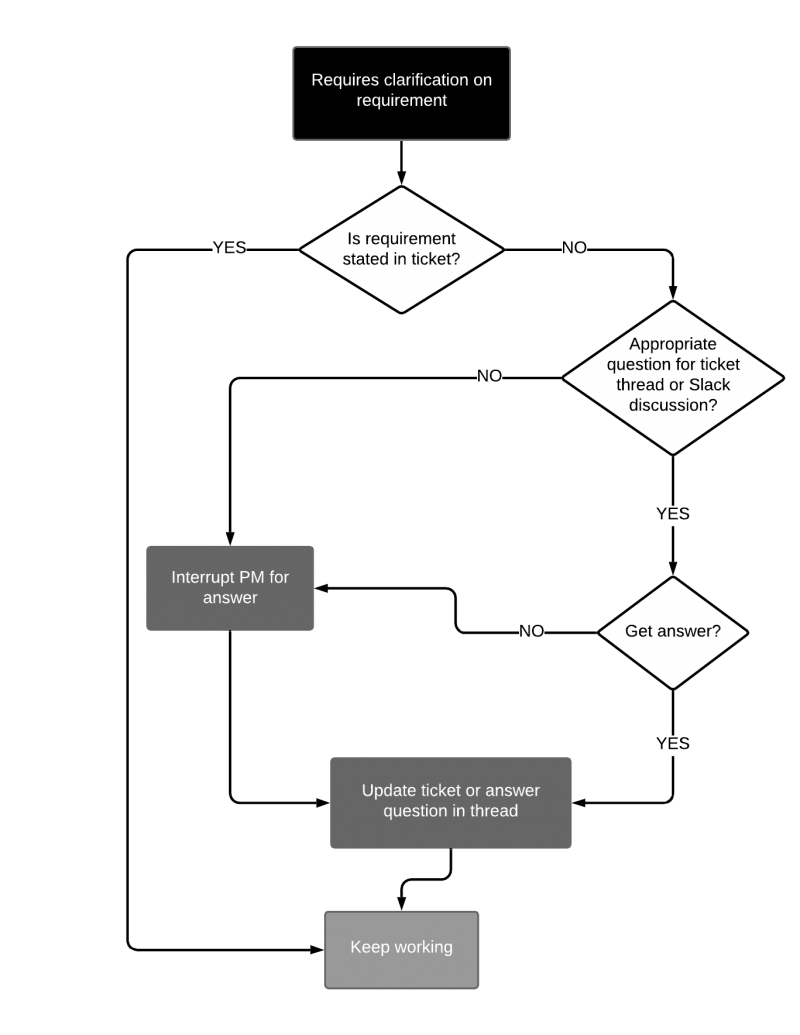
Workflow diagrams are also known as process diagrams or workflow charts, and are one of many types of flowcharts that show the process steps each work item will go through to be considered done or describe the workflow process at a more macro-level.
Find more workflow examples here.
What Are Workflow Diagrams Used For?
Workflow diagrams are used to illustrate the sequence of steps, stages, or activities that are necessary to complete a project. They can represent both waterfall and agile workflows.
They show the flow and steps in a process, as well as the different people or different departments who are responsible for each step. You can use your diagram in tandem with a RACI chart for this purpose.
If you’ve flowcharted all your processes but neglected to do a RACI, all you have is very detailed instructions about what to do and zero information about who does it. You haven’t actually solved your problem. You need to put your flowcharts into people terms. RACI is putting things into people terms.
You can use workflow diagrams in workflow optimization initiatives as a tool to help identify opportunities for positive change, or as a tool to train employees. Workflow diagrams can be used in onboarding and show new employees a step-by-step process and how it should be performed.
Workflow diagrams can also be used for a variety of field-specific processes, such creative workflows, and in various industries, including software development, healthcare, and ecommerce.

Types of Workflow Diagrams
Here are a few types of standardized workflow diagrams you might run across:
- American National Standards Institute (ANSI): The ANSI style was first on the scene for standards in workflow diagrams and is a commonly used language. Learn more about ANSI
- Unified Modeling Language (UML): UML Activity Diagrams are used to show the order of steps in a process and the flow of control. UML is often used in software engineering and systems design. Learn more about UML
- Business Process Modeling Notation (BPMN): BPMN is similar to UML and uses a flowchart to create visual workflows for the process or project at hand. BPMN is not specific to software engineering and instead focuses more on the business processes rather than software or technology systems. Learn more about BPMN and business process modeling software
- Supplier-Input-Process-Output-Customer (SIPOC): SIPOC diagrams allow you to track the way vendors, materials, and resources (e.g. your project team) work within your business process.
Beyond these formal types of project management workflow charts, there are a few other related diagrams that you might come across.
- A flowchart diagram shows the steps in a process and the order in which they should be performed. However, it's not about just putting together shapes and arrows; learning how to make a flowchart is important. Arrows indicate the direction that the process flows, and there are different symbols depending on what you want to represent. Flowcharts can be created and tracked using flowchart software.
- A data flow diagram shows how data flows through a system. It includes the different steps in the process and the type of data that is being processed at each step.
- The process map shows the physical layout of a process. It includes the different machines or departments that are involved in the process, as well as the flow of materials and products.
Benefits of Workflow Diagrams
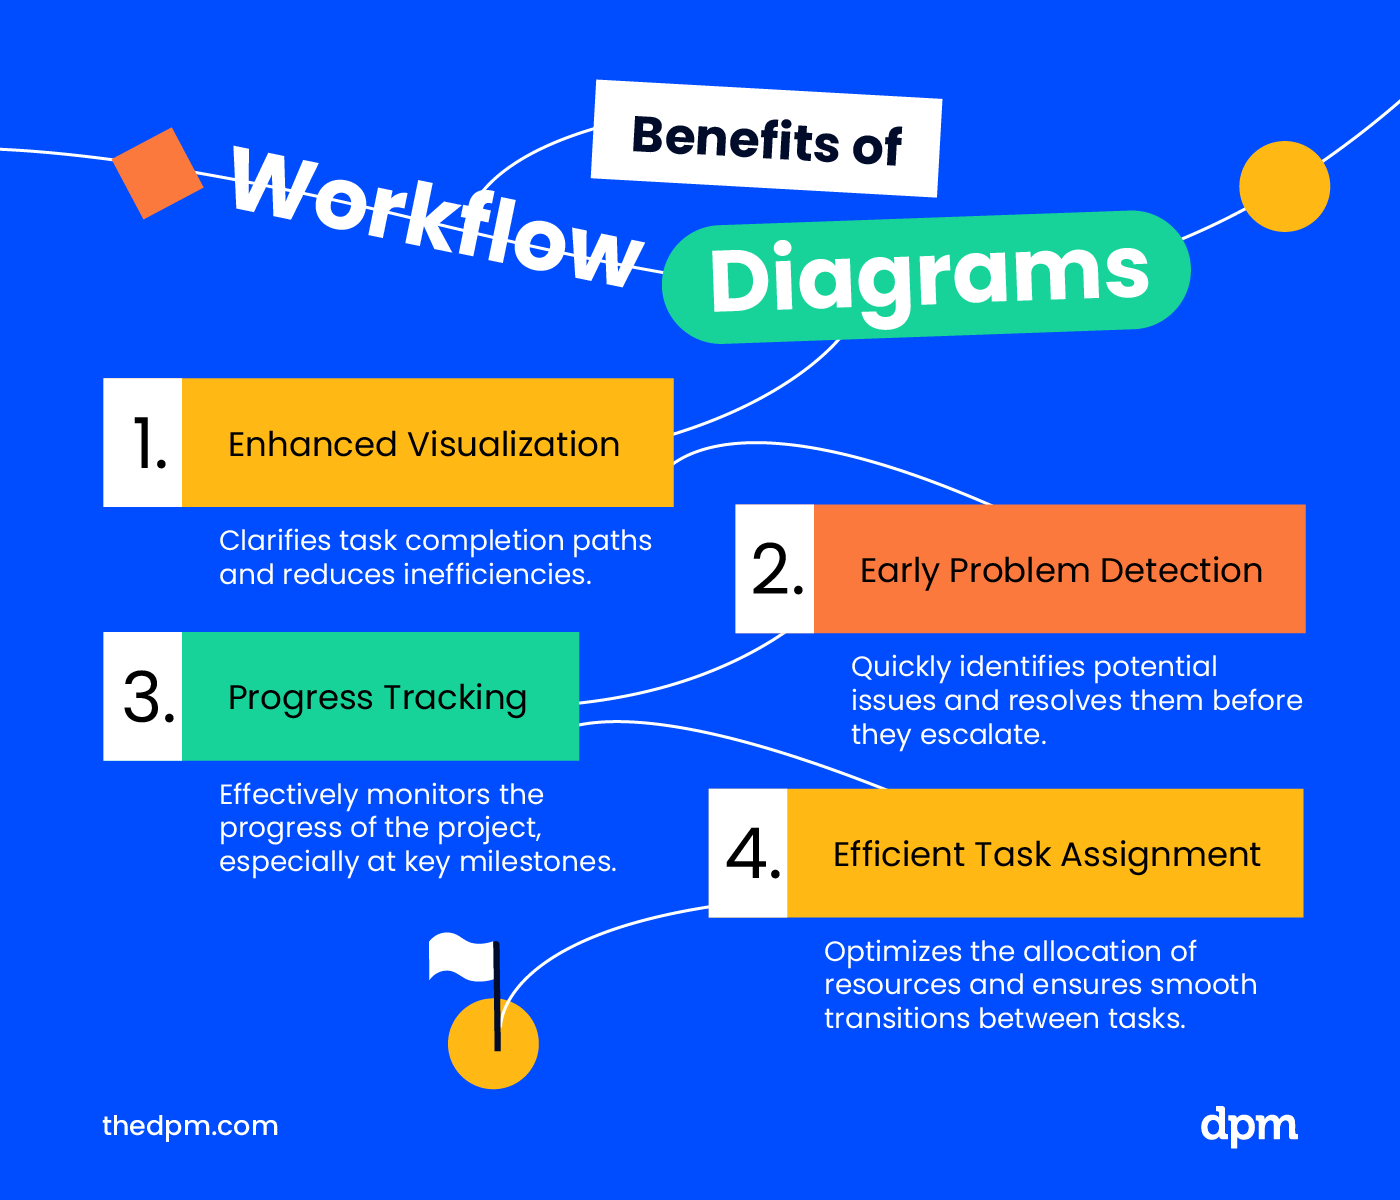
The benefits of using a workflow diagram in project management include allowing you to:
- Better visualize the path toward done for each task in a project and minimize bottlenecks and inefficiencies
- More easily identify and fix potential problems early on, especially when things get stuck
- Better track the progress of your project, especially between larger milestones
- More efficiently assign tasks to team members, especially in moments where resources are constrained or one team is waiting on another to complete their portion of a task
How To Create A Workflow Diagram
To create a workflow diagram, you'll need to take the following steps (which also apply to creating workflows in general):
- Determine the stages of the project
- Identify the individual tasks within each stage
- For each task, determine what the inputs and outputs are
- Figure out who is responsible for completing each task, and determine whether you need swimlanes
- Identify the dependencies between tasks
- Estimate how long should each task take
- Determine the potential roadblocks or bottlenecks in the process using workflow analysis
- Identify final outcomes of this process
Stay flexible so you can add or remove tasks or steps as the project progresses. Look for opportunities to streamline processes. This usually eliminating tasks or processes that don’t add value, automating workflows or any repetitive tasks, and educating contributors on working accurately and efficiently.
Learn more about workflow design and creation here.
Common Symbols & Shapes
You will likely find a few standardized symbols and shapes among the various types of workflow diagrams, including:
- Terminator: The beginning or end of your workflow, often represented by an oval or circle
- Flowline: This is the connector that moves between the steps, actions, processes, decisions, or start/endpoints. Take note of which direction the flow lines point!
- Step, action, or process: Each item, step, action, or process might show up as a square or rectangle.
- Decisions: Decisions are commonly noted with a diamond. You might also see arrows with yes/no approved/denied, etc. to show what happens based on decision that's made (tip: approval workflow software can be useful for processes that require sign-off from a specific person or role)
Symbols should be used consistently or aligned to the standard required by the organization or team.
Workflow Diagram Template Options
Here are some workflow diagrams templates you can download and adapt to your own needs.
- Miro templates: Ideal for real-time, collaborative workflow mapping on remote teams (read more about team workflows here).
- Microsoft templates (Excel and Visio): These templates are best for those familiar with Microsoft tools, so they can integrate into existing workflows.
- SmartDraw: SmartDraw is perfect for budget-conscious managers needing a variety of intuitive, free templates for quick workflow mapping.
- Microsoft PowerPoint: PowerPoint is optimal for integrating workflow diagrams into presentations, as well as for visual communication and reporting.
- Lucidchart templates: Lucidchart offers advanced, flexible templates for complex workflow visualization such as swimlane diagrams and data flows.
Tools For Workflow Diagramming
There are a variety of tools on the market that are specifically designed to help you create workflow diagrams. Test out a few tools before you make a firm decision—most tools include templates that you can use as a starting point and customize as you go.
Here are my top picks for workflow diagram software:


Check out these resources to find more options for workflow software tools:
- Free workflow software if you're in a smaller organization with a limited budget, or if you just want to get started quickly
- Workflow management software for managing workflows once you've got them set up and running
- Workflow automation software for automating the manual and repetitive parts of your workflows
- Camunda alternatives if you're currently using Camunda but you're finding it's not the best fit for your needs
What's Next?
Want more tips for improving your workflow diagrams? Join the conversation in Slack with 100s of other digital project managers with DPM Membership!
