10 Project Management Flowchart Examples + Best Practices

Go With the Flow: Project management flowcharts improve clarity and control, help you visualize order and responsibilities, and prevent chaos and confusion.
Visual Magic: Flowcharts serve as visual aids that help you make sure all project steps are visible and accessible, so you can eliminate guesswork.
Early Issue Detection: With your process mapped out in clear flowcharts, you'll be able to quickly see where issues are arising and adjust your workflows to be more efficient.
Project management flowcharts bring more clarity and control to your projects—when you know the order of operations and who’s working on what, you can plan, run, and (finally) close your projects without feeling like you are building the plane while flying it.
Here are some examples of the types of project management flowcharts you’ll encounter when you’re running projects (quick tip: it’s best to manage and create these in flowchart software or workflow management software).
What Is a Project Management Flowchart?
A project management flowchart is a visual representation of the steps, tasks, and decisions involved in moving a project from start to finish across the project life cycle.
A flowchart acts as a powerful visual aid for your project team and keeps everything visible instead of trapped in one person's brain. No more mystery steps, forgotten approvals, or late-night Slack messages asking who owns that one critical task.
Why Are Project Management Flowcharts Used?
Project management flowcharts prevent chaos, finger-pointing, and last-minute fire drills by making sure everyone actually knows what is supposed to happen.
- They make processes clear: When everyone can see the steps laid out, there is a lot less confusion and a lot fewer "I thought you were doing that" moments.
- They help teams make faster decisions: A good flowchart shows exactly where decision-making happens and who is making the decision instead of leaving everyone to guess or wait for someone else to do it.
- They highlight risks before they become disasters: By mapping out the steps, it becomes easier to spot where things could go wrong before you are stuck in a dreaded "lessons learned" meeting trying to explain what went sideways.
Examples of Project Management Flowcharts

1. Project Initiation Flow
Before a project can get underway, it needs to be vetted and approved. A project initiation flow outlines the key steps that turn an idea into an official project.
It helps you make sure the project is feasible, valuable, and aligned with bigger goals, and it gives the team a clear starting point. You can build a solid foundation from day one, so projects kick off with clarity and momentum, not confusion and crossed fingers.
Here are the key characteristics:
- Outlines steps from idea submission to formal approval
- Focuses on feasibility and business value
- Gets leadership and stakeholder alignment
- Defines initial roles and responsibilities.
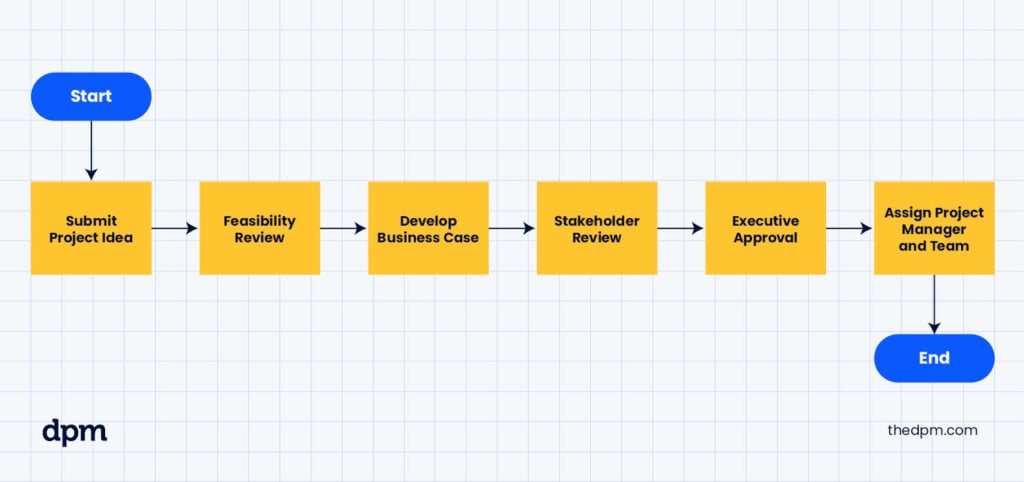
Here’s a basic example of this kind of flowchart:
- A new project idea is submitted by a stakeholder
- The project management team conducts an initial feasibility review to assess resources, timing, and business value
- A formal business case is developed, including goals, estimated costs, and risks
- Stakeholders review and provide feedback on the business case
- Leadership or an executive sponsor makes a formal go/no-go approval decision
- If approved, a project manager is assigned and a project team is assembled to begin the planning phase
2. Project Planning Flow
The project planning flow breaks the big goal into smaller, manageable pieces. It helps the team organize tasks, timelines, and resources before anyone starts building, coding, or ordering swag bags for the launch party.
You’ll transform big ideas into a step-by-step action plan that the team can actually follow without feeling overwhelmed or confused.
Here are the key characteristics:
- Defines scope and project objectives
- Breaks work into tasks and milestones
- Estimates timelines, project schedule, and budgets
- Identifies resources needed
- Outlines risk management strategies
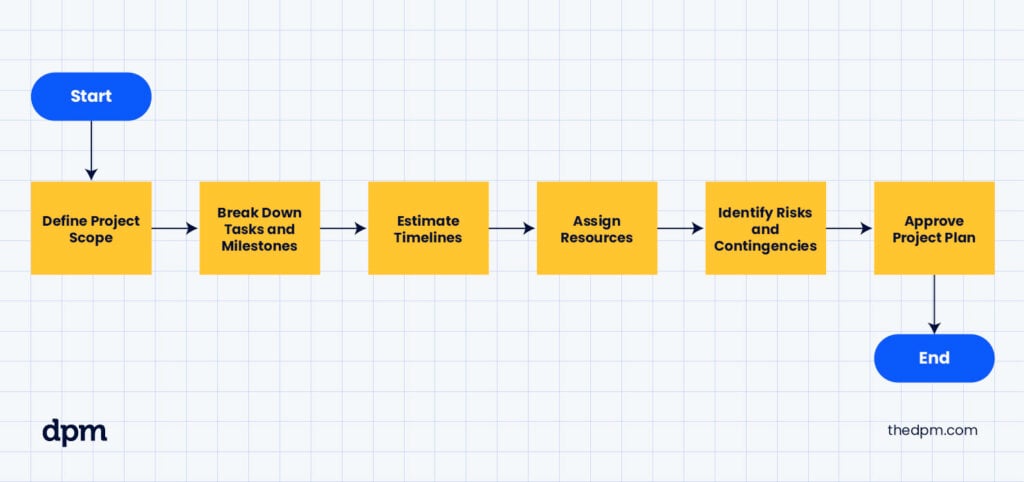
Here’s a basic example of this kind of flowchart:
- The project manager defines the project scope and clarifies what will and will not be included
- The team works together to break down the project into specific tasks and key milestones
- Estimated timelines are developed for each task, considering dependencies and available resources
- Resources (people, tools, and budget) are assigned to each task based on needs and availability
- Potential risks and roadblocks are identified, and contingency plans are created
- The full project plan, including scope, schedule, resources, and risk management strategies, is reviewed and formally approved by stakeholders
3. Project Execution Flow
A project execution flow shows how work gets done, how progress is tracked, and how teams handle changes along the way.
It keeps everyone aligned and moving forward, and provides structure and accountability during the busy, messy middle of the project when real-time updates, project status tracking, and clear deliverables are essential to staying on track.
Here are the key characteristics:
- Covers task execution
- Tracks progress against the plan
- Manages changes and issues as they come up
- Keeps communication flowing across the team
- Keeps deliverables on track
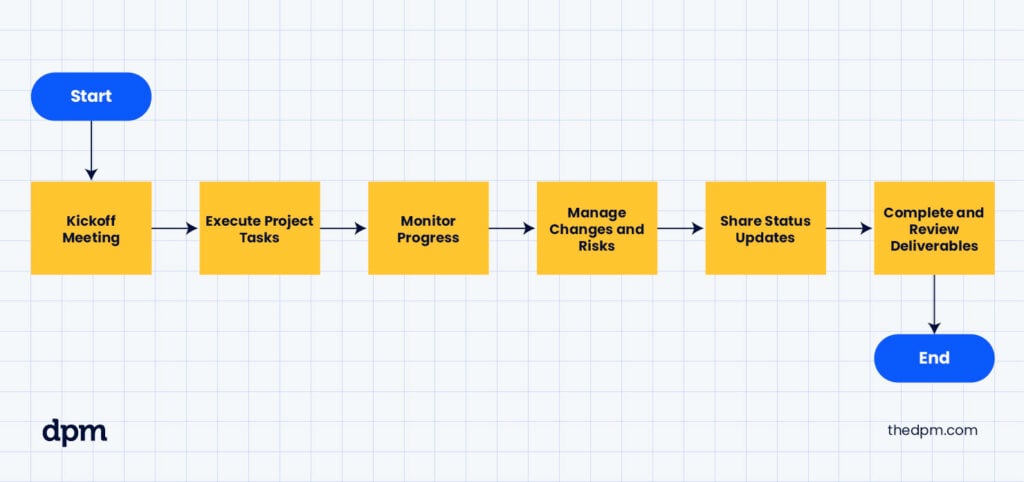
Here’s a basic example of this kind of flowchart:
- The project manager holds a kickoff meeting to get the project team aligned on goals, timelines, responsibilities, and expectations
- Team members begin executing assigned project tasks according to the project plan
- The project manager and leads monitor daily and weekly progress against milestones and the project schedule
- Any issues, risks, or requested changes are tracked, reviewed, and managed through a formal change control process
- Regular status updates are shared with stakeholders to maintain visibility, highlight achievements, and address any blockers
- Project deliverables are completed, reviewed, and prepared for final handoff or client approval
4. Project Closure Flow
A project closure flow involves wrapping up the work, documenting lessons learned, and handing things off. The team can celebrate the win, lock in the results, and move on without leaving loose ends or unfinished business floating around.
It brings closure, accountability, and learning to the project so that future work starts stronger.
Here are the key characteristics:
- Confirms deliverables are complete
- Collects final approvals
- Conducts a lessons-learned review
- Releases resources and project budgets
- Archives important documentation
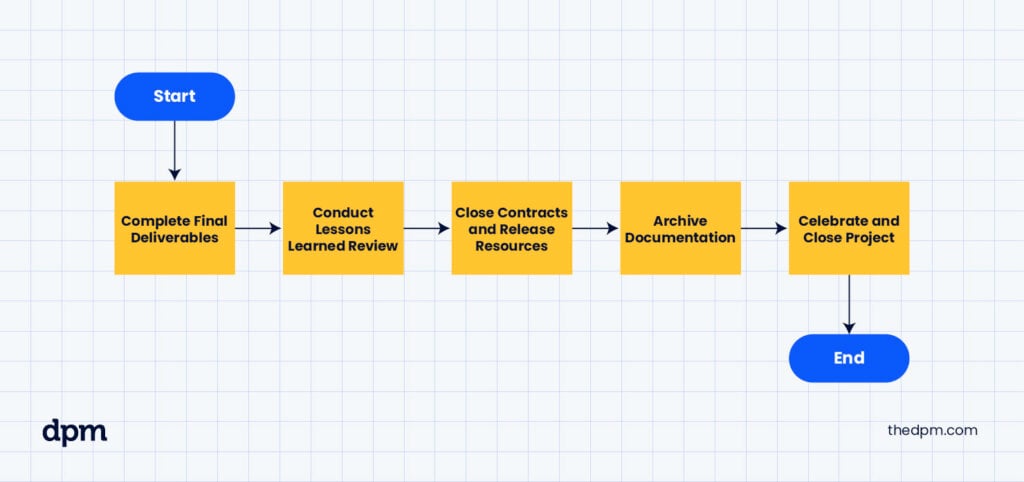
Here’s a basic example of this kind of flowchart:
- All final project deliverables are completed, reviewed for quality, and formally accepted by the client or key stakeholders
- A project review or retrospective meeting is held with the project team to capture lessons learned, successes, and improvement areas
- Any outstanding contracts are closed out, project resources (team members, tools, budget) are released, and financials are finalized
- All project documents, reports, and key assets are archived in a central system for future reference and compliance
- The team’s success is recognized and celebrated to formally mark the end of the project and maintain morale for future work
5. Process Flowchart
A process flowchart maps out how a specific process or task should happen inside a project. It shows the step-by-step sequence of steps needed to complete a repeatable business process or operational task like onboarding a new client, handling a change request, or reviewing deliverables.
It takes the guesswork out of processes so people can move faster and make fewer mistakes. All process flowcharts are different in their own way, so try to prioritize progress and documentation over perfection.
Process flowcharts create consistency across teams, reduce wasted time and confusion, and make it easier to train new team members.
Here are the key characteristics:
- Focuses on a single process or workflow
- Uses clear steps and decision points
- Shows logical order of actions
- Identifies who is responsible at each step
- Highlights where approvals are needed
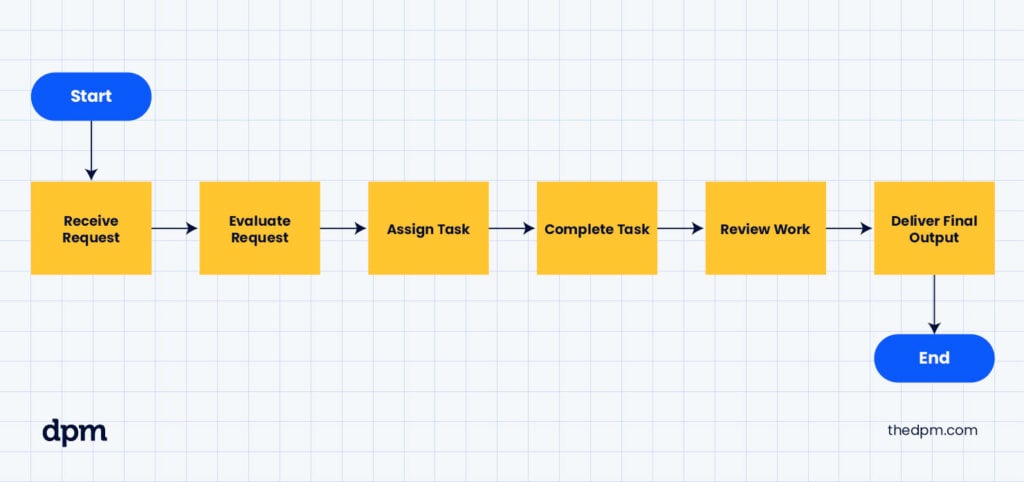
Here’s a basic example of this kind of flowchart:
- A new request or input is received and logged in the tracking system
- The project team evaluates the request for completeness, feasibility, and alignment with project goals
- If the request meets criteria, it is assigned to the appropriate team or individual
- The assigned team member completes the task following predefined steps
- The completed work is reviewed for accuracy and completeness
- Final output is approved and delivered to the original requester or next stage of the process
6. Workflow Diagram
A workflow diagram shows how tasks, information, or approvals move between people, project teams, or systems. It’s a playbook for who does what and when, as well as where handoffs happen.
Good workflow diagrams (created using workflow diagram software) make it obvious where collaboration happens and where things might get stuck.
Here are the key characteristics:
- Maps how work moves between roles or systems
- Shows the sequence of actions and decisions
- Clarifies dependencies between steps
- Identifies critical handoff points where delays are most likely
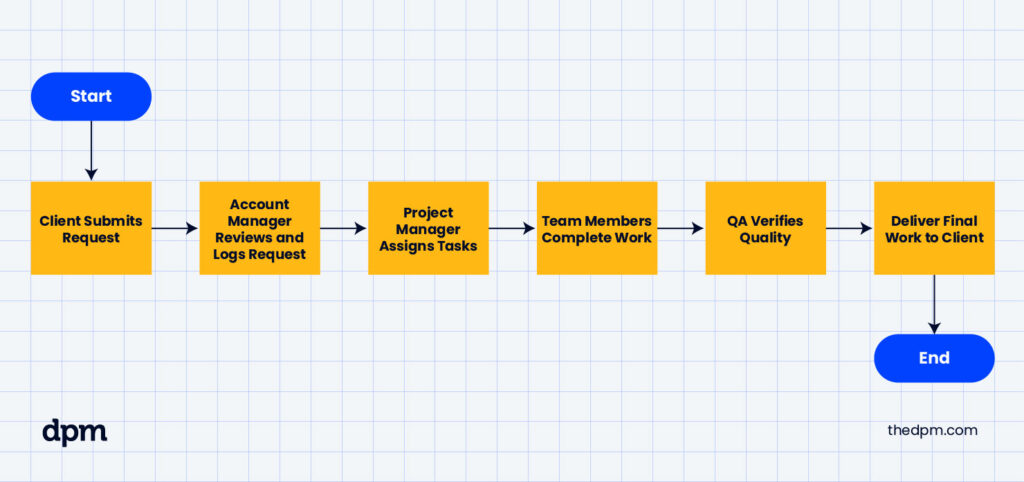
Here’s a basic example of this kind of flowchart:
- A client submits a project request through an online form
- The account manager reviews the request, clarifies any missing details, and logs it into the project management tool
- The project manager reviews the request and assigns specific tasks to the appropriate team members
- Team members complete their work and mark tasks as ready for review
- The QA team verifies that the work meets requirements and quality standards
- The final deliverable is packaged and sent to the client, with status updates throughout the process
7. Swimlane Flowchart
A swimlane flowchart organizes steps into "lanes" based on who is responsible for what to show how different people, teams, or departments interact during a project.
You get a clear view of who owns each piece and where collaboration has to happen to keep things moving. This eliminates confusion about who is doing what, when.
Here are the key characteristics:
- Separates activities into horizontal or vertical lanes based on role, team, or system
- Shows the sequence of tasks within and across lanes
- Highlights collaboration points
- Makes ownership crystal clear
Here’s a basic example of this kind of flowchart:
- The project manager conducts the project kickoff meeting
- The design team begins initial concept work and hands it off to the development team
- The development team builds out technical components and integrates feedback from the design team
- The QA team thoroughly tests deliverables and logs any issues
- The client services team prepares the final deliverable, communicates with the client, and gathers feedback
- Final sign-off is obtained from stakeholders, officially closing out the project
8. Risk Management Flow
Before issues pop up and derail your project, map out how you will identify, assess, and manage risks. A risk management flow outlines the steps your team should follow when new risks emerge, so you aren’t scrambling to invent a process in the middle of a crisis.
It gives your team a clear, proactive way to manage risks, so surprises don’t derail your project.
Here are the key characteristics:
- Identifies potential risks
- Evaluates the impact and likelihood of each risk
- Assigns owners to manage specific risks
- Defines mitigation or contingency plans
- Tracks risks throughout the project
Here’s a basic example of this kind of flowchart:
- Brainstorm and document potential project risks
- Assess each risk for likelihood and impact
- Prioritize risks based on severity
- For each risk, assign an owner who is responsible for monitoring it
- Develop mitigation plans for high-priority risks
- Track active risks through project status reports
- Adjust mitigation plans or escalate if a risk materializes

9. Change Management Flow
A change management flow outlines how teams propose, evaluate, approve, and implement changes to scope, timeline, or resources.
It prevents changes from spiraling into chaos and keeps everyone aligned when adjustments need to happen mid-project.
Here are the key characteristics:
- Defines how change requests are submitted
- Establishes criteria for evaluating the impact of changes
- Assigns authority for approval
- Maps steps for implementing approved changes
- Keeps stakeholders updated
Here’s a basic example of this kind of flowchart:
- A team member or stakeholder submits a formal change request
- The project team evaluates the potential impact on scope, timeline, budget, and risks
- The project manager or change control board reviews and approves or rejects the change
- Approved changes are incorporated into the project plan and communicated to all relevant stakeholders
- Tasks are adjusted and teams are reassigned if necessary
- Progress is monitored to make sure the change is successfully integrated

10. Data Flow Diagram
A data flow diagram (DFD) maps how information moves through a system or project. It shows where data comes from, where it goes, how it gets processed, and what outputs are created.
If your project touches anything technical—like software, databases, or even basic reporting—a DFD can save you from a lot of ugly surprises. It helps prevent data gaps, duplicate work, or missed handoffs in projects that rely on information moving between systems or people.
Here are the key characteristics:
- Focuses on the flow of data rather than tasks
- Identifies inputs, processes, data storage, and outputs
- Shows how information moves between people, systems, and databases
- Highlights where data could bottleneck or break
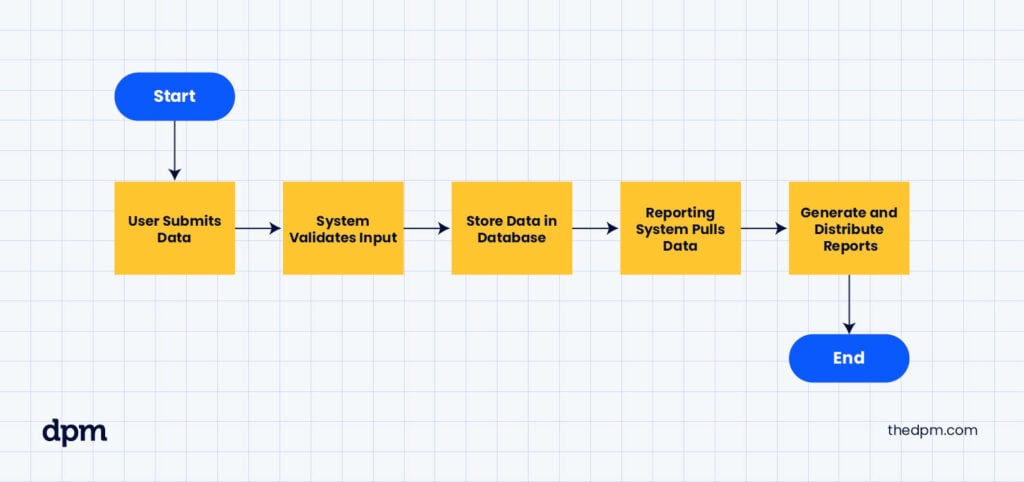
Here’s a basic example of this kind of flowchart:
- A user enters information into a web application form
- The system validates the input data to make sure it meets required formats
- Validated data is stored securely in a central database
- The reporting system pulls data from the database at scheduled intervals
- Reports are generated and distributed to project managers and leadership for review and decision-making
Best Practices for Project Management Flowcharts
Here are some best practices for creating project management flowcharts:
- Start simple and layer in details: Map the major steps first before the tiny ones. This keeps the chart readable and helps you focus on what moves the project forward. I start by sketching out the workflows on a whiteboard before putting anything into a computer.
- Use consistent shapes and labels: Stick to one clear (simple and easy to replicate) set of symbols for tasks, decisions, and handoffs. Consistency makes it easier for people to follow the flow without stopping to decode your chart mid-meeting.
- Highlight decision points clearly: Make decision points easy to spot. It keeps teams moving and reduces the chance of approval bottlenecks.
- Assign and show ownership: Link each step to a role or owner. Tasks without owners tend to sit untouched until someone finally notices—three weeks later.
- Avoid overuse of color coding: I will always remember a team member telling me he couldn’t discern the decision points in the workflow—even though they were in a different color than the other boxes, he was colorblind! Avoid this issue by using a different method for differentiating elements in your workflows.
- Plan for evolution: Treat your flowcharts like living documents that evolve alongside your project management methodology and changing needs.
What’s Next?
If you want templates, tools, and tips to sharpen your project management game, check out The Digital Project Manager membership. You’ll get access to expert resources, hands-on support, and a community that gets what it is like to juggle deadlines, scope creep, and three versions of the same project plan.

