

10 Best Agency Reporting Software Reviewed In 2026

10 Best Agency Reporting Software Shortlist


Agency reporting software delivers valuable insights into performance metrics, allowing agencies to monitor progress, recognize trends, and make informed, data-driven decisions.
However, choosing the right agency reporting software can be tough with so many options out there. With years of experience using various agency reporting systems, I can guide you.
Let me help you find the best software choices to solve your agency reporting challenges. Here are my picks of the best agency reporting software.
Why Trust Our Software Recommendations
Our team has been testing and reviewing software since 2012. As project managers ourselves, we know how difficult—and important—it is to choose the right software.
For this guide, we evaluated tools using hands-on testing and independent research, scoring tools using our selection criteria. We also draw on insights from industry thought leaders and practicing project management experts.
Our reviews reflect our human editorial judgment, not a sales pitch.
Expert reviewers:
Agency Reporting Software Comparison Table
We’ve investigated the pricing and availability of free trials and demo versions:
Score legend (out of 5)
- Excellent 4.5–5
- Good 4–4.4
- Average 3–3.9
- Below average 2–2.9
- Poor 1–1.9
| Tool | Starting Price | Website | |||||||
|---|---|---|---|---|---|---|---|---|---|
| Best for real-time reporting | — | 3 | 2 | 4 | — | 2 | 3 | $17/user/month 14-day free trial | Book Demo |
| Best for white-label client reporting | 3.8 out of 5 | 4 | 3 | 4 | 4 | 4 | 4 | $44/mo Free trial available | Website |
| Best for client-ready marketing reports | 4.3 out of 5 | 4 | 4 | 5 | 4 | 5 | 4 | $20/client/month Free demo + 14-day free trial | Website |
| Best for unifying cross-channel marketing data | 3.8 out of 5 | 3 | 4 | 4 | 4 | 4 | 4 | $812/month Free demo available | Website |
| Best for no-code custom dashboard creation | 4.2 out of 5 | 4 | 4 | 5 | 4 | 4 | 4 | $71/month Free plan + 14-day free trial + free demo available | Website |
| Best for moving established agency portfolios | 4.0 out of 5 | 4 | 3 | 4 | 4 | 5 | 4 | €69/month 14-day free trial | Website |
| Best for tying ad spend to billable hours | 3.7 out of 5 | 3 | 4 | 5 | 3 | 3 | 4 | $39/user/month Free trial available | Website |
| Best for advanced enterprise analytics | 3.7 out of 5 | 3 | 4 | 5 | 4 | 2 | 4 | $14/user/month Free plan available | Website |
| Best for standardizing reports across clients | 4.0 out of 5 | 4 | 3 | 4 | 4 | 5 | 4 | $20/month 14-day free trial available | Website |
| Best for business intelligence | 3.8 out of 5 | 4 | 3 | 5 | 3 | 4 | 4 | $30/month 15-day free trial | Website |
Best Agency Reporting Software Reviews
Here’s an in-depth analysis and overview of each agency reporting software. This will walk through the pros and cons of each tool, its features, and best use cases.

Scoro
Best for real-time reporting
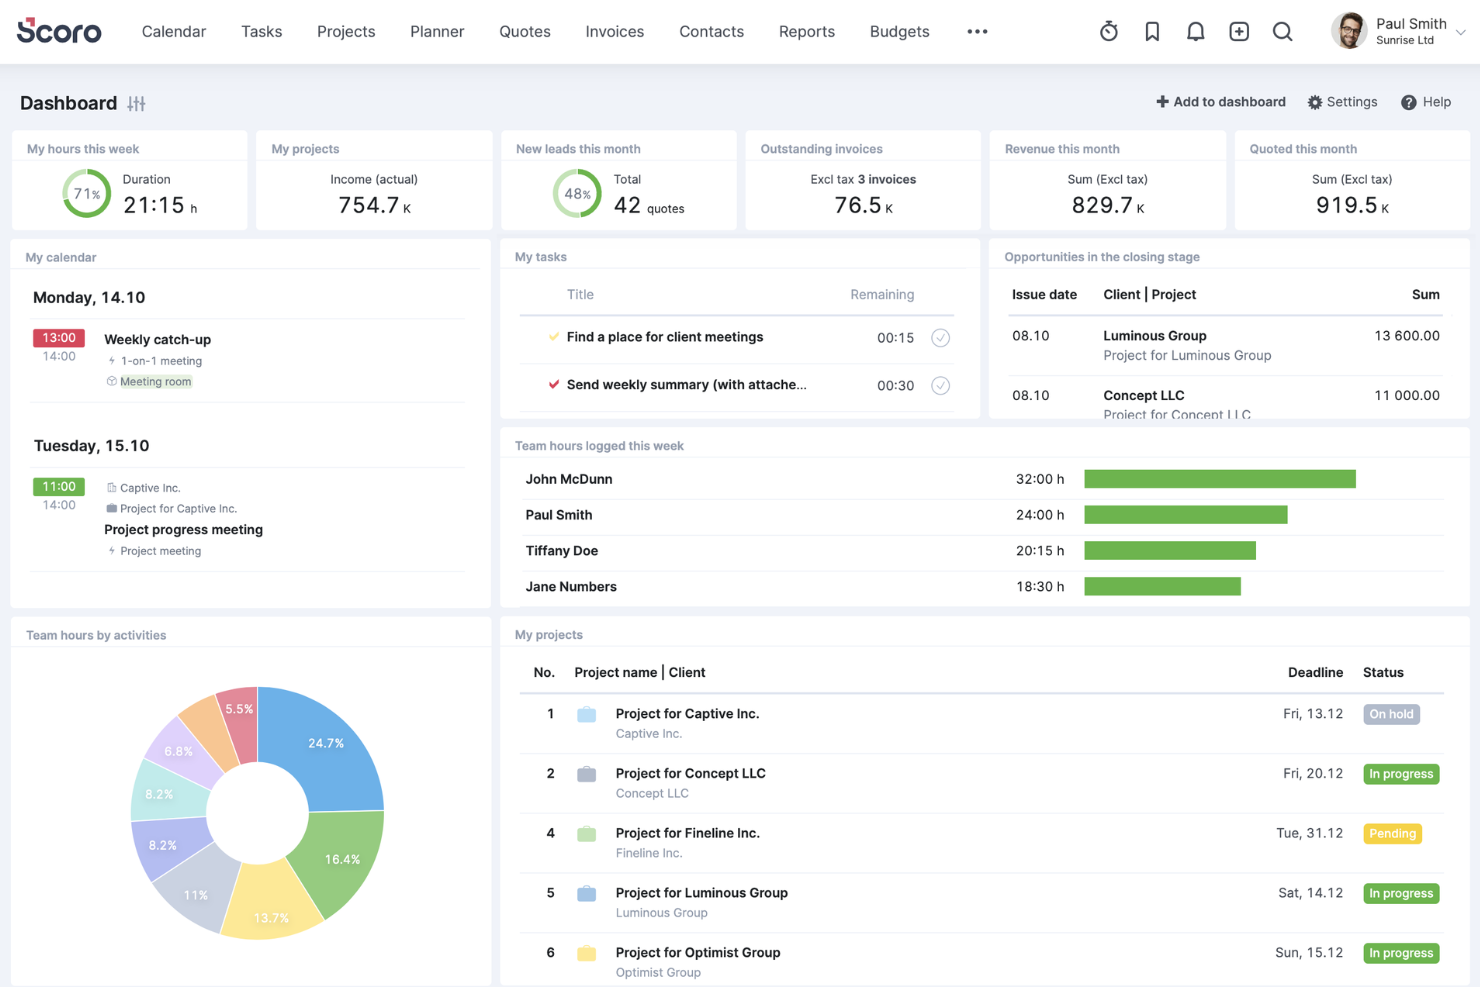
Scoro is a professional services automation platform that combines project management, time tracking, resource planning, client billing, and real-time financial reporting across projects and teams.
Who Is Scoro Best For?
Scoro suits agency operations managers who need real-time visibility into project profitability, billable time, and budgets across multiple client accounts in one place.
Why I Picked Scoro
Scoro earns its spot on my shortlist because its real-time reporting gives operations managers a live view of project profitability, billable hours, and budget burn across every client account, all in one place. I particularly like the Watchdog feature, which lets you set a threshold on any bookmarked metric (like retainer budget used) and get an email the moment it's breached. The Customer Portal adds another layer by letting clients log in and see their own project financials and progress in real time, without you having to build a separate report.
Scoro Key Features
- Project budget tracking: Monitor budgets in real time against quoted and actual costs at the project level, with profitability visible across all client accounts.
- Retainer management: Set up retainer periods, track hours used versus allocated, and schedule recurring invoices directly within the platform.
- Price lists: Create rate cards with different selling and buying rates per service or product, then assign them to specific clients or contacts.
- ELI AI assistant: Ask natural-language questions to surface project data, apply filters to reports, or generate a requested breakdown of business metrics.
Scoro Integrations
Scoro lists 40+ integrations, including native connections to Xero, QuickBooks Online, Sage Intacct, HubSpot, Salesforce, and Jira. It also supports Google Analytics 4, Google Sheets, Zapier, a REST API, webhooks, and MCP for custom connectivity.
Pros and Cons
Pros:
- Clients can view permitted project finances
- Custom reports track utilization and revenue
- Real-time project profitability and budget visibility
Cons:
- Branding applies to PDFs, not dashboards
- No documented scheduled report delivery
New Product Updates from Scoro

Scoro Adds Time Mobile App and ELI Improvements
Scoro adds the Scoro Time mobile app for iOS/Android to track time anywhere and expands ELI with attachments, smarter filtering, and trigger-based actions. For more information, visit Scoro's official site.
 .

DashThis
Best for white-label client reporting
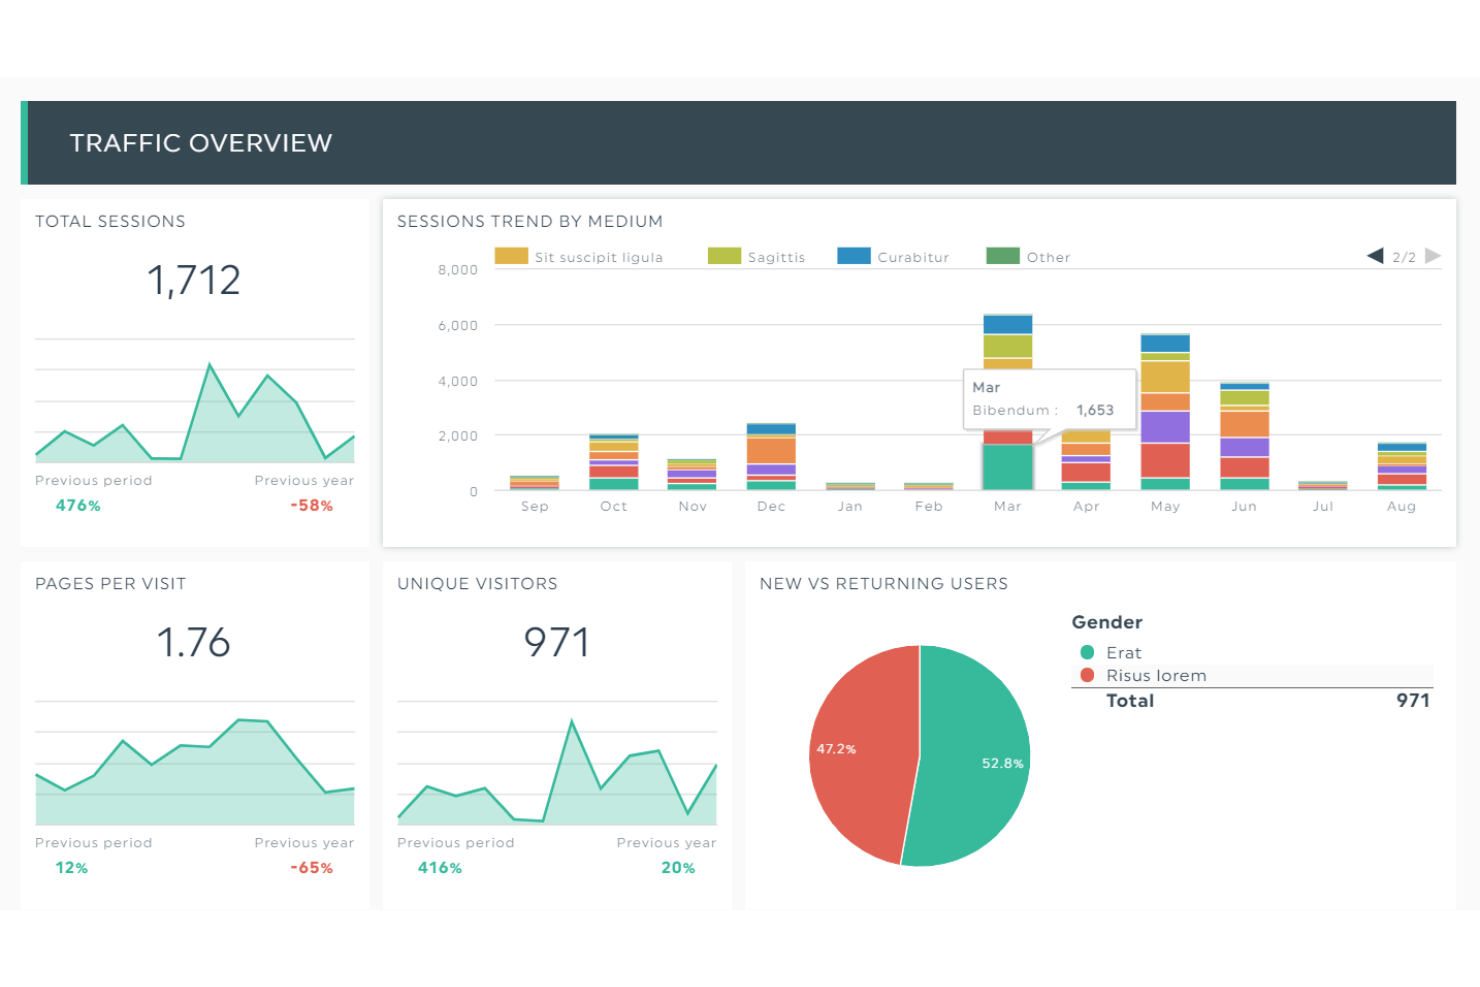
DashThis is a marketing dashboard and reporting platform built for agencies, combining data from 34+ integrations into automated, white-labeled, client-ready reports.
Who Is DashThis Best For?
DashThis is a strong fit for marketing agencies that need to deliver polished, branded reports to multiple clients without spending hours on manual data pulls.
Why I Picked DashThis
DashThis earns its spot on my shortlist because of how seriously it treats white-label client delivery. I can publish dashboards under a custom branded domain (think reports.youragency.com), strip out all DashThis branding, and send automated recurring reports from a custom email address. I also like the AI Insights feature, which generates plain-language summaries of wins, issues, and opportunities that I can paste directly into a dashboard comment for the client.
DashThis Key Features
- Preset report templates: Choose from 50+ pre-built templates organized by marketing channel, then customize and save them as reusable starting points for future client dashboards.
- Scheduled email delivery: Set up recurring report emails to go out daily, weekly, monthly, or on other cadences, with an optional PDF attachment included automatically.
- Calculated widgets: Combine metrics from multiple integrations using simple math operations to build custom KPIs that don't exist natively in any single platform.
- Dashboard grouping: Organize related dashboards into groups and share the entire group with clients via a single URL.
DashThis Integrations
DashThis offers 34+ native integrations, including Google Analytics 4, Google Ads, Meta Ads, LinkedIn Ads, TikTok Ads, HubSpot, Google Search Console, SEMrush, Ahrefs, and Mailchimp. It also supports custom data through CSV files and Google Sheets.
Pros and Cons
Pros:
- Reusable templates speed up multi-client reporting
- Scheduled emails reduce recurring client-report work
- Branded domains make reports feel agency-owned
Cons:
- Client links lack granular access permissions
- Data refreshes aren’t real-time
New Product Updates from DashThis

DashThis Adds AI-Powered Custom Data Sources Through MCP
DashThis now lets you add custom data sources to dashboards using AI through Claude or ChatGPT via MCP, turning data from non-native tools, spreadsheets, emails, or screenshots into scheduled widgets. For more information, visit DashThis's official site.
 .

Best for client-ready marketing reports
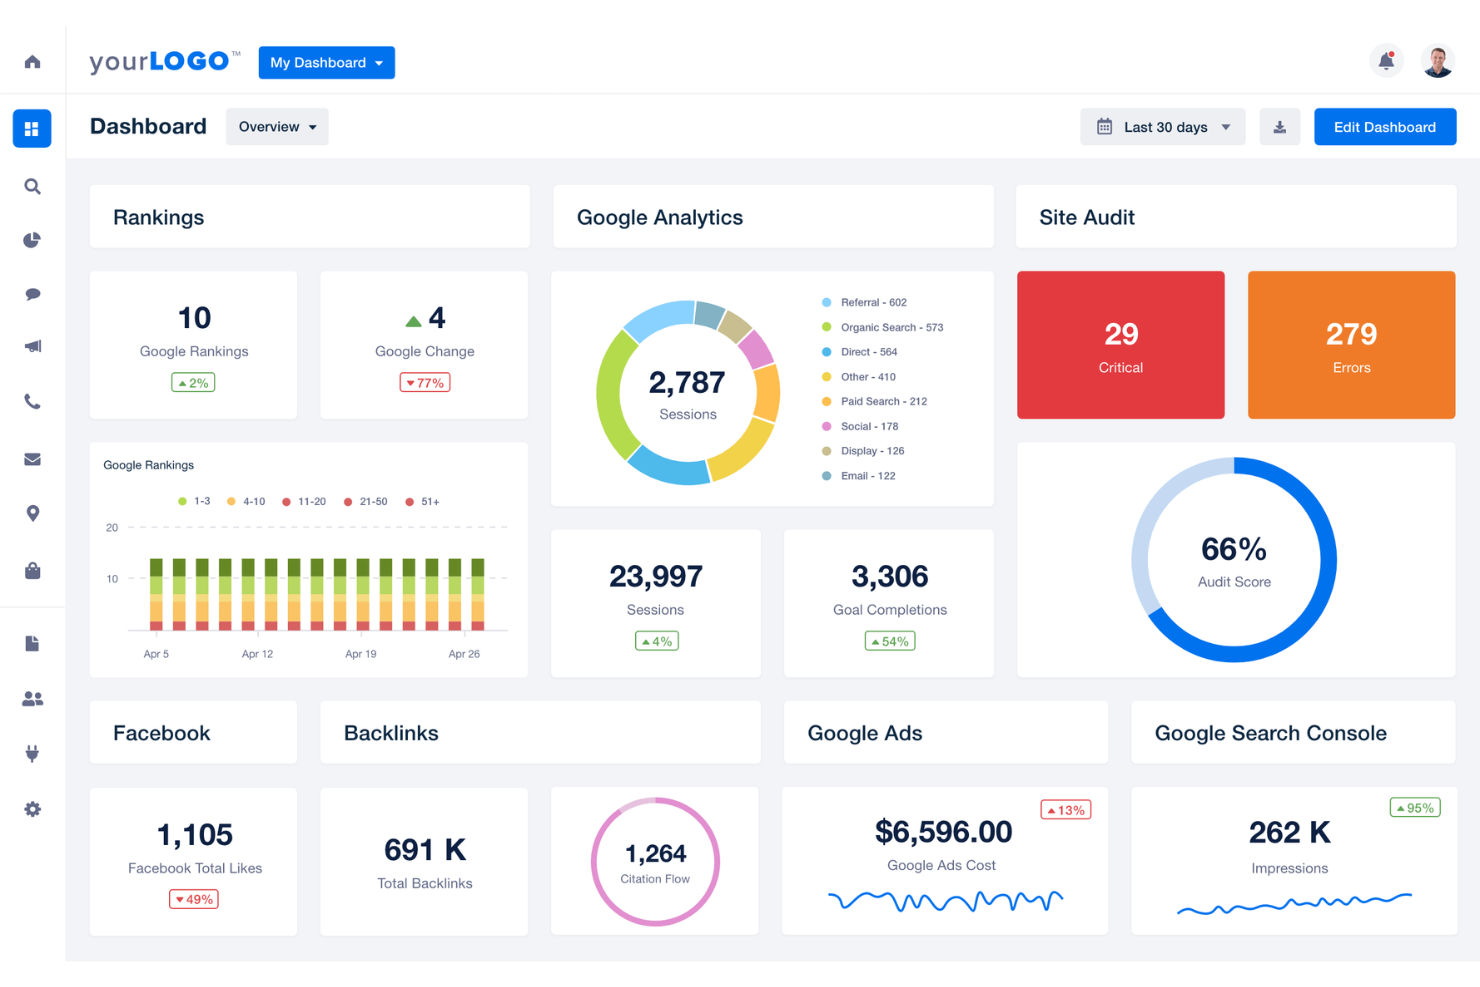
AgencyAnalytics is a marketing reporting platform built for agencies that consolidates data from 93+ integrations—spanning SEO, PPC, social, email, and CRM—into white-labeled reports and client dashboards.
Who Is AgencyAnalytics Best For?
AgencyAnalytics is a strong fit for marketing agencies that manage multiple client accounts and need polished, branded reports without spending hours building them manually.
Why I Picked AgencyAnalytics
AgencyAnalytics earns its spot on my shortlist because it's purpose-built around one thing: getting polished, branded reports in front of clients without manual assembly. I particularly like Smart Reports, which auto-populate with key metrics from whatever sources a client has connected, and the white-labeling goes deep enough to cover custom domains and per-client color schemes. The report approval workflow is what really sets it apart—scheduled reports can be held for review before sending, so nothing goes out unvetted.
AgencyAnalytics Key Features
- Roll-up reports and dashboards: Aggregate performance metrics across up to 50 client accounts into a single consolidated view.
- AI Summary: Generate AI-written summaries of charts, report pages, dashboard sections, or entire reports with customizable tone and focus prompts.
- Anomaly detection: Automatically flag unexpected changes in performance metrics on supported line and area chart widgets.
- Goal tracking: Set marketing targets per client and monitor progress directly within reports and dashboards.
AgencyAnalytics Integrations
AgencyAnalytics lists 93 native integrations, including Google Ads, Google Analytics, Google Search Console, Meta Ads, HubSpot, Shopify, Mailchimp, Salesforce, and Google Sheets. Its JSON API supports custom integrations, while MySQL, BigQuery, Redshift, PostgreSQL, and Snowflake connect custom datasets.
Pros and Cons
Pros:
- Roll-ups compare performance across client accounts
- Scheduled templates reduce monthly reporting work
- Branded dashboards simplify client performance reviews
Cons:
- Report layouts offer limited presentation control
- Data sync delays weaken real-time confidence

Best for unifying cross-channel marketing data

Whatagraph is a marketing intelligence platform built for agencies that centralizes cross-channel data from 60+ sources and turns it into automated reports, live client dashboards, and AI-generated performance summaries.
Who Is Whatagraph Best For?
Whatagraph is a strong fit for marketing agencies that manage paid, organic, and social campaigns across multiple clients and need one place to consolidate, report, and monitor all of that data.
Why I Picked Whatagraph
Whatagraph earns its spot on my shortlist because of how well it handles the sprawl of cross-channel marketing data that agencies deal with every day. I love that source groups and blended sources let you combine accounts and join datasets from different channels into a single report view, which means you're not cobbling together numbers from separate exports. The IQ Agents layer takes it further: you can set a budget-pacing agent to track client ad spend against a set budget on a schedule, so you catch overspend before a client does.
Whatagraph Key Features
- White-label customization: Apply your agency's branding, colors, and logo to client reports while removing all Whatagraph branding.
- Goals & alerts: Set KPI targets and limits for client campaigns and receive daily or weekly email or Slack notifications when performance shifts.
- AI-generated report summaries: Generate written performance insights from connected data inside a report text widget for client-facing updates.
- Client-facing filter controls: Let shared-report viewers adjust dimensions like campaign, region, or device without altering the saved report.
Whatagraph Integrations
Whatagraph lists 68 integrations, including native connections with Google Ads, Facebook Ads, TikTok, Google Analytics 4, Google Search Console, Semrush, Mailchimp, Shopify, HubSpot, and BigQuery. It also supports custom connections through its API, Google Sheets, or BigQuery.
Pros and Cons
Pros:
- Branded visuals clarify client performance results
- Scheduled reports reduce recurring manual work
- Combines campaign data into client-ready reports
Cons:
- Campaign filtering can feel unintuitive
- Occasional source disconnects and data discrepancies

Databox
Best for no-code custom dashboard creation
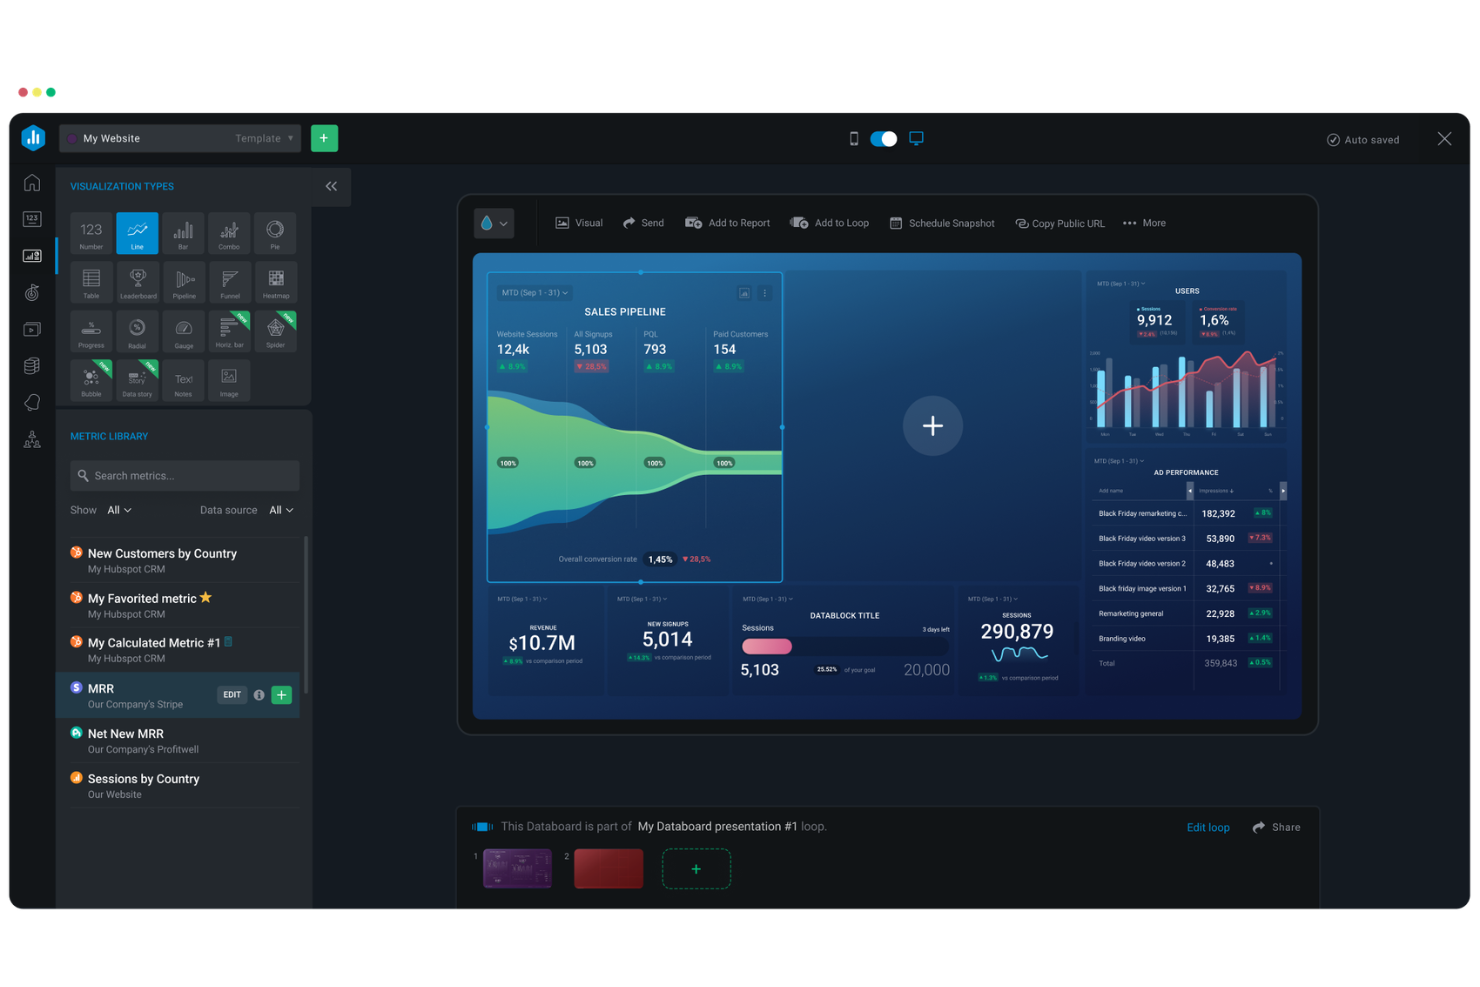
Databox is an analytics and reporting platform for agencies that connects 130+ data sources and brings metrics, dashboards, and AI-generated performance summaries into a single no-code environment.
Who Is Databox Best For?
Databox is a strong fit for marketing agencies that need to build and share client dashboards without relying on a developer or a design team.
Why I Picked Databox
I picked Databox as one of the best because its no-code dashboard builder lets me spin up a fully structured client dashboard without writing a single line of code or looping in a developer. I can save a finished dashboard as a reusable account template, then apply it to each new client account with a fresh data source attached. AI-generated narrative summaries also let me add plain-language performance commentary to any report before it goes out.
Databox Key Features
- Scheduled report delivery: Send reports to clients on a recurring cadence via email or Slack, including recipients outside your Databox account.
- White-label custom domain: Replace Databox branding with your own logo, subdomain, and notification sender across client-facing dashboards and reports.
- 130+ native integrations: Connect marketing, CRM, ecommerce, and analytics tools alongside databases and warehouses to pull client data into one place.
- Smart Alerts and anomaly detection: Set threshold-based or sensitivity-scored alerts that notify your team when a client metric moves outside its normal range.
Databox Integrations
Databox offers 130+ native integrations, including Google Analytics 4, HubSpot, Google Ads, Facebook Ads, Google Sheets, Shopify, Salesforce, Pipedrive, and Jira. It also connects to BigQuery and Snowflake, with a no-code REST API builder and REST API for custom data integrations.
Pros and Cons
Pros:
- Live links keep client dashboards current
- Scheduled reports cut repetitive client reporting
- Reusable templates speed client dashboard setup
Cons:
- Refresh delays can disrupt client reporting
- Report layouts can constrain agency branding

Swydo
Best for moving established agency portfolios
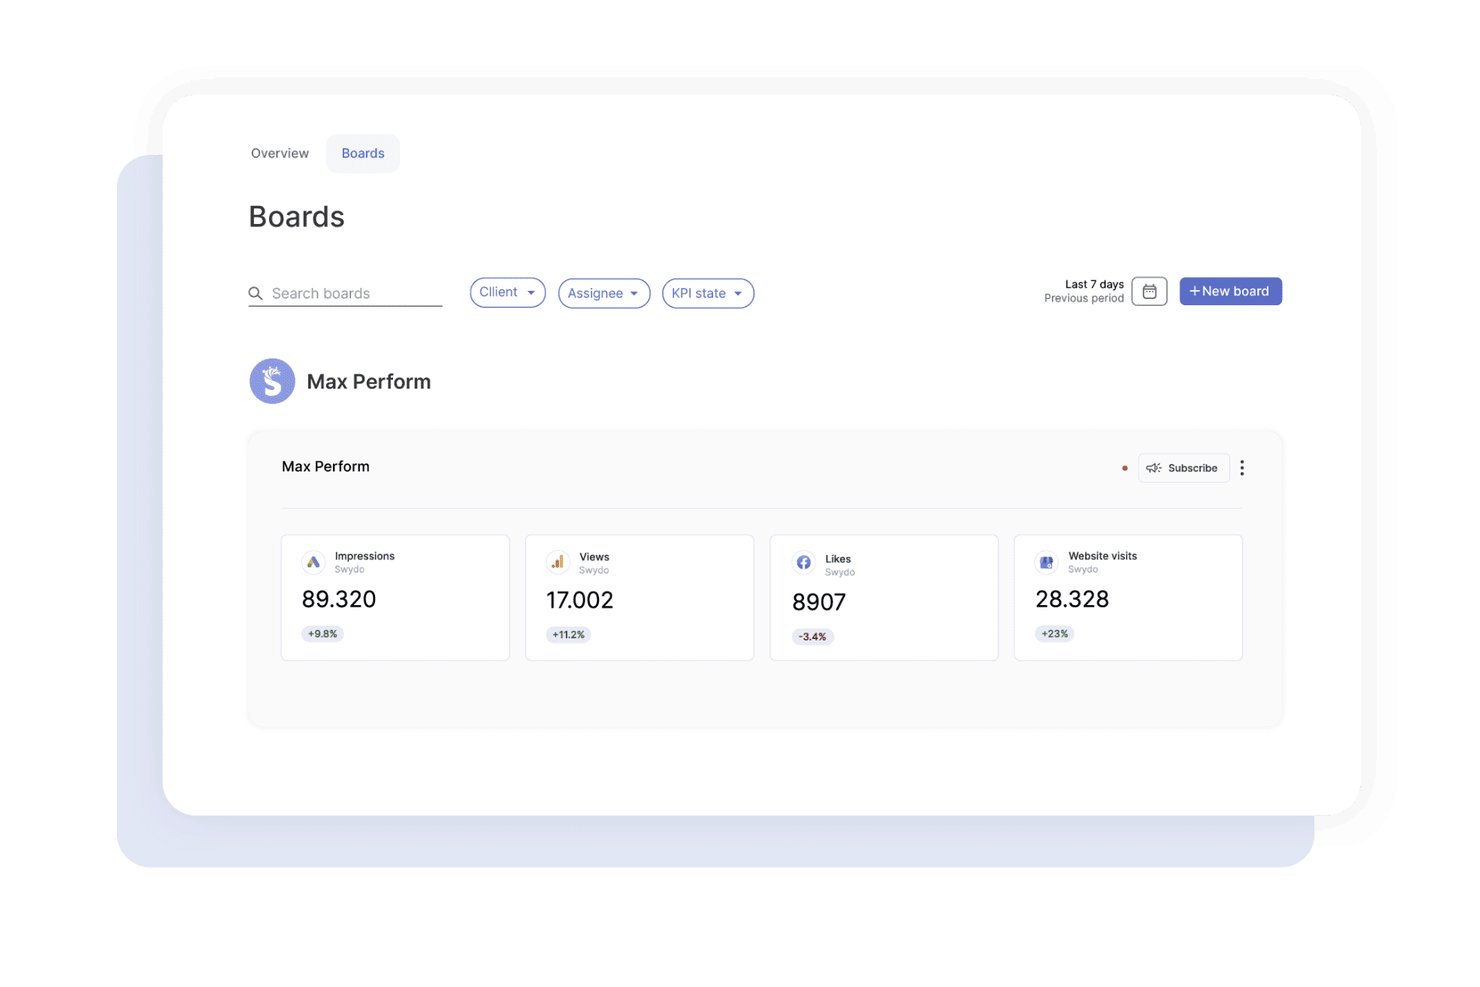
Swydo is an automated marketing reporting platform built for online agencies, combining white-labeled client reports, live dashboards, scheduled delivery, and cross-channel data consolidation across 38+ integrations.
Who Is Swydo Best For?
Swydo is a strong fit for digital marketing agencies that manage multiple client accounts and need white-labeled, automated reporting across channels like Google Ads, Meta, and TikTok.
Why I Picked Swydo
Swydo earns its spot on my shortlist because of how well it handles moving an established agency portfolio without starting from scratch. Its free full-account migration service completes the transition in 3–7 days, and linked master templates let you push updates across every client report at once. I also rely on its custom-domain publishing to keep reports on a branded URL from day one, so clients never notice the switch happened.
Swydo Key Features
- AI report builder: Prompt AI in plain language to add, remove, or reorganize widgets, sections, and visualizations directly inside a report.
- Goal tracking: Set targets for conversions, ROAS, or revenue and receive email alerts when a KPI falls below its threshold.
- Client monitoring boards: Build custom boards with KPIs, tables, and target thresholds to track performance across your entire client portfolio at a glance.
- Multilingual report generation: Produce client reports in any of 14 available languages, with editable translations for localized delivery.
Swydo Integrations
Swydo offers 38+ native integrations, including Google Ads, Google Analytics 4, Facebook Ads, LinkedIn Ads, TikTok Ads, Google Sheets, HubSpot, Semrush, MailChimp, and Google Search Console.
Pros and Cons
Pros:
- Scheduled reporting reduces repetitive work
- Master templates update linked reports
- Polished white-label client reports
Cons:
- Failed reports require support to rerun
- Duplicate client connections increase source-count overhead

Best for tying ad spend to billable hours
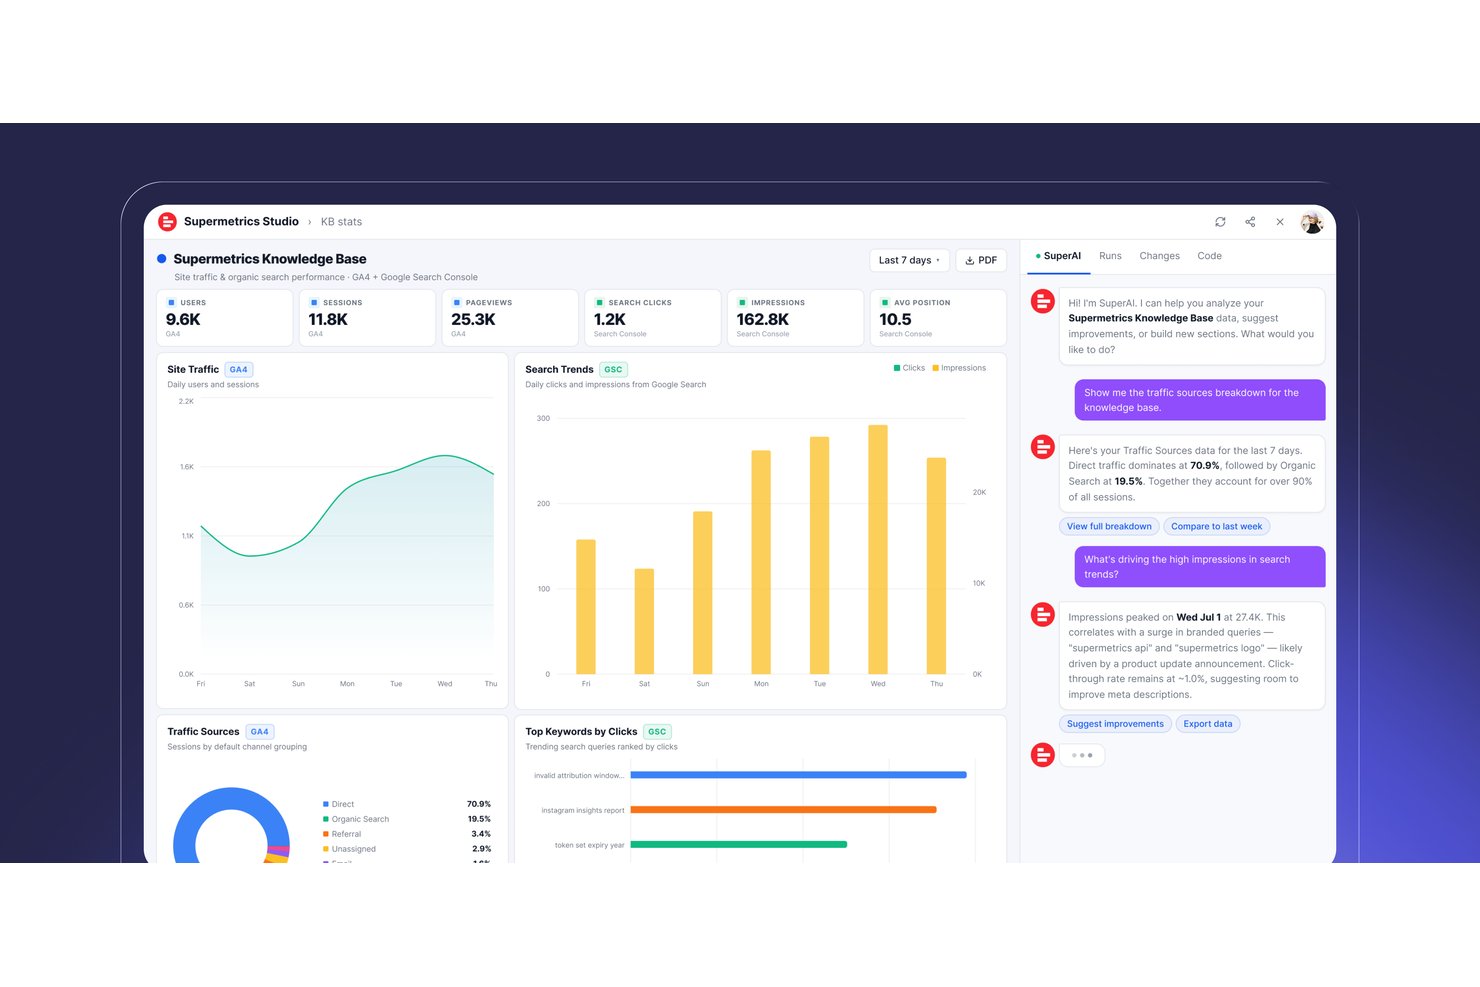
Supermetrics is a marketing intelligence platform that pulls data from 150+ ad, analytics, CRM, and ecommerce sources and routes it into dashboards, spreadsheets, BI tools, and data warehouses for agency reporting.
Who Is Supermetrics Best For?
Supermetrics is a strong fit for digital marketing agencies that need to pull data from dozens of ad and analytics platforms into a single, shareable client report.
Why I Picked Supermetrics
Supermetrics earns its spot on my shortlist because it's one of the few tools that can pull ad spend data from 150+ sources and connect it directly to time-tracking data via its Clockify connector, letting you see billable hours alongside campaign costs in a single report. I like that you can build budget-pacing dashboards that show planned versus actual spend, then share them with clients through Supermetrics Studio with role-based permissions. The AI-generated executive summaries are a genuine time-saver when prepping client calls.
Supermetrics Key Features
- Multi-client workspace management: Set up dedicated workspaces for each client to keep data, dashboards, and connections separate across your portfolio.
- Natural-language dashboard editing: Edit live dashboards through conversation, adding filters, adjusting controls, or updating design and copy without manual configuration.
- Connector Builder: Build low-code connectors for private APIs or data sources not yet covered by Supermetrics' native integrations.
- Role-based dashboard permissions: Assign owner, editor, or viewer roles to control who can edit dashboards, manage campaigns, or view client data.
Supermetrics Integrations
Supermetrics offers 150+ native data-source integrations, including Google Ads, Facebook Ads, LinkedIn Ads, TikTok Ads, Google Analytics 4, HubSpot, Shopify, Salesforce, Google Sheets, and Looker Studio. Its Marketing Data API supports custom integrations.
Pros and Cons
Pros:
- AI summaries help explain campaign performance
- Scheduled reports cut repetitive manual updates
- Consolidates campaign data across client accounts
Cons:
- Connector failures can disrupt client reporting
- Google Sheets scheduling quotas constrain scale

Power BI
Best for advanced enterprise analytics
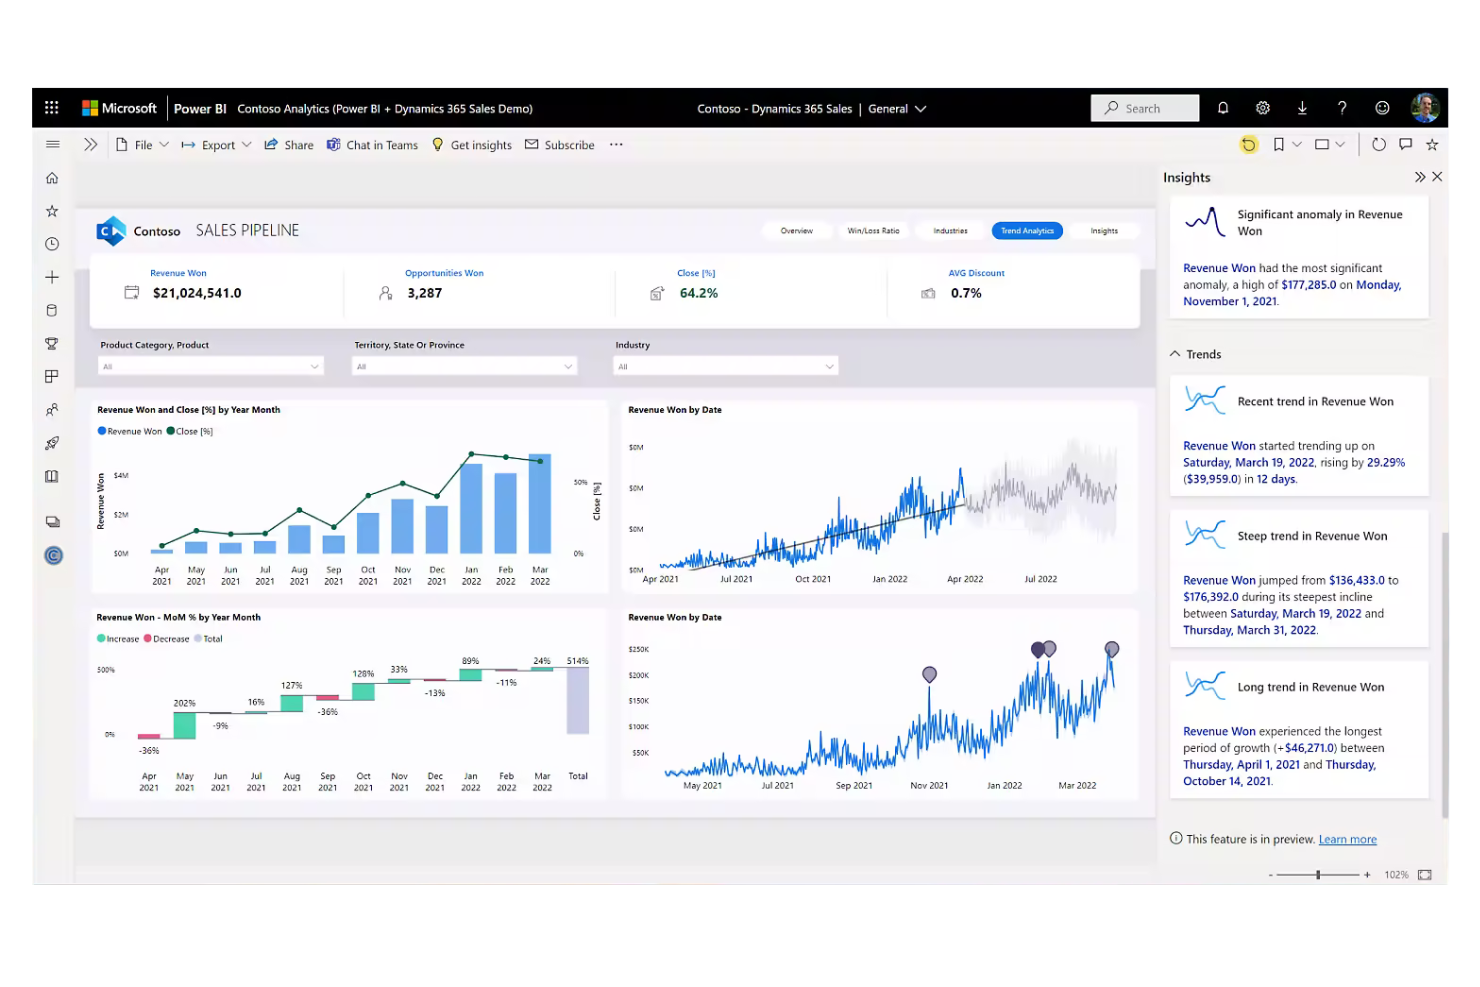
Power BI is Microsoft's business intelligence platform that connects data from dozens of sources—including Google Analytics, Salesforce, and Marketo—and transforms it into interactive reports, dashboards, and embedded analytics.
Who Is Power BI Best For?
Power BI is a strong fit for enterprise teams and large agencies that already work within the Microsoft ecosystem and need to analyze data across many sources at scale.
Why I Picked Power BI
Power BI earns its spot on my shortlist because it handles enterprise-scale analytics in a way that few tools can match, pulling data from sources like Google Analytics, Salesforce, Adobe Analytics, and Marketo into a single semantic model you can query and visualize at depth. I particularly like its row-level security, which lets me control exactly what each stakeholder sees across shared dashboards without duplicating reports. Copilot's AI-generated narrative summaries also save real time by surfacing written trend explanations directly inside a report.
Power BI Key Features
- Row-level security (RLS): Restricts which rows of data each user sees within a shared report using role-based DAX filters.
- Subscription-based report delivery: Sends scheduled email snapshots of reports or dashboards to named recipients at hourly, daily, weekly, or monthly intervals.
- Power BI Embedded: Lets developers embed interactive reports and dashboards directly into external-facing applications under the application owner's own branding.
- Connector library: Pulls data from sources including Google Analytics, Adobe Analytics, Salesforce, Marketo, Asana, Smartsheet, and Snowflake into a single semantic model.
Power BI Integrations
Power BI offers native integrations with Google Analytics, Adobe Analytics, Salesforce, Marketo, Asana, Smartsheet, Google Sheets, and Snowflake. It also connects with Microsoft 365, Azure, and SQL Server, with a REST API for custom integrations.
Pros and Cons
Pros:
- Row-level security separates client data views
- Interactive dashboards make client trends explorable
- Scheduled snapshots cut recurring report upkeep
Cons:
- Embedded branding lacks per-client automation
- External sharing can add licensing friction

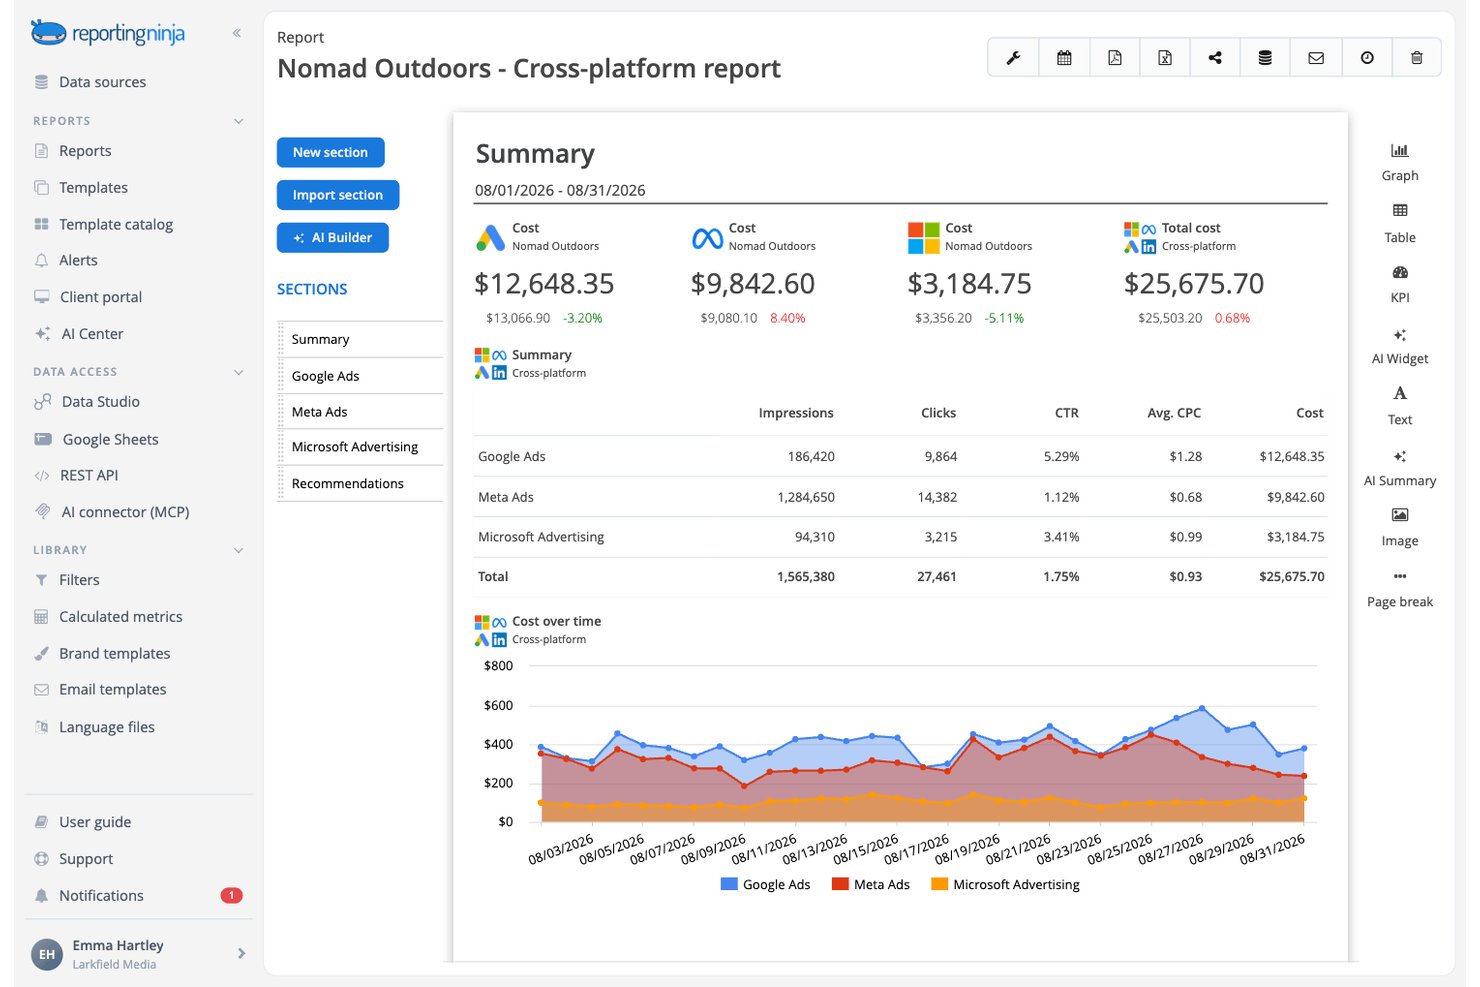
Reporting Ninja is a marketing report builder that lets agencies connect cross-channel data sources, build branded client reports, automate scheduled delivery, and share live dashboards through a white-labeled client portal.
Who Is Reporting Ninja Best For?
Reporting Ninja is a strong fit for marketing agencies that manage multiple client accounts and need a consistent, branded reporting workflow across all of them.
Why I Picked Reporting Ninja
I picked Reporting Ninja as one of the best because it's purpose-built around keeping client reports consistent at scale. Its brand templates let you lock in a client's logo, colors, and fonts once, then apply that treatment automatically across PDFs, share links, and the client portal. Pair that with template-based report duplication and scheduled delivery, and you can spin up a new client report, assign their accounts, and automate recurring sends without rebuilding anything from scratch.
Reporting Ninja Key Features
- AI report builder: Generate a full report structure, widgets, and data sources from a natural-language prompt before committing to the layout.
- Conditional scheduling: Set a scheduled report to send only when a specific metric meets a defined condition, reducing unnecessary client deliveries.
- Cross-platform widgets: Combine advertising data from multiple channels—such as Google Ads, Meta Ads, and LinkedIn Ads—into a single shared widget within one report.
- Share links: Distribute a live report via a password-protected link that clients can view without logging into the portal.
Reporting Ninja Integrations
Reporting Ninja offers native integrations with Google Analytics, Google Ads, Meta Ads, LinkedIn Ads, TikTok Ads, HubSpot, Mailchimp, Shopify, Google Sheets, and Microsoft Excel. Its REST API supports custom integrations, while Data Studio connectors and an MCP connector extend reporting access.
Pros and Cons
Pros:
- White-labeling supports polished client deliverables
- Scheduled sends reduce repetitive reporting work
- Reusable templates standardize client reporting
Cons:
- Default summaries may need client-specific edits
- Deleting reports may remove prior deliveries

Best for business intelligence
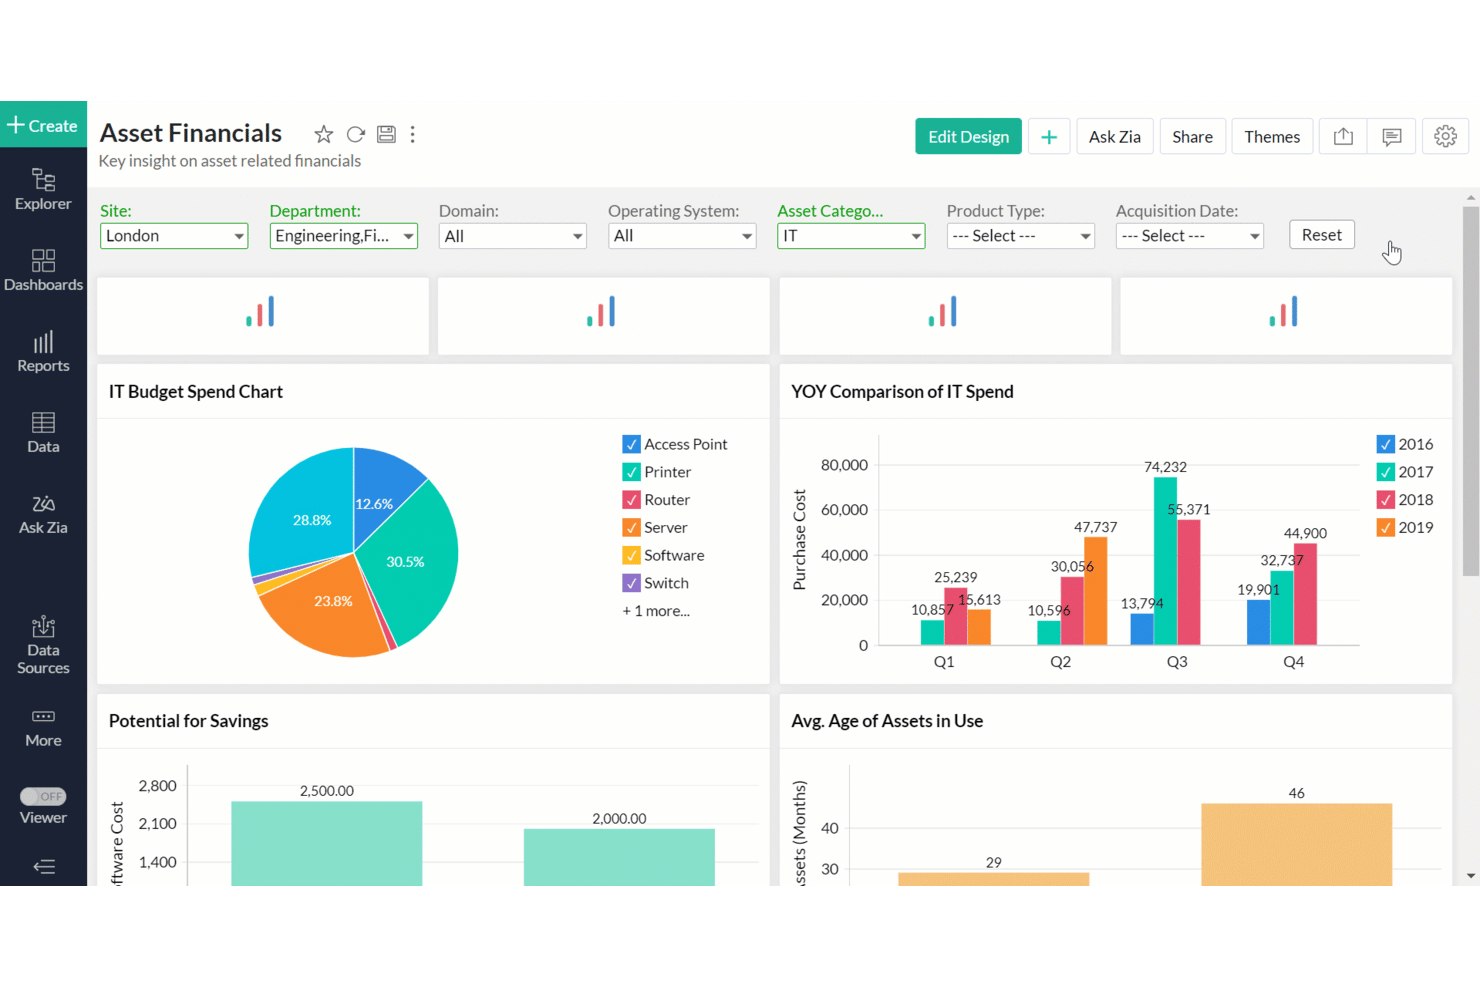
Zoho Analytics is a business intelligence and analytics platform that connects data from 500+ sources, blends multi-platform datasets, and delivers white-label client dashboards, automated report scheduling, and prebuilt marketing and project analytics for agencies.
Who Is Zoho Analytics Best For?
Zoho Analytics is a strong fit for marketing agency owners who need white-label client dashboards, multi-source data blending, and affordable BI at scale.
Why I Picked Zoho Analytics
I picked Zoho Analytics as one of the best because it brings genuine BI depth to agency client reporting, particularly through its AI-powered Zia Insights, which generates descriptive, predictive, and diagnostic narratives directly on your dashboards. I also love the white-label portal setup, where you can configure a custom domain, logo, and favicon, then clone a prebuilt campaign dashboard across every client account rather than rebuilding from scratch. That combination of intelligent analysis and scalable client presentation is what earns it the business intelligence spot on my list.
Zoho Analytics Key Features
- Data blending: Combine data from multiple sources—like Google Ads, Mailchimp, and Jira—into a single cross-platform report or dashboard.
- Email scheduling: Send reports and dashboards to clients on daily, weekly, monthly, or yearly intervals as HTML or PDF exports.
- Row- and column-level permissions: Restrict what each shared user can see within a report using fine-grained read, write, export, and share access controls.
- Anomaly detection: Identify outliers and unexpected shifts in your data using machine-learning models, with alerts triggered when anomalies are detected.
Zoho Analytics Integrations
Zoho Analytics offers 30+ native marketing integrations, including Google Analytics 4, Google Ads, Facebook Ads, LinkedIn Ads, Mailchimp, Klaviyo, HubSpot Marketing, Semrush, Jira Software Cloud, and monday.com. It also supports REST APIs, JavaScript APIs, client SDKs, and custom connectors.
Pros and Cons
Pros:
- Share dashboards with granular client permissions
- Clone campaign dashboards across client accounts
- White-label portals separate client workspaces
Cons:
- Dashboard layout control draws reviewer complaints
- Scheduled dashboards arrive as static exports
New Product Updates from Zoho Analytics

Zoho Analytics Adds Exogenous Variables to Multivariate Forecasting
Zoho Analytics introduces exogenous variables for multivariate forecasting using the VARX model. This helps forecasts account for external drivers such as marketing spend, discounts, and seasonality. For more information, visit Zoho Analytics’ official site.
 .
Other Agency Reporting Software
Below is a list of additional agency reporting software that I shortlisted, but did not make it to the top list. Definitely still worth checking them out!
- Semrush
For competitor research
- Klipfolio
For spreadsheet-powered custom dashboards
- ReportGarden
For customizable marketing dashboards
- SE Ranking
For tracking SEO and AI search visibility
- TapClicks
For reporting tied to campaign workflows
- Raven Tools
For reports alongside SEO campaign tools
- NinjaCat
For AI-powered marketing reports
- Google Data Studio
For data visualization
- Octoboard
For client PPC cost calculations
- Porter
For agencies keeping existing dashboards


Related Project Management Software
If you still haven't found what you're looking for here, check out these tools closely related to project management software that we've tested and evaluated.
- Resource Management Software
- Workflow Management Software
- Time Tracking Software
- Task Management Software
- Collaboration Tools
- Productivity Tools
How I Evaluate Agency Reporting Software
I evaluate agency reporting tools in two layers: the baseline features a tool must have—like white-label dashboards and profitability tracking—and the differentiators that set the best apart.
Core Functionality (Table Stakes For This List)
When I'm selecting tools for my list, I rank each one on a scale from 0 (does not offer the functionality) to 5 (excels in this area) for each core functionality listed below. Then, I calculate the tool's total score into a percentage. Each tool needs to achieve a minimum total score of 65% to be considered for inclusion.
- Client Reporting Dashboards: I look for configurable dashboards that let you display project timelines, deliverables, and KPIs in a format your clients can actually understand without a walkthrough.
- Multi-Source Data Integration: The tool should pull data from the PM, time tracking, and finance tools your agency already uses—think Asana, Harvest, or QuickBooks—without manual exports.
- White-Label Branding: I check whether you can apply your agency's logo, colors, fonts, and even a custom domain so reports look like they came from your team, not a third-party platform.
- Automated Report Scheduling: I evaluate how easily you can set up recurring report sends—like a weekly status email to a retainer client—without manually exporting and attaching files each time.
- Project Profitability Tracking: Budget vs. actuals, billable hours, and margin data should be reportable at the project or client level so you can spot underperforming accounts before they erode margins.
- Resource & Utilization Reporting: The platform should surface who's overbooked, who has capacity, and how billable vs. non-billable time breaks down across your team and active projects.
Once I have a list of tools that meet this criteria, I consider what sets each platform apart.
Differentiating Factors (What Sets Vendors Apart)
Here's how I compare and contrast different vendors:
Standout Features
I look for client portals that give stakeholders a live, self-service view of project progress—this cuts down on ad hoc status requests. Cross-client portfolio views matter too, especially for agency leaders who need roll-up metrics across dozens of active accounts. A drag-and-drop custom report builder with calculated fields and reusable templates is what separates tools that scale with your client roster from ones you'll outgrow in a year.
Beyond Features
Integrations with agency-staple tools like Asana, Harvest, and QuickBooks matter because a reporting platform is only as useful as the data it can pull in. I also evaluate how well pricing scales with agency growth—whether a platform charges per seat, per client, or per report affects long-term cost as your roster expands. Security is another factor I check closely, since agencies handle sensitive client data and need role-based access controls to keep internal views separate from client-facing ones.
How To Choose Agency Reporting Software
As you work through your own unique software selection process, keep the following points in mind.
- Integration Capabilities: One of the primary considerations when choosing agency reporting software is its ability to integrate with various data sources. Agencies often use multiple platforms such as Google Ads, Facebook Ads, LinkedIn Ads, and Google Analytics. The software should pull data from these sources to provide a view of marketing performance.
- Customization Options: Every agency has unique reporting needs, and the ability to customize reports is essential. Customization allows agencies to tailor reports to highlight specific metrics that matter most to their clients.
- Ease of Use: The software should be user-friendly, especially for team members with varying levels of technical expertise. An intuitive interface reduces the learning curve and enhances adoption across the agency.
- Real-Time Reporting: The ability to access up-to-date reports is invaluable for making timely decisions. Real-time data processing allows agencies to see the impact of their campaigns as they unfold, enabling quick adjustments to strategies.
- Support and Onboarding: Evaluating the responsiveness of the support team and the ease of onboarding is essential. A responsive support team can resolve issues quickly, which is especially important during reporting periods. Additionally, the software should offer onboarding resources to ensure smooth implementation.
Trends For Agency Reporting Software
Agency reporting software is changing and transforming how agencies oversee their data. As technology advances, staying informed about the latest developments is essential. Here are some key trends to watch that could impact your organization.
- AI-Driven Analytics: AI-driven analytics are becoming more prevalent. They offer deeper insights and predictive capabilities. This trend is important for making data-driven decisions.
- Real-Time Data Integration: Real-time data integration is gaining traction. It allows agencies to access up-to-the-minute information. This is important for timely and accurate reporting.
- Customizable Dashboards: Customizable dashboards are increasingly popular. They enable users to tailor their reporting views beyond the traditional spreadsheet. This trend enhances user experience and efficiency.
- Enhanced Data Security: Enhanced data security measures are being implemented. Protecting sensitive information is a top priority. This trend addresses growing concerns over data breaches.
- Mobile Accessibility: Mobile accessibility is on the rise. Users can now access reports from apps on any device. This trend supports remote work and flexibility.
These trends are shaping the future of agency reporting software by enhancing user experience, integrating advanced analytics, and improving collaboration features. As agencies seek more efficient ways to manage data and communicate insights, these developments pave the way for more effective reporting solutions.
What Is Agency Reporting Software?
Agency reporting software is designed to help marketing agencies collect, analyze, and present data from various campaigns and clients. It is commonly used by digital marketing agencies, advertising firms, and PR agencies to track performance metrics, generate reports, and provide client insights.
The primary components of agency reporting software include data integration, customizable reporting templates, and analytics dashboards. These features allow users to pull data from multiple sources, create tailored reports, and visualize key performance indicators to inform decision-making and demonstrate client value.
Features Of Agency Reporting Software
Agency reporting software helps agencies demonstrate their value to clients by automating and personalizing reports. Below are some of the most important features to look for in agency reporting software.
- Automated Reports: Automated reports save time by generating reports without manual intervention. This feature ensures that clients receive timely updates, enhancing efficiency, and client satisfaction.
- Customizable Dashboards: Customizable dashboards allow agencies to tailor the presentation of data to meet specific client needs. This flexibility helps deliver more relevant and personalized insights.
- White Label Branding: White-label branding lets agencies add logos and color schemes to reports. This feature enhances professionalism and reinforces the agency's brand identity.
- Client & Staff Management: Client and staff management features help organize and track user activities. This ensures everyone is on the same page and reduces the need for follow-up communications.
- SEO Tools: SEO tools provide insights into keyword rankings and site audits. These tools are essential for optimizing search engine performance and demonstrating the impact of SEO efforts.
- Multiple Integrations: Multiple integrations with various marketing platforms ensure prompt data collection. This feature allows agencies to pull data from different sources, providing a holistic view of campaign performance.
- Drag & Drop Report Builder: A drag & drop report builder simplifies creating customized reports. This feature allows agencies to mix and match metrics to tell a complete story, making reporting more efficient.
- Pre-Designed Templates: Pre-designed templates for reports and dashboards speed up the workflow. These templates ensure consistency across all client reports and save report generation time.
- Report Scheduling & Approval: Report scheduling and approval features allow agencies to set reporting frequencies and require approvals before sending reports. This ensures the accuracy and timely delivery of reports.
- Advanced Metrics Filters: Advanced metrics filters enable more granular data analysis. This feature helps present the most relevant insights, making reports more actionable.
By automating tasks, providing customization options, and integrating with multiple platforms, these tools help agencies deliver insightful reports that save valuable time.
Benefits Of Agency Reporting Software
Agency reporting software is designed to simplify the process of data collection, analysis, and presentation for marketing agencies. Below are five primary benefits of using reporting tools for users and organizations.
- Time Efficiency: Automated marketing reporting tools significantly reduce the time spent on manual data collection and report generation. This allows agency staff to focus more on strategic planning and client relationship management.
- Improved Accuracy: The software minimizes the risk of human error by automating data collection and report generation, ensuring that the data presented is accurate and reliable.
- Enhanced Client Reporting: The software provides detailed and custom reports that clearly illustrate the effectiveness of marketing strategies, helping to build client trust and satisfaction.
- Real-Time Data Processing: Many agency reporting tools offer real-time data processing. This allows marketers to see the impact of their campaigns as they unfold and make quick adjustments based on current data trends.
- Scalability and Flexibility: As agencies grow, the best marketing software can scale to accommodate increased data volume across marketing channels and more complex reporting needs. This ensures that it remains a valuable tool as the business expands.
By automating time-consuming tasks and providing real-time insights, these tools empower marketing teams to deliver better results and maintain a competitive edge in the market.
Costs & Pricing Of Agency Reporting Software
When choosing agency reporting software, it's essential to understand the available pricing plans and features. Software buyers often need clarity on the costs and features they can expect at each price point.
Below, I provide a detailed overview of typical plan options for agency reporting software.
Plan Comparison Table for Agency Reporting Software
| Plan Type | Average Price | Common Features |
| Free Plan | $0 | Basic reporting, limited data sources, and basic templates |
| Personal Plan | $29-79/month | More data sources, customizable templates, and basic automation |
| Business Plan | $79-179/month | Advanced data integrations, white-labeling, and automated report delivery |
| Enterprise Plan | Custom pricing | Full customization, advanced analytics, dedicated support, and unlimited data sources |
Buyers should carefully assess their unique needs and budget when considering each plan's features and price points to select the most appropriate option.
Agency Reporting Software FAQs
Still figuring out how agency reporting software can enhance your agency’s performance and efficiency? Here are some answers to frequently asked questions that should provide clarity.
How can I integrate agency reporting software with other tools and platforms?
Integrating agency reporting software with other tools and platforms typically involves using APIs (Application Programming Interfaces) provided by the software. Most advanced agency reporting software solutions offer API documentation that guides users through the process of connecting the software with other systems such as CRM, social media platforms, and analytics tools. Additionally, some software solutions come with built-in native integrations for popular tools, making the process smoother.
What are the best practices for customizing reports in agency reporting software?
Customizing reports in agency reporting software involves several best practices to ensure the reports are both informative and visually appealing. Start by identifying the key metrics, client data, and KPIs most relevant to your clients or stakeholders. Use the software’s customization features to tailor the report layout, including charts, graphs, and tables, to highlight these metrics. It’s also beneficial to use consistent branding elements such as logos and color schemes. Regularly update and review the report templates to ensure they align with the evolving needs of your clients.
How can I ensure data accuracy and reliability in agency reporting software?
Ensuring data accuracy and reliability involves several steps. First, verify that the data sources integrated with the reporting software are reliable and up-to-date. Regularly audit the data to identify and correct any discrepancies. Utilize the software’s data validation features to automate some of these checks. Additionally, training your team on best practices for data entry and management can help minimize errors. It’s also advisable to set up automated alerts for any significant data anomalies that may indicate issues.
What are the common challenges faced when using agency reporting software, and how can they be mitigated?
Common challenges include data integration issues, user adoption, and maintaining data accuracy. To mitigate these, thoroughly train all users to familiarize them with the software’s features and capabilities. Regularly update the software to benefit from the latest features and security patches. Establish clear protocols for data entry and management to maintain data integrity. Additionally, leverage customer support and community forums provided by the software vendor to troubleshoot and resolve any issues promptly.
How can I optimize the performance of agency reporting software?
Optimizing the performance of agency reporting software involves several strategies. Regularly update the software to the latest version to benefit from performance improvements and bug fixes. Optimize data queries and reports to reduce load times, especially for large datasets. Ensure that your hardware and network infrastructure meet the software’s requirements. Additionally, consider using cloud-based solutions that can scale resources dynamically based on demand. Regularly monitor the software’s performance and address any bottlenecks promptly.
What security measures should be in place when using agency reporting software?
Security measures for agency reporting software should include data encryption, both in transit and at rest, to protect sensitive information. Implement role-based access controls to ensure that only authorized users can access specific data and features. Regularly update the software to patch any security vulnerabilities. Use multi-factor authentication (MFA) to add an extra layer of security. Additionally, conduct regular security audits and compliance checks to ensure that the software adheres to industry standards and regulations.
How can I leverage advanced analytics features in agency reporting software?
Advanced analytics features in agency reporting software can provide deeper insights into your data. Use predictive analytics to forecast trends and outcomes based on historical data. Implement machine learning algorithms to identify patterns and anomalies that may not be immediately apparent. Use data visualization tools to create interactive dashboards that allow users to explore data dynamically. Additionally, consider integrating third-party analytics tools to enhance the software’s capabilities further.
What are the key considerations when scaling agency reporting software for a growing agency?
When scaling agency reporting software, consider the software’s ability to handle increased data volume and user load. Ensure that the software offers scalable infrastructure, such as cloud-based solutions, that can grow with your agency. Evaluate the cost implications of scaling, including any additional licensing fees or resource costs. Additionally, consider the software’s flexibility in integrating with new tools and platforms as your agency’s needs evolve. Regularly review and optimize your reporting processes to ensure they remain efficient and effective as you scale.