Critical Path Method Guide: How To Use It + Examples

The critical path method is a technique used to identify the longest sequence of dependent tasks (critical path) in a project and determine the shortest time to complete them.
However, to find your critical path, you need to have an understanding of each and every task, deadline, and dependency in your project. It’s not easy, but it is important to go through the steps to get it right. This guide will walk you through each step of the process.
What Is The Critical Path Method?
The Critical Path Method (CPM) is a scheduling technique used in project management and other industries to:
- Identify the critical path in a project
- The minimum time needed to complete a project.
Critical Path Example
Before we discuss the steps and calculations you'll need to make, let me take you through a quick visual example.
The diagram below has the letters A through P. A and P represent the project start and end, respectively. Meanwhile, the number beside each letter represents that activity’s duration in days.
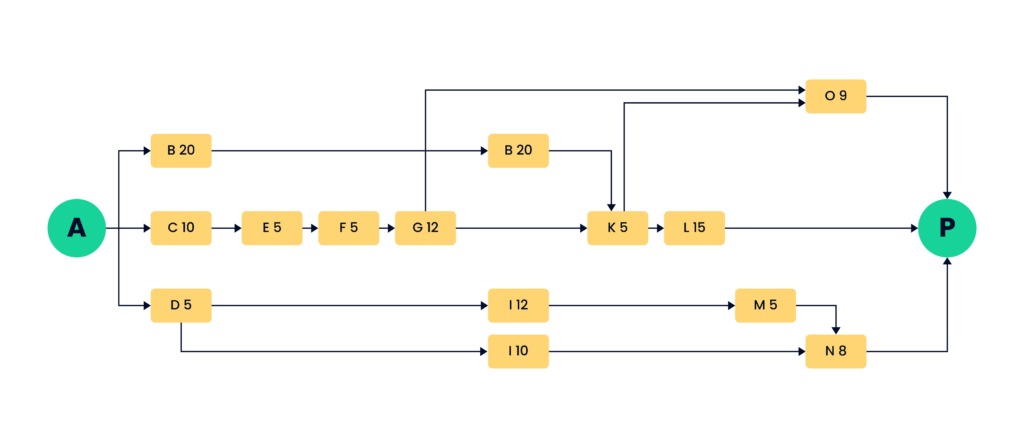
As you can see, there are multiple paths from A to P. To find the critical path, you need to compute the total duration of every path by adding the individual task durations.
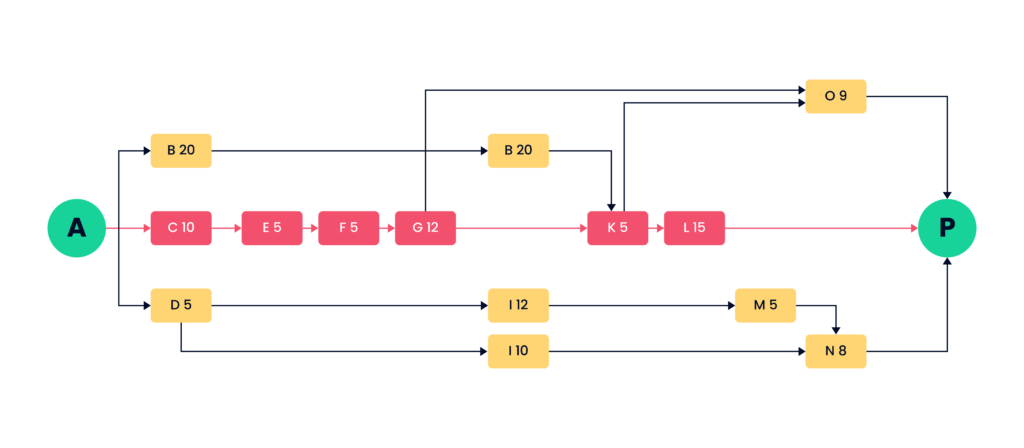
What you are looking for is the path that takes more days to complete. In this example, path “A-C-E-F-G-K-L-P,” which has a duration of 52 days, is the critical path.
How To Find The Critical Path For Your Project
The activities on the critical path are called critical activities, they depend on a predecessor to occur and, therefore, have the least flexibility among all other activities. Any delays in these critical activities will almost always surely lead to project delays.
I know it is likely that you will be using project management software or project scheduling software to create project timelines and find your critical path, especially for complex projects. But it can be done without it (and I'll walk through it here!).
Here are the step-by-step instructions to find the critical path of your project.
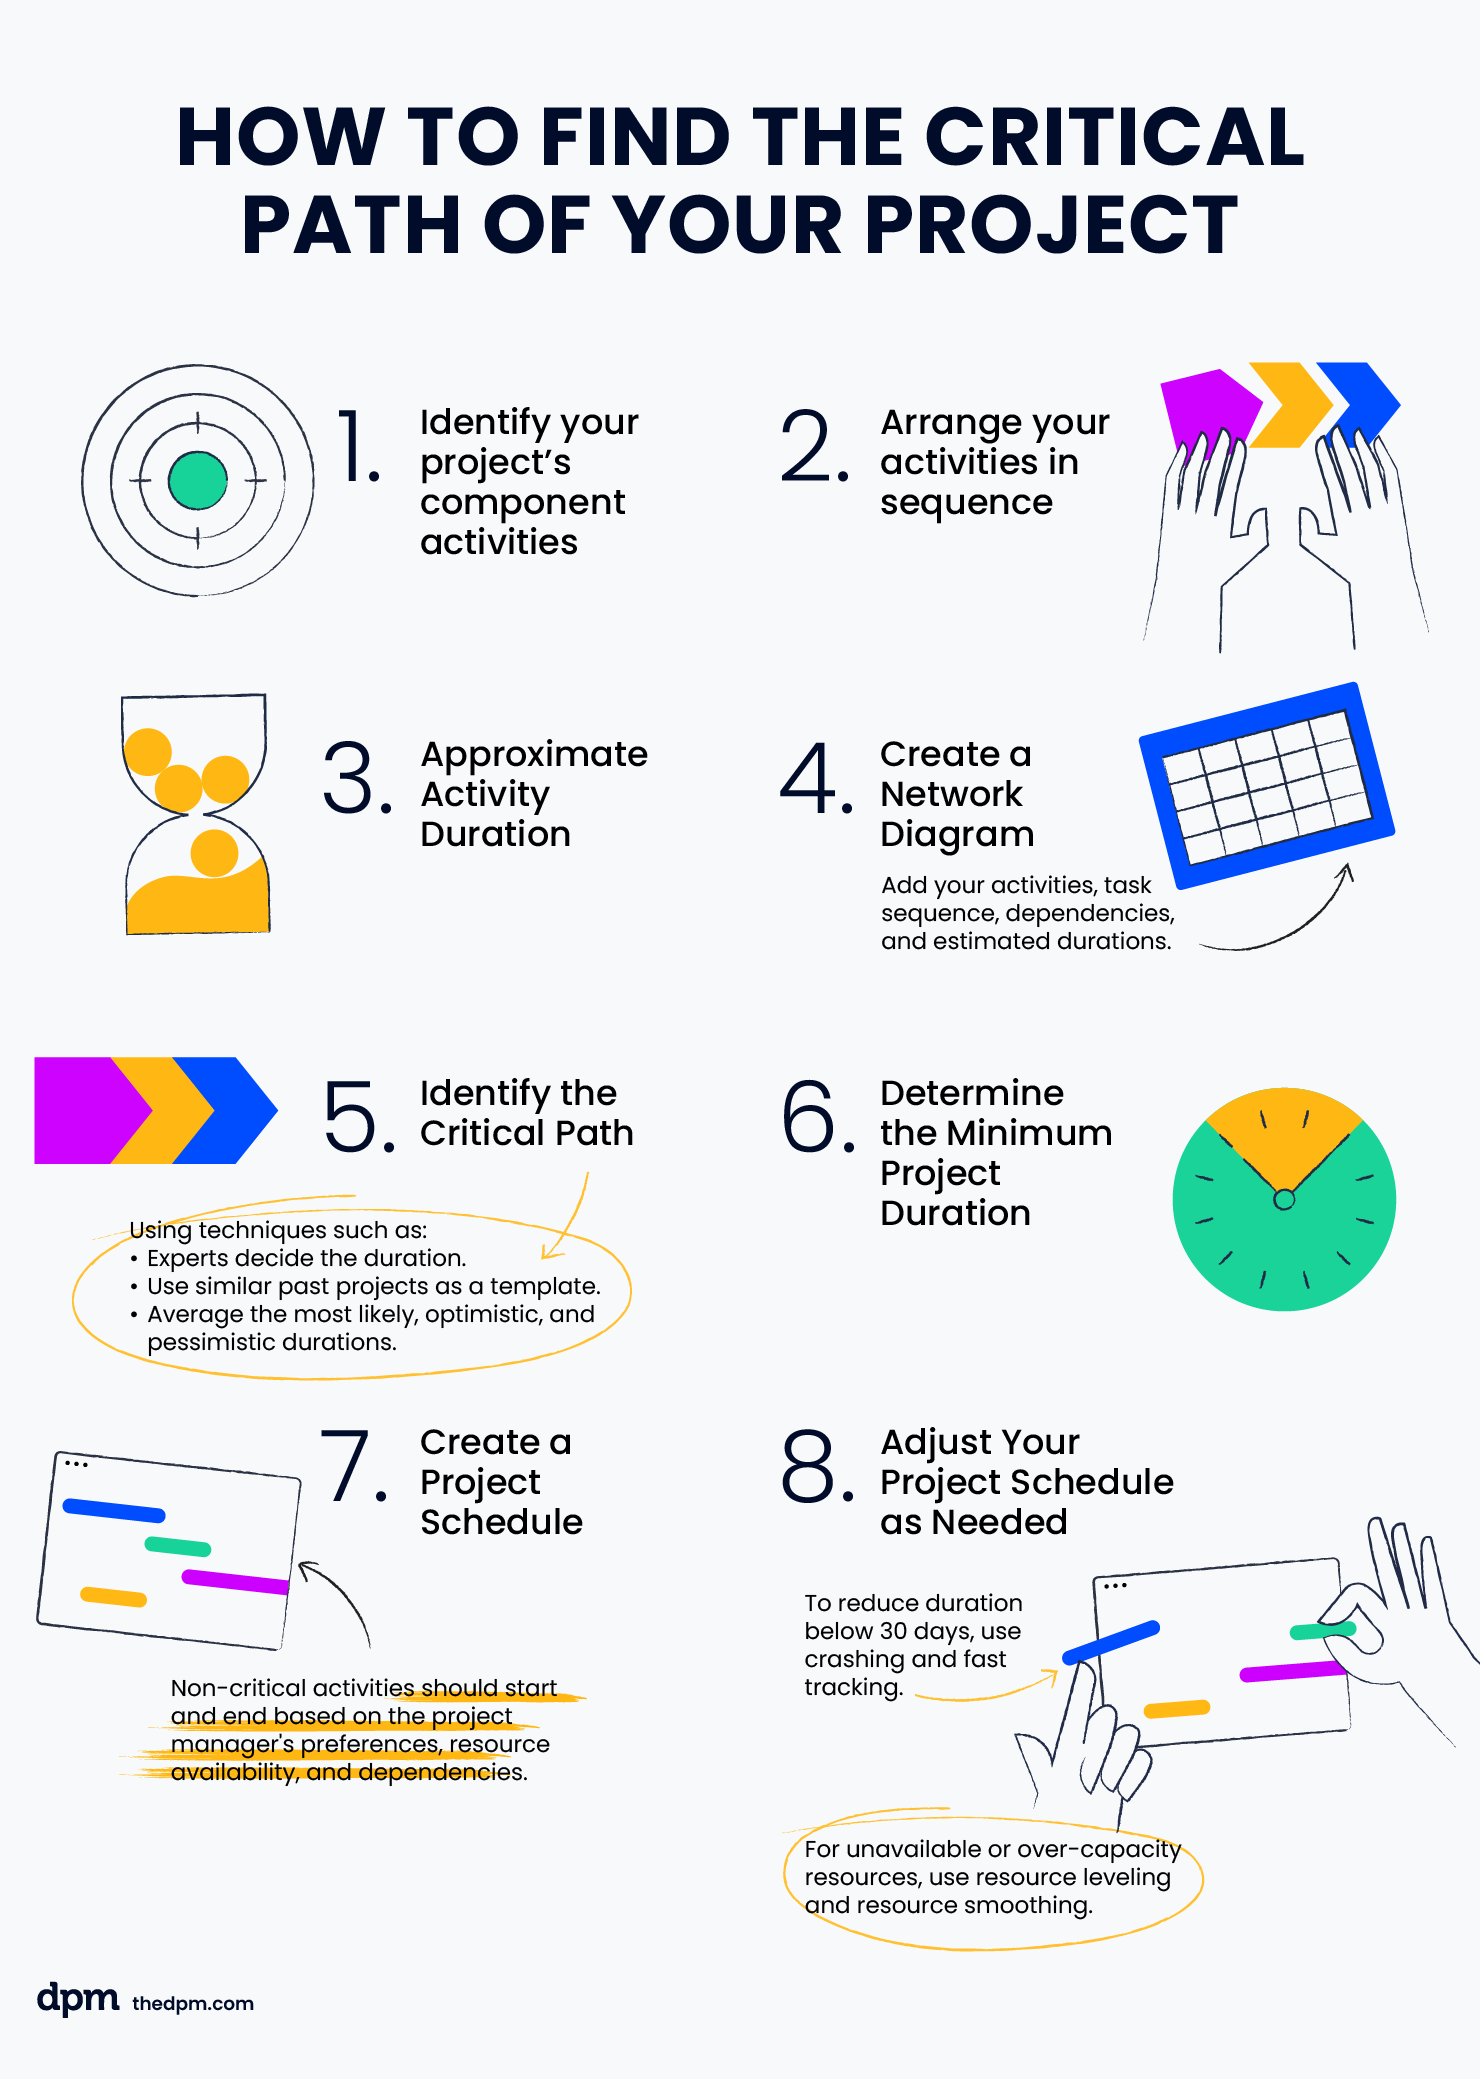
Step 1: Identify your project’s component activities
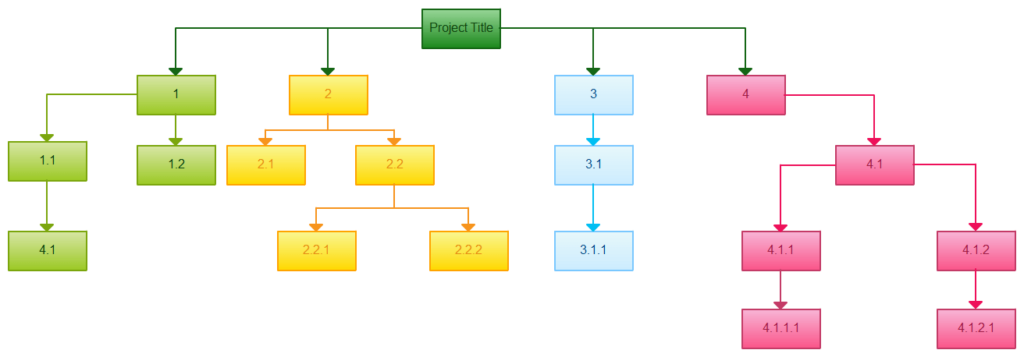
To start, identify the activities that make up your project. It would help greatly if you have previously created a work breakdown structure document. A WBS document will tell you which activities comprise your project and the sequence of activities.
Suppose you need to get an online magazine launched. The following might be your project’s component activities (there are many more activities that could be included; this has been simplified for our purposes).
THEME
- Theme selection
- Theme approval
CONTENT
- Content ideation
- Content writing
- Content approval
- Graphics ideation
- Graphics creation
- Graphics approval
SPONSORSHIP
- Pitch sponsorship proposal
- Create advertising content
- Close sponsorship deals
LAYOUT
- Magazine layout design
- Approval and sign-off
GOING LIVE
- Platform procurement
- Magazine upload
- Launch
Step 2: Arrange your activities in sequence
After identifying the individual tasks that make up your project, arrange the tasks in sequence. Which activity needs to go first? Which activities depend on others to be completed?
Using our online magazine publication example, the following are the tasks, arranged in sequence and with dependent tasks identified.
| TASKS | DEPENDENCIES |
|---|---|
| A. Theme selection | - |
| B. Theme approval | A |
| C. Content ideation | B |
| D. Content writing | C |
| E. Content approval | D |
| F. Graphics ideation | E |
| G. Graphics creation | F |
| H. Graphics approval | G |
| I. Pitch sponsorship proposal | H |
| J. Create advertising content | I |
| K. Closing sponsorship deals | H, I |
| L. Magazine layout design | B, E, H, I, J |
| M. Approval and sign-off | L |
| N. Platform procurement | M |
| O. Magazine upload | M, N |
| P. Launch | O |
Step 3: Approximate Activity Duration
Estimate the duration of each individual task using one or more of the following techniques.
- Expert judgment. An expert or a team of experts decides on the duration of an activity.
- Analogous estimation. Use a similar past project as a template for estimating the duration of your project or a similar past activity to estimate the duration of a particular activity.
- Parametric estimation. Combine historical data and current project parameters to estimate durations.
- Three-point estimation. Estimate the duration as the average of three possible durations: the most likely duration, the optimistic duration, and the pessimistic duration.
- Bottom-up estimation. Break the individual task into more specific sub-tasks. Then estimate an activity’s duration by aggregating the estimated durations of its component activities.
- Consensus decision making. Everyone involved in the project can decide, as a team, on individual activity durations. The lead can assign time estimates, perhaps using any or a combination of the techniques described above, and the project members can vote on duration values.
I should also mention that there is another similar technique you can use to evaluate how long tasks take when there is uncertainty—it's called PERT. Read about when to use PERT vs CPM.
Step 4: Create a Network Diagram
Knowing your activities, their sequence of tasks, dependencies, and estimated task durations, you can now plot your network diagram.
| TASK | DEPENDENCIES | ACTIVITY DURATIONS |
|---|---|---|
| START | - | - |
| A. Theme selection | - | 1 |
| B. Theme approval | A | 1 |
| C. Content ideation | B | 5 |
| D. Content writing | C | 15 |
| E. Content approval | D | 3 |
| F. Graphics ideation | E | 5 |
| G. Graphics creation | F | 10 |
| H. Graphics approval | G | 3 |
| I. Pitch sponsorship proposal | H | 10 |
| J. Create advertising content | I | 10 |
| K. Close sponsorship deals | H, I | 10 |
| L. Magazine layout design | B, E, H, I, J | 3 |
| M. Approval and sign-off | L | 3 |
| N. Magazine platform procurement | M | 3 |
| O. Magazine upload | M, N | 1 |
| P. Online magazine launch | O | 1 |
| END |
Step 5: Identify the Critical Path
Based on the simple network diagram, the critical path is A-B-J-K-L-M-O-P. The following are the critical path activities:
A. Theme selection
B. Theme approval
J. Create advertising content
K. Close sponsorship deals
L. Magazine layout design
M. Approval and sign-off
O. Magazine upload
P. Online magazine launch
Step 6. Determine the Minimum Project Duration
Use the critical path to identify the shortest possible project duration. As you can see from the table below, the critical path has a duration of 30 days. That’s also the minimum project duration.
| TASK | ACTIVITY DURATIONS (In Days) |
|---|---|
| Theme selection | 1 |
| Theme approval | 1 |
| Create advertising content | 10 |
| Close sponsorship deals | 10 |
| Design magazine layout | 3 |
| Approval and sign-off | 3 |
| Magazine upload | 1 |
| Online magazine launch | 1 |
| TOTAL | 30 |
Step 7: Create a Project Schedule
Now that you know the minimum project duration, you can create an initial project schedule. Use the chart from before to create a critical path schedule.
| TASK | DEPENDENCIES | ACTIVITY DURATIONS | EARLY START DATE | EARLY FINISH DATE |
|---|---|---|---|---|
| START | ||||
| A. Theme selection | - | 1 | 6/10 | 6/10 |
| B. Theme approval | A | 1 | 6/13 | 6/13 |
| C. Content ideation | B | 5 | ||
| D. Content writing | C | 15 | ||
| E. Content approval | D | 3 | ||
| F. Graphics ideation | E | 5 | ||
| G. Graphics creation | F | 10 | ||
| H. Graphics approval | G | 3 | ||
| I. Pitch sponsorship proposal | H | 10 | ||
| J. Create advertising content | I | 10 | 6/13 | 6/24 |
| K. Close sponsorship deals | H, I | 10 | 6/24 | 7/8 |
| L. Design magazine layout | B, E, H, I, J | 3 | 7/9 | 7/12 |
| M. Approval and sign-off | L | 3 | 7/13 | 7/16 |
| N. Magazine platform procurement | M | 3 | ||
| O. Magazine upload | M, N | 1 | 7/17 | 7/18 |
| P. Online magazine launch | O | 1 | 7/19 | 7/20 |
How about the non-critical activities? When must they start and end? That will depend mainly on the project manager’s preferences, resource availability, and activity dependencies.
As a case in point, activity E (content ideation) can only start after 13 June because it depends on activity D (theme approval). However, it doesn’t necessarily have to start on that date.
If the project manager doesn’t want to start then or if the content ideation team is unavailable on the said date, content ideation can begin at a later date.
Likewise, you must note that non-critical activities, when they are dependencies of critical activities, cannot finish later than the day before the dependent critical activity is scheduled to start.
Step 8: Adjust Your Project Schedule as Needed
Armed with your critical path schedule, you can now apply other project management techniques to shorten or optimize your schedule.
Do you need your project to take fewer than 30 days? You can apply schedule compression techniques like crashing and fast tracking.
Are the resources you need for your activities unavailable or over-capacity on the dates specified by the critical path methodology? You can apply resource optimization techniques such as resource leveling and resource smoothing to adjust your schedule.
Find out more about the main difference between resource leveling and resource smoothing here.
Step 9: Update Your Schedule According to Project Progress
This is something you need to do while the project is ongoing. If there are any changes in the CPM schedule—perhaps, there have been delays—you will need to update your schedule accordingly.
A Gantt chart is the ideal project management tool for progress updating. Thus, it will be best to plot your project on a Gantt chart after your critical path analysis has given you a viable schedule. Of course, you will need to have start dates and end dates for all activities in your project before you can create a Gantt chart of your project (likely using a Gantt chart maker tool).
How To Calculate The Critical Path
There are two phases to the critical path method calculation: the forward pass and the backward pass.
The Forward Pass
The forward pass identifies the early start and early finish dates of individual activities.
The Early Start Date
The early start date of any activity is the latest of the following:
- The project start date
- The early finish date of its predecessor activities, plus one day
- If the activity has more than one predecessor activity, the latest of all preceding activities’ early finish dates plus one day
- The date of applicable or existing “not earlier than” constraints (for instance, if a required resource for an activity will be available only on 13 June, that activity may start on 13 June or later but not earlier)
- The current date for the activity (the first day of the remaining schedule after the project has been updated)
The Early Finish Date
The early finish date, meanwhile, is the early start date plus the duration of the activity minus one day (to account for the start date being part of the activity duration). Of course, you may have to adjust the dates to account for weekends if work may proceed only during weekdays.
After determining the earliest start times and earliest finish times of all project activities, you need to perform the backward pass.
The Backward Pass
The backward pass will calculate the latest finish and start dates for all activities.
Visualize it this way. On the one hand, the forward pass helps you find the start and finish dates of activities beginning from the project start date. On the other hand, the backward pass lets you estimate start and finish dates starting from the project end date. In other words, you work backward, thus the term backward pass.
Since you’re working from backward, the first thing you need to calculate is the late finish date.
The Late Finish Date
The late finish date is the latest date an activity can be completed without delaying the project schedule. It is the earliest of the following:
- The project finish date
- The late finish date of its successor activity minus one day; you subtract one day because a predecessor activity ends one day before its successor.
- If the activity has more than one successors, the earliest of all successor activities’ late finish dates minus one day
- The date of applicable or existing “not later than” constraints
The Late Start Date
You calculate the late start dates based on late finish dates. It’s just the late finish date minus the activity duration, plus one day. We must add one day because simply deducting the duration will give you a date one day before the actual start date. Adding one day, therefore, ensures the start date is part of the duration of each activity.
Calculating Float
Now that we have the early start and finish dates and late start and finish dates, we can calculate float. Total float is the number of days an activity may be delayed without delaying the entire project, while free float is how many days we may delay an activity without affecting the start date of its successor activity.
Float analysis will tell you which activities you can freely delay and by how many days. For instance, it will tell you immediately that critical activities (in bold) may not be delayed if you wish to finish on time; the total and free floats for critical activities are zero. You have more liberty to delay non-critical tasks.
CPM Calculators
Project management software should be able to help you identify the critical path, find the start and finish dates, and calculate floats. You can also use a critical path method calculator online.
This PERT (Program Evaluation and Review Technique) calculator or this CPM calculator will help you identify the critical path and the estimated project duration. Manually, you can plot your activities on a diagram, then once you see the paths from start to finish, you can just add the durations of the activities on every path. The path with the highest sum is your critical path.
Once you have identified your critical path, you can use Google Sheets to calculate dates, including the start and finish dates for every activity.
If you need to factor in resource allocation, try resource management software.
Formula for Calculating Dates and Floats
Remember the following formula:
Early Start Date = PS/PEF+1/NET
That’s the earliest of the project start date, the early finish date of the predecessor plus one day, or any of the not-earlier-than date constraints.
Early Finish Date = (ES + D) - 1
That’s the activity’s early start date plus the duration, diminished by one day.
Late Finish Date = PF/SLF-1/NLT
This is the earliest of the project finish date, the late finish date of a successor activity minus one day, or a not-later-than date if any.
Late Start Date = (LF - D) + 1
This is the activity’s late finish date diminished by its duration, plus one day.
Total Float = LF - EF or LS - ES
This is an activity’s late finish date minus its early finish date. It can also be the late start date minus the early start date.
Free Float = (SES - EF) - 1
This is the successor activity’s early start date minus the activity’s early finish date then the difference diminished by one day.
Formula for Calculating Dates and Floats When Considering Workdays Only
If you are calculating only working days, you must use the WORKDAY and NETWORKDAYS functions. WORKDAYS calculates the date given a start date, duration, and any holidays or non-working days, while NETWORKDAYS counts the number of working days between two dates.
The following are the variations of the above formula, modified using WORKDAY or NETWORKDAYS.
Early Start Date = WORKDAY( PEF, 1, [holidays] )
This function calls for the start date (the predecessor’s early finish date), the duration (this should be one because the early start date is one day after the predecessor’s early finish date), and an optional holidays variable pertaining to any dates that you want considered as holidays (in date or serial format).
This should be unnecessary in case the early start date is the project start date or a not-earlier-than date.
Early Finish Date = WORKDAY( (ES-1), D, [holidays] )
Note that I include the one day deduction inside the function to ensure the resulting date will always be a workday.
Late Finish Date = WORKDAY( SLF, -1, [holidays] )
This function deducts one day from the late finish date of the successor activity and, if the answer is a weekend or a holiday, returns the preceding working day.
Late Start Date = WORKDAY( (LF+1), -D, [holidays] )
This function calls for the activity’s late finish date plus one day, the duration but turned into negative integers, and holidays or any other non-working dates.
I include the one day addition inside the WORKDAY function to ensure the resulting date will always be a workday.
Total Float = NETWORKDAYS( EF, LF ) - 1
This counts the number of working days from the activity’s early finish date to its late finish date. We diminish it by one because the function also counts the late finish date; we only need the difference.
Free Float = NETWORKDAYS( EF, SES ) - 2
This counts the number of working days from the activity’s early finish date to the successor activity’s early start date. We subtract two from the result: one to account for the one day deduction required by the original formula and another to remove the additional day the function introduces because it counts the early finish date, too.
Critical Path Method Resource Constraints
Let's walk through an example of what happens if the resources your activities need are unavailable in the schedule indicated by critical path analysis (CPA).
Resource availability, supply delivery schedules, stakeholder’s demands, and changing project scope are examples of resource constraints that can lengthen or shorten your critical path or alter it completely.
Let’s take a second look at this critical path example:
And let's plot this example on a Gantt chart to illustrate:
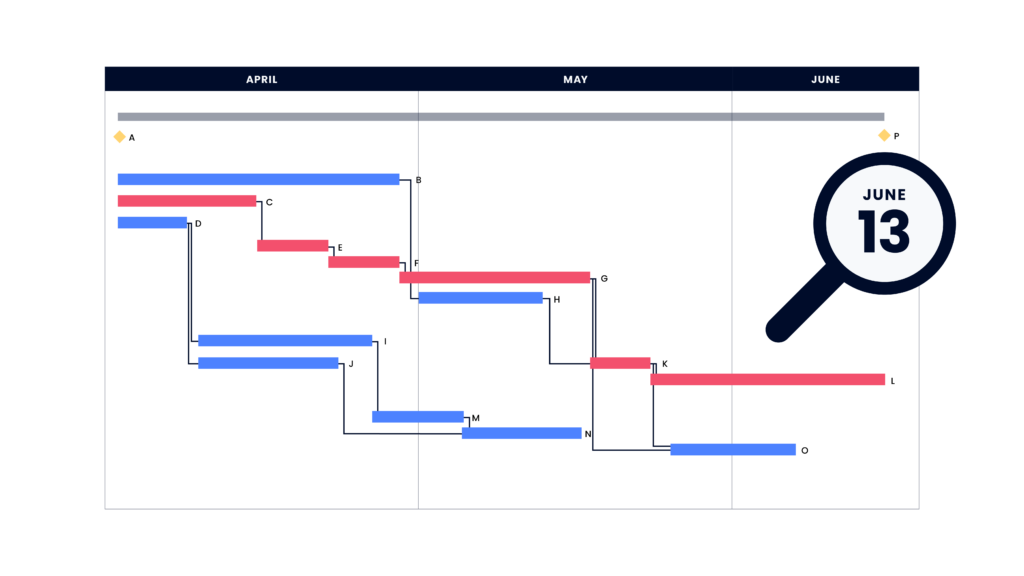
In this example, the project is set to start on April 1 and end on June 13. That’s a total of 52 workdays, which corresponds to the length of time it will take to complete all of the activities on the project’s critical path.
However, what if the person assigned to task E (which is supposed to start on April 15) has been assigned to another project and isn't available until April 20?
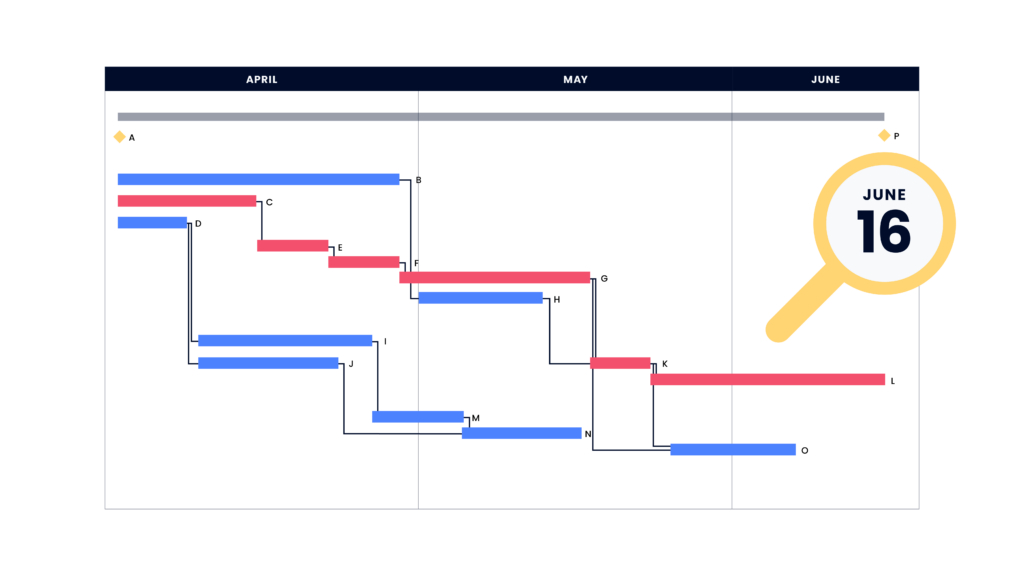
If no other person can take on task E, you can apply resource leveling techniques and adjust the schedule around that team member's availability.
This means pushing task E’s start date from April 15 to April 20, delaying task E and ultimately the project. The projected end date has now become 16 June instead of 13 June. Note that the critical path remains the same, but it has become longer.
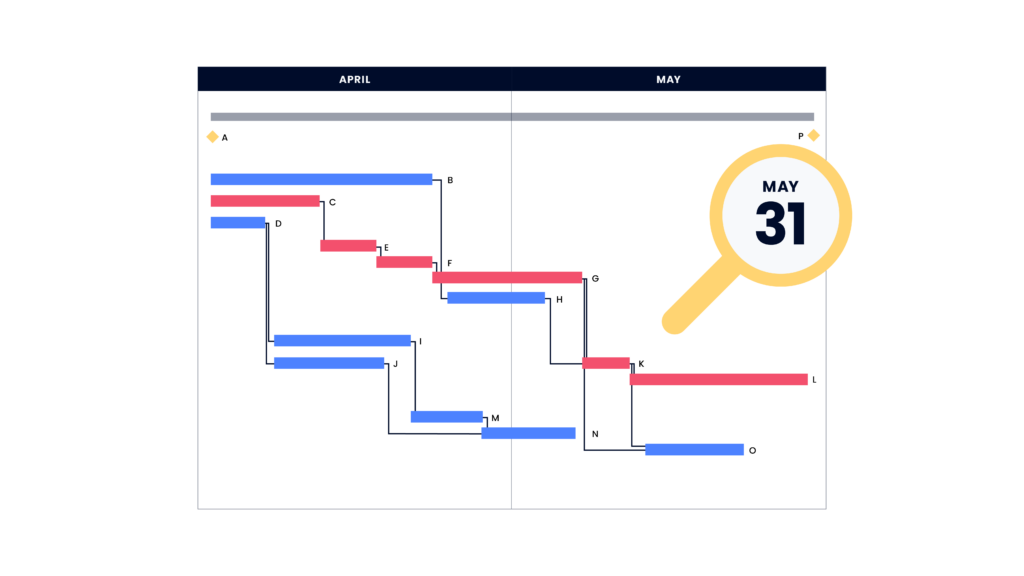
If extending the project end date isn't acceptable, you may have to apply schedule compression techniques like resource crashing and fast tracking to complete the project in a shorter period.
Crashing means adding more resources (such as people or equipment) to activities to shorten duration. Fast tracking involves performing some tasks in parallel.
In our example, suppose we double the number of people assigned to tasks G and L, shortening task G’s duration from 12 days to six and task L’s from 15 days to 8. This shortens the path duration from 55 days to 42 days.
We also bring forward task O so it will begin immediately after the preceding task K. This means task O ends one day later than task L, which changes the project’s critical path to A-C-E-F-G-K-O-P with a duration of 43 days.
What's Next?
Need more help with the critical path? Join the conversation in Slack with 100's of other digital project managers with DPM Membership!