Earned Value Management Defined: Formulas & Examples

The EVM Edge: EVM assesses project performance by evaluating scope, schedule, and resources. It provides clarity on budget and timelines by using dollar value as a base unit.
Beyond Simple Metrics: Relying solely on percentages of budget and time spent can mask true project performance—EVM reveals whether spending aligns with actual project completion.
Keep Stakeholders Onside: By using EVM and the right project management software tool, you can address stakeholder questions about budget adherence and timelines more accurately.
Earned Value Management (EVM) is a project management technique that assesses project performance and progress by evaluating measurements for scope, schedule, and resources.
It can help you more accurately answer stakeholder questions like:
- Are we on budget?
- Will we finish on budget?
- Are we spending as expected?
- Are we on schedule?
What Is Earned Value Management?
EVM allows you to report on both schedule and cost using a dollar value as a base unit. It provides an apples-to-apples guide to project status reporting.
Now I know you’re thinking: My project management tool tells me how far I am through the project and I know how far I am through the budget. Isn’t that enough?
Not always.
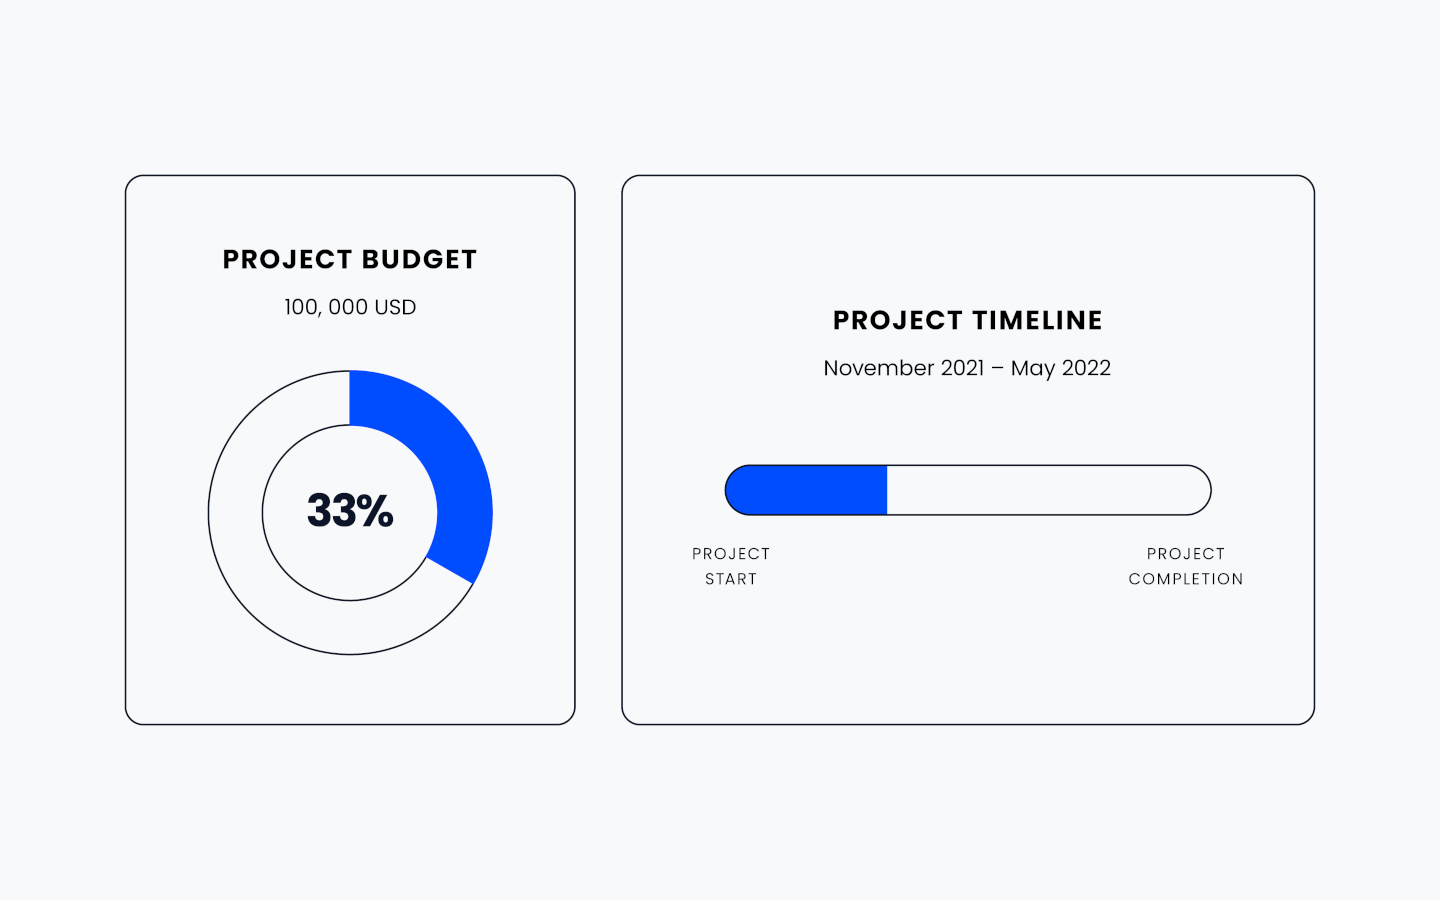
Let’s say you’re on Project ABC. The budget is $100,000 and it should take six months. We’ve just finished month two.
Simple logic would say that we should have spent 33% of the budget and should be 33% complete by this point. But that's not necessarily the full picture.
For example:
- A project team could use 33% of a budget without the project being 33% complete. For instance, maybe they were working with new technology and spent 33% of the budget and time on R&D, putting them behind on their planned progress.
- Maybe a project shouldn't have spent 33% of its budget during the first third of the project schedule. If the first 33% of the project plan was research and requirements elicitation run by a team of three, but the last 66% requires a team of 18 designers and developers, then the project budget is in trouble.
So instead, what we need to do is get a better understanding of the value we have created in the context of the time and budget we’ve invested.
What Do I Need To Calculate Earned Value?
To perform EVM and all its necessary calculations, we need the following data sets:
You’re also going to need to create a few tables to these together.
Planned Value
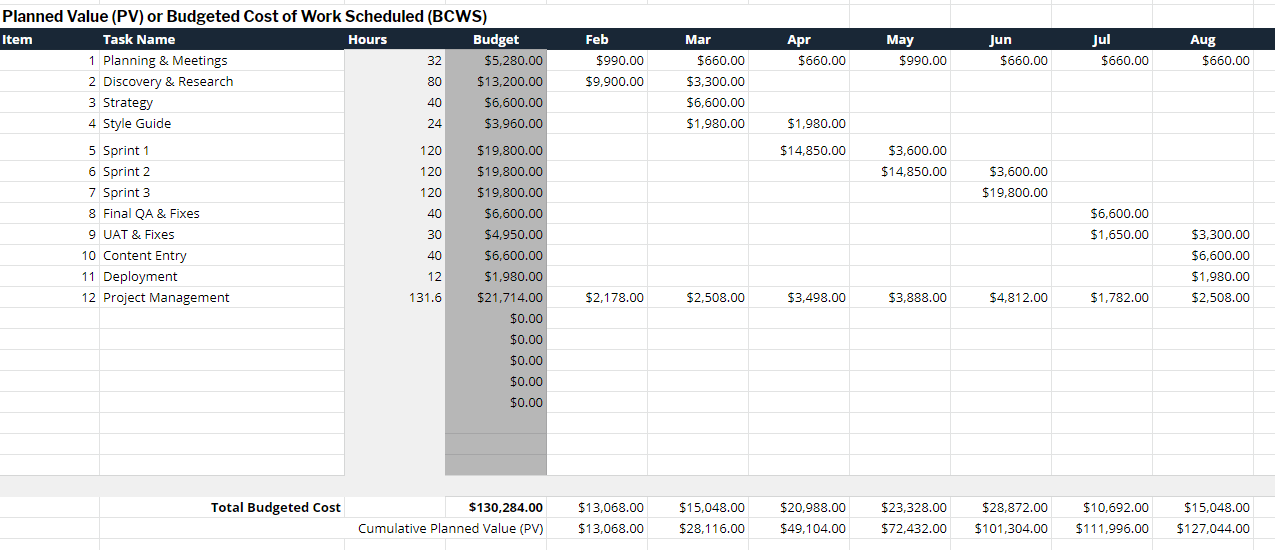
Planned value (PV) is the time-based project spend of a project. It breaks down the budget to show how it will be spent across the length of the project. The sum total of all planned work should add up to the total budgeted cost (TBC).
Here is an example of the PV table for a sample project:
A few things to keep in mind:
- According to the Project Management Body of Knowledge (PMBOK), your line items should line up with your work breakdown structure (WBS) itemized list. As a DPM, you may or may not have this. I find it best to use the same line items as you have in the estimate, as this will help you map everything back.
- Time phases can be months, weeks, or quarters.
- In the example above, project management costs are a percentage of work done. So the PM estimate is 20% of the sum of the other tasks’ hours. The monthly spend is therefore 20% of the sum of the budget for that month.
- For example: March
Planned work costs = $660 + $3300 + $6600 + $1980 = $12540
PM time = $12540 x 20% = $2508
- For example: March
- Cumulative planned value has the (PV) next to it. Whenever we talk about PV in the larger formulas, we’ll be looking at the cumulative amount.
Actual Cost
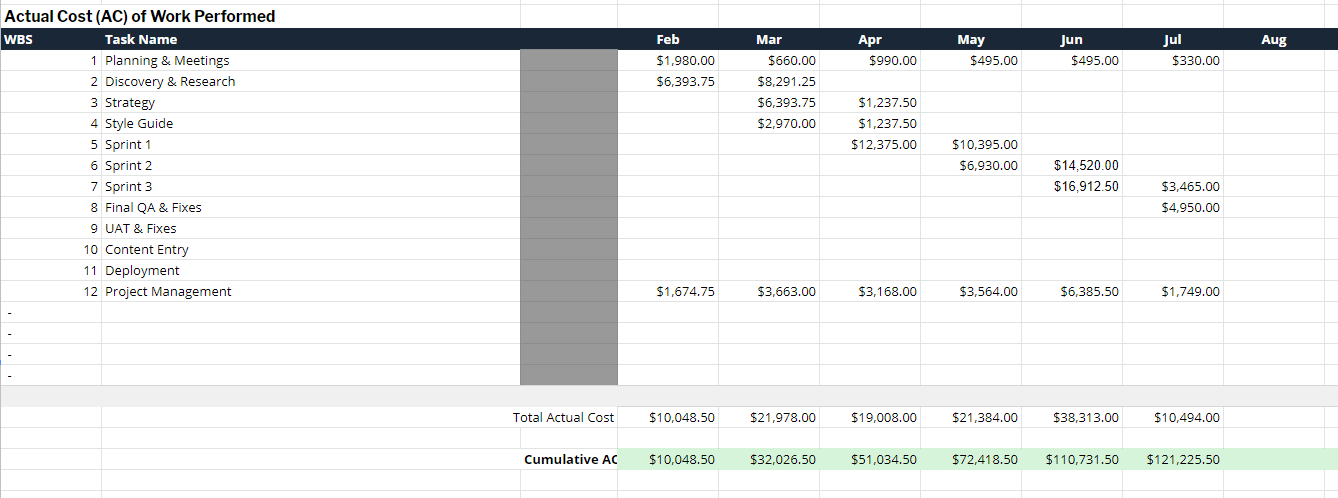
The actual cost (AC) is the budget spent to date on the project grouped in the same time-phased buckets. It’s important that the time phases are the same, to make sure we’re comparing apples to apples.
Here is an example of the AC table for the same sample project:
Keep in mind:
- Like with the PV, the cumulative value is what we’ll be using for the calculations.
- It’s easiest if you can pull this data directly from your project budget software or time tracking tool. This ties into another best practice of mine, which is setting up my budgets in the same way across all tools. Estimate, budget report, and earned value report should all have the same line items.
- It’s highly unlikely that your AC will directly match up to your PV because people aren’t perfect, and that’s okay.

Earned Value
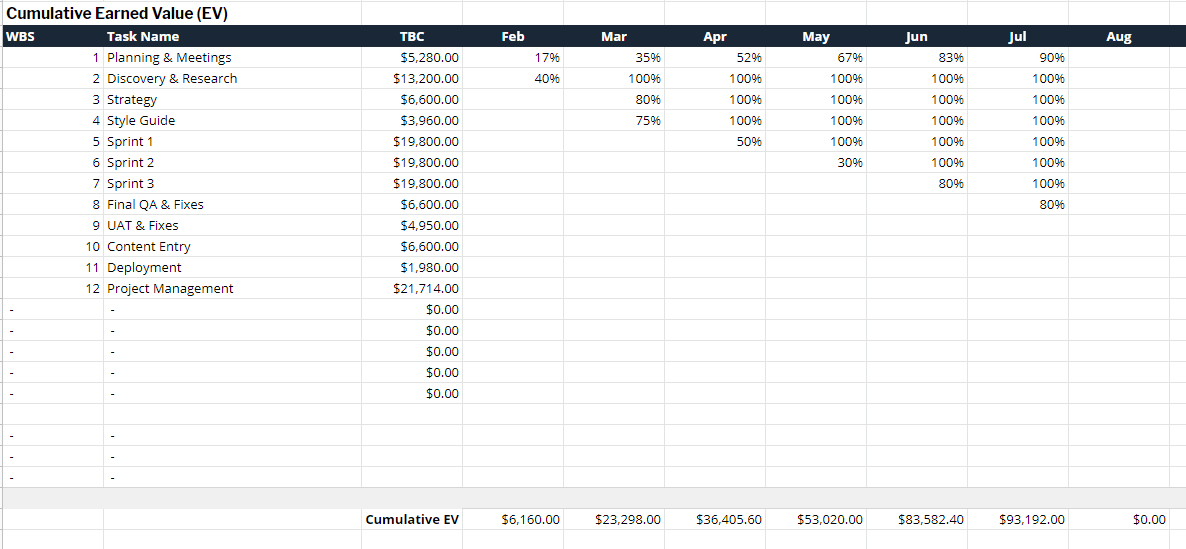
Earned value (EV) is the piece that ties all the calculations together. It allows you to put a dollar figure against the progress you’ve made through the project, in the same time-phased buckets which allows you to compare progress and dollar spend using the same base unit.
EV, at its core, is the product of the percent-complete and the budgeted cost of a task.
It's calculated using this formula: Earned Value EV = (PV)(%Complete)
Example of EV
If discovery & research has a budget of $13,200 and is 60% complete at the end of the month. We multiply 13,200 x 60% = 7,920.00
| Task Name | Budget | % Complete | EV |
|---|---|---|---|
| Discovery & Research | $13,200.00 | 60% | $7,920.00 |
I’ll get into how to determine the EV of a line item further down, but here is an example of the EV table for that sample project.
Keep in mind:
- We’ve kept the same time-phases for consistency.
- Once an item is completed, it remains at 100% for the remainder of the project.
- Like with the PV and AV, the cumulative value is what we need for the calculations.
What Are CPI and SPI?
The cost performance index (CPI) and schedule performance index (SPI) are both indicators of the health of your project.
Both indexes, as seen in the above section, involve dividing the EV over either AC or PV. The result of the division is either between 0 and 1, or above 1.
The closer the results are to 1, the closer we are to plan. The further away from 1 it is, the larger the discrepancy between the plan and current state.
For CPI, we divide earned value by the actual cost. This allows us to look at what we’ve accomplished and if it matches up with actual dollars we’ve spent. An index of less than 1 indicates that the project is trending over budget. If it is over one, the project is under budget.
Example of CPI
- If the result is less than 1 it means your project is over budget.
- If the result is greater than 1 it means your project is under budget.
- If the result is 1, then your project is on schedule.
Earned Value: 93,192.00
Actual Cost: 121,225.00
CPI: 0.768752 (over budget)

Example of SPI
- If the result is less than 1 it means your project is behind schedule.
- If the result is greater than 1 it means your project is ahead of schedule.
- If the result is 1, then your project is on schedule.
Earned Value: 93,192.00
Planned Value: 100,500.00
SPI: 0.926686 (behind schedule)

Walk-Through: How To Calculate Earned Value
As I mentioned above, earned value is EV = (PV)(% complete), but how do you know the % complete?
This can be tough, especially if your budget line items don’t exactly line up to your task list.
When planning a project and building out a timeline, I always find it helpful to ensure the parent-level tasks match up with the budget. While your task list is more granular and allows you to track completion in digestible amounts, you can also roll the % complete up to the parent task.
In an ideal scenario you have a tool (like Microsoft Project) that can do this for you. That % complete of the parent task can then be used to calculate the EV associated with that line item.
| Budget Line Items | Project Task List |
|---|---|
Planning | Kick-off Setup |
| Design | Style Guide Wireframes Design Round 1 Design Round 2 |
| Development | Sprint 1 Sprint 2 Sprint 3 |
| QA | Test planning Sprint 2 Sprint 3 UAT |
So if we look at design, for example:
| Planned Value | % Complete | Earned Value |
|---|---|---|
| Design $20,000 | Design (62.5%) Style Guide (100%) Wireframes (100%) Design Round 1 (50%) Design Round 2 (0%) | $20,000*62.5%= $12,500 |
It can be challenging to determine the % complete of a task. This is why it is generally helpful to have it map back to specific deliverables, but that’s a story for another blog post on project planning and work breakdown structures (WBS).
There are times when you’ll have to go with your gut. You, as the PM, will have a handle on if you’re at 50% or 75% completion of a task on your list. This is where being close to the team and engaging in transparent honest conversations will provide a lot of benefit.
6 Formulas For Earned Value Management
Here’s a cheat sheet of all the formulas you need to calculate, report on, and understand your earned value.
1. Earned Value
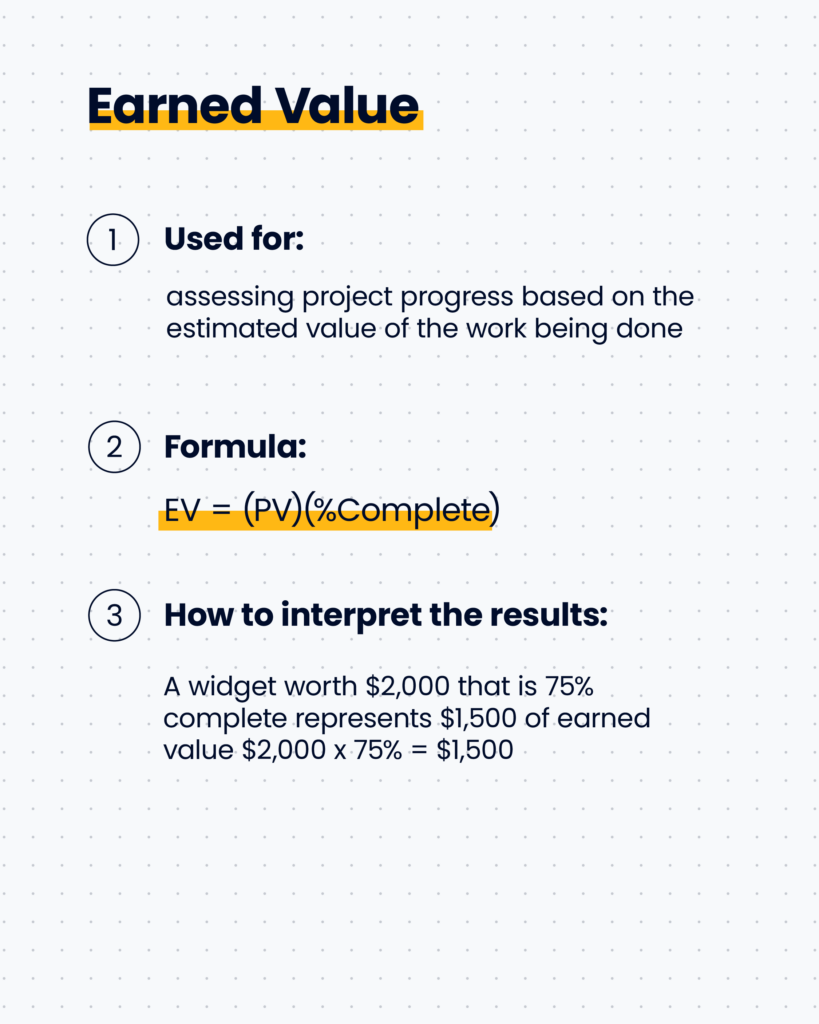
Used for: assessing project progress based on the estimated value of the work being done
Formula: EV = (PV)(%Complete)
How to interpret the results:
- A widget worth $2,000 that is 75% complete represents $1,500 of earned value $2,000 x 75% = $1,500
2. Schedule Variance
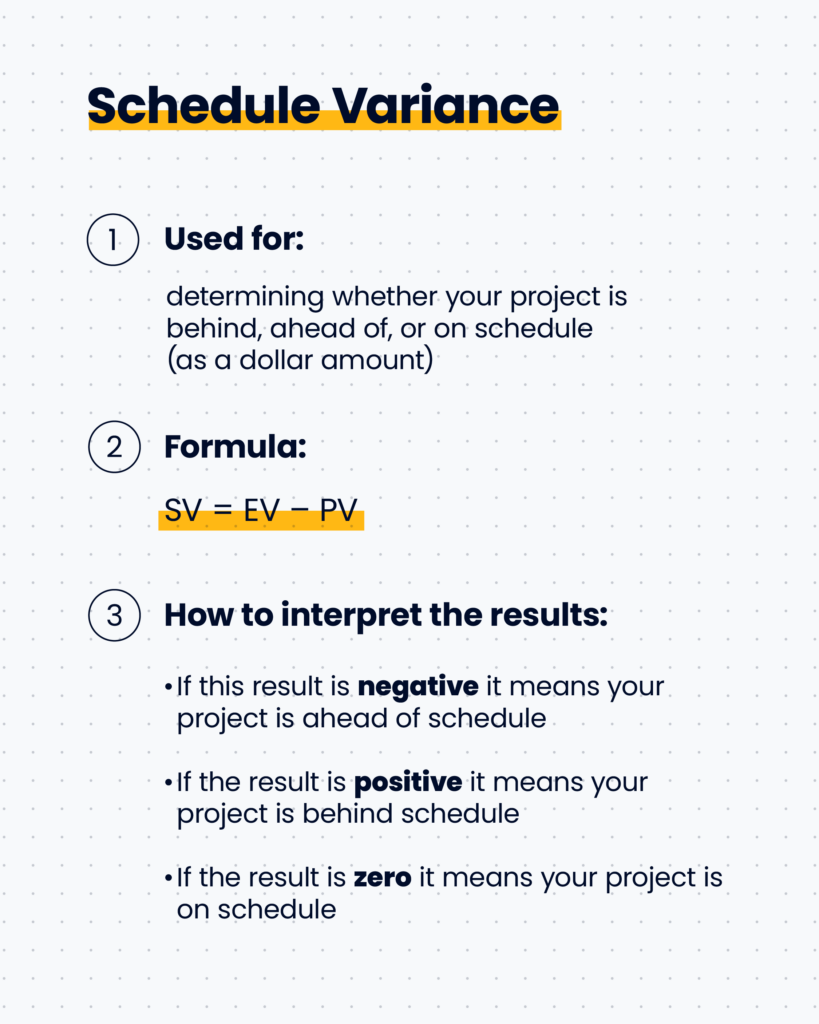
Used for: determining whether your project is behind, ahead of, or on schedule (as a dollar amount)
Formula: SV = EV – PV
How to interpret the results:
- If this result is negative it means your project is ahead of schedule
- If the result is positive it means your project is behind schedule
- If the result is zero it means your project is on schedule
3. Cost Variance
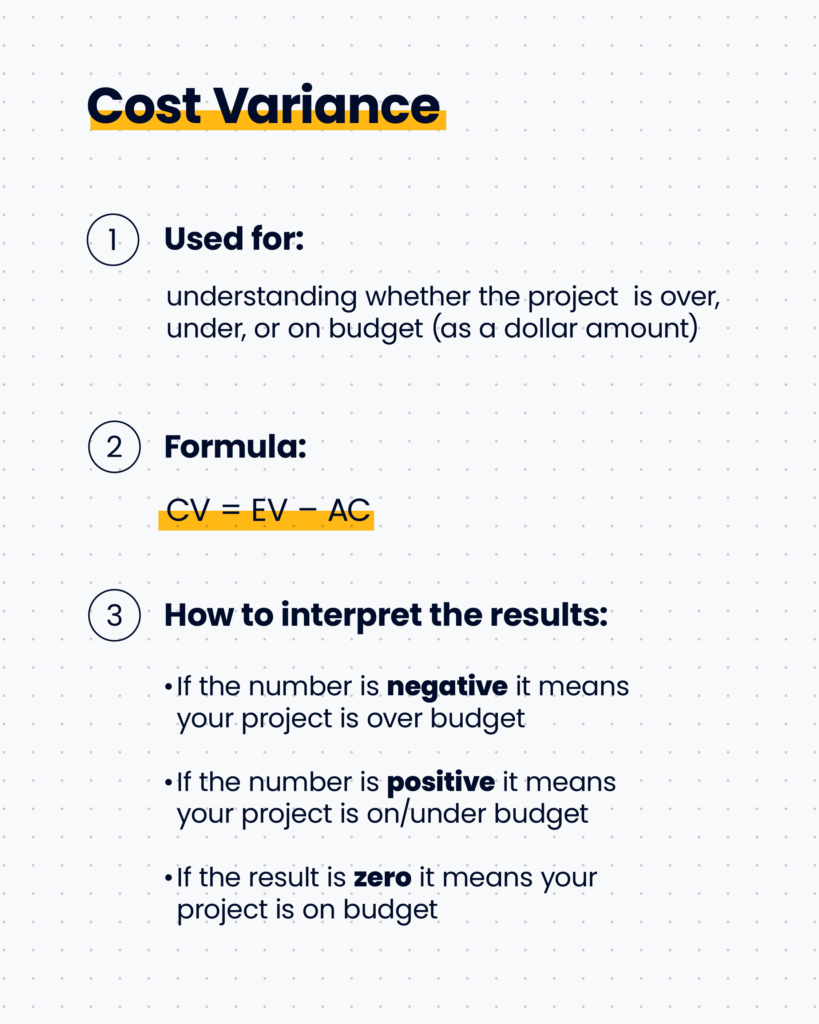
Used for: understanding whether the project is over, under, or on budget (as a dollar amount)
Formula: CV = EV – AC
How to interpret the results:
- If the number is negative it means your project is over budget
- If the number is positive it means your project is on/under budget
- If the result is zero it means your project is on budget
4. Cost Performance Index
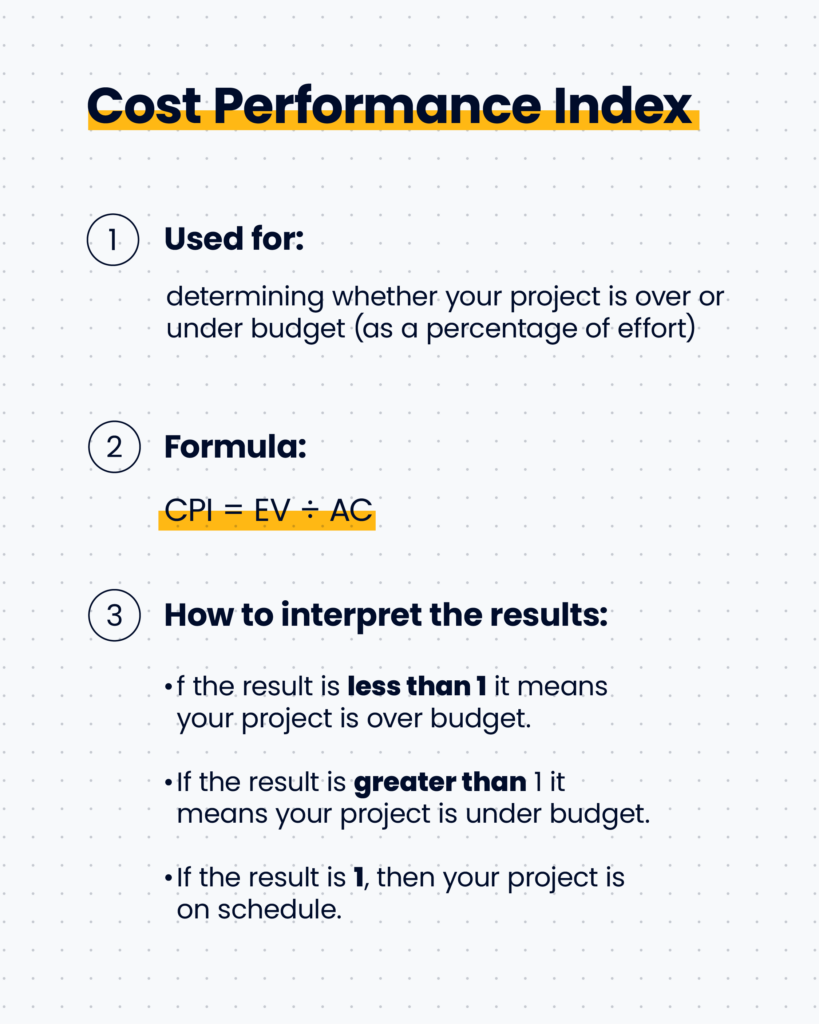
Used for: determining whether your project is over or under budget (as a percentage of effort)
Formula: CPI = EV ÷ AC
How to interpret the results:
- If the result is less than 1 it means your project is over budget.
- If the result is greater than 1 it means your project is under budget.
- If the result is 1, then your project is on schedule.
5. Schedule Performance Index

Used for: understanding whether a project is behind or ahead of schedule (as a percentage of effort)
Formula: SPI = EV ÷ PV
How to interpret the results:
- If the result is less than 1 it means your project is behind schedule.
- If the result is greater than 1 it means your project is ahead of schedule.
- If the result is 1, then your project is on schedule.
6. Estimated Cost at Completion

Used for: estimating the variance between the planned and actual costs when the project reaches its end
Formula: EAC = TBC ÷ CPI
How to interpret the results:
- If the result is greater than your planned budget at completion, that is the forecasted overage that you need to plan to correct or prepare to incur.
Useful Earned Value Management Tools
I know what you’re thinking: you’re thinking “Mackenzie, do I have to memorize all these formulas? Aren’t there tools that do this?”
The answer is yes, but I haven't found any that do it particularly well.
My preferred method of performing EVM calculations is in a spreadsheet like Google Sheets or Excel. Here’s how you can start using my method today:
- Set up multiple tabs in Google Sheets or Excel to house the data and run the report. I’d recommend one tab per calculation. Example: one tab for planned value, one for earned value, and one for actual costs.
- Bonus: check out my template for calculating EVM.
- If you haven’t already, learn to use and love pivot tables! : )
- Export the appropriate data from your project management tool—this can give you the % complete at the task or project level
- Export the appropriate data from your time tracking tool—this can give you the actual costs
- Presto-change-o, you’ve got EVM data at your fingertips!
Why Is Earned Value Management Important In Digital Projects?
Introducing earned value management to my department and project management life finally gave me consistent reporting across all projects. I was no longer reporting on a personal feeling.
My take is that transparency is the best policy, and that data gives us something to work towards. If your project is 20% off its ideal SPI, then the problem to solve is how might we move 20% faster to catch up, and the answer to that is what you are telling your client.
You do not need a lot of data to do these calculations, but you do need some data points to measure. If you have a project estimate (no matter how high level), a project timeline (no matter how rough), and some form of actual cost data, you can report on the earned value of your project.
What's Next?
Want to master the finer points of EVM? Sign up for DPM membership and join the conversation in Slack with 100s of other digital project managers.
