

10 beste alternative verktøy til Lucidchart for diagrammer i 2026

Kortliste over de beste alternativene til Lucidchart


Gjennom årene jeg har jobbet med prosjektledelse, brukte jeg ofte Lucidchart fordi det gjør det mulig å lage og dele visuelle diagrammer som forenkler komplekse prosesser og legger til rette for teamsamarbeid. Likevel undersøkte jeg ofte alternativer når jeg trengte mer skreddersydde funksjoner eller andre integrasjonsmuligheter som passet bedre til bestemte prosjektdynamikker.
I dette innlegget bruker jeg min personlige erfaring med å lede hundrevis av prosjekter og bruke mange ulike prosjektstyringsplattformer til å dele mine anbefalinger av de beste alternativene til Lucidchart.
Hva er Lucidchart?
Lucidchart er en nettbasert, proprietær plattform utviklet for å tegne diagrammer og lage visuelle arbeidsflyter. Den fungerer som et samarbeidsområde for team som skal kartlegge komplekse systemer, utforme nettverksinfrastrukturer og idémyldre.
Hvorfor bruke et alternativ til Lucidchart?
Selv om Lucidchart er et nyttig og verdsatt verktøy, er det ikke sikkert at det passer for teamet ditt. Det kan være flere grunner til at du ser etter et alternativ, blant annet:
- Kostnadshensyn: Selv om Lucidchart er relativt rimelig, kan det hende du ser etter et billigere alternativ som passer bedre til budsjettet ditt.
- Begrensninger i funksjonalitet: Lucidchart tilbyr flere funksjoner, men har kanskje ikke funksjonene du trenger eller ser etter.
- Brukergrensesnitt: Et enkelt og brukervennlig grensesnitt er avgjørende, spesielt for team som er mindre teknologisk kyndige.
- Integrasjonsbehov: Jo bedre programvaren kan integreres med den eksisterende teknologistakken din, desto større er sannsynligheten for at du bruker den oftere.
- Samarbeidsfunksjoner: Etter hvert som team fortsetter å ta i bruk hybride og fjernbaserte arbeidsmiljøer, er samarbeid viktigere enn noen gang. Et verktøy som muliggjør omfattende samarbeid i sanntid, kan gjøre en stor forskjell.
Alternativer til Lucidchart kan tilby unike funksjoner og prismodeller som passer bedre til dine spesifikke behov. De kan gi en annen brukeropplevelse og potensielt forbedre teamets produktivitet og effektivitet innen prosjektledelse.
Hvorfor du kan stole på våre programvareanbefalinger
Teamet vårt har testet og anmeldt programvare siden 2012. Vi er selv prosjektledere, så vi vet hvor vanskelig og hvor viktig det er å velge riktig programvare.
I denne guiden har vi vurdert verktøyene gjennom praktisk testing og uavhengig research og gitt dem poeng ut fra våre utvelgelseskriterier. Vi bygger også på innsikt fra ledende eksperter i bransjen og erfarne prosjektledere.
Anmeldelsene våre bygger på vår egen redaksjonelle vurdering. De er ikke et salgsargument.
Ekspertanmeldere:
Sammenligningstabell for alternativer til Lucidchart
| Tool | Best For | Trial Info | Price | ||
|---|---|---|---|---|---|
| 1 | Best for creating professional presentations | Free plan + demo available | From $12.25/user/month (billed annually) | Website | |
| 2 | Best for automated diagramming with rich templates | Free demo available | From $99/user/year (billed annually) | Website | |
| 3 | Best for Agile project management | Free trial available | From $29/user/month (billed annually) | Website | |
| 4 | Best for integrated Microsoft Office diagramming | 30-day free trial available | From CAD $6.80/user/month (billed annually) | Website | |
| 5 | Best for free diagramming with Google Drive integration | Free plan + free trial available | Pricing upon request | Website | |
| 6 | Best for simple, collaborative mind mapping | Free plan + 1-month free trial available | From $5/month | Website | |
| 7 | Best for creative brainstorming | Free plan + 7-day free trial available | From $4.92/user/month (billed annually) | Website | |
| 8 | Best for Atlassian ecosystem integration | Free plan + 30-day trial available | From $3.80/user/month (billed annually) | Website | |
| 9 | Best for one-time desktop diagramming | Free plan + 7-day free trial + free demo available | From $7.9/month | Website | |
| 10 | Best for enterprise project portfolio management | Not available | Pricing upon request | Website |
Anmeldelser av de beste alternativene til Lucidchart
Nedenfor gir jeg deg en detaljert analyse og oversikt over hvert alternativ til Lucidchart, med priser, individuelle funksjoner og de viktigste fordelene.

Visme
Best for creating professional presentations
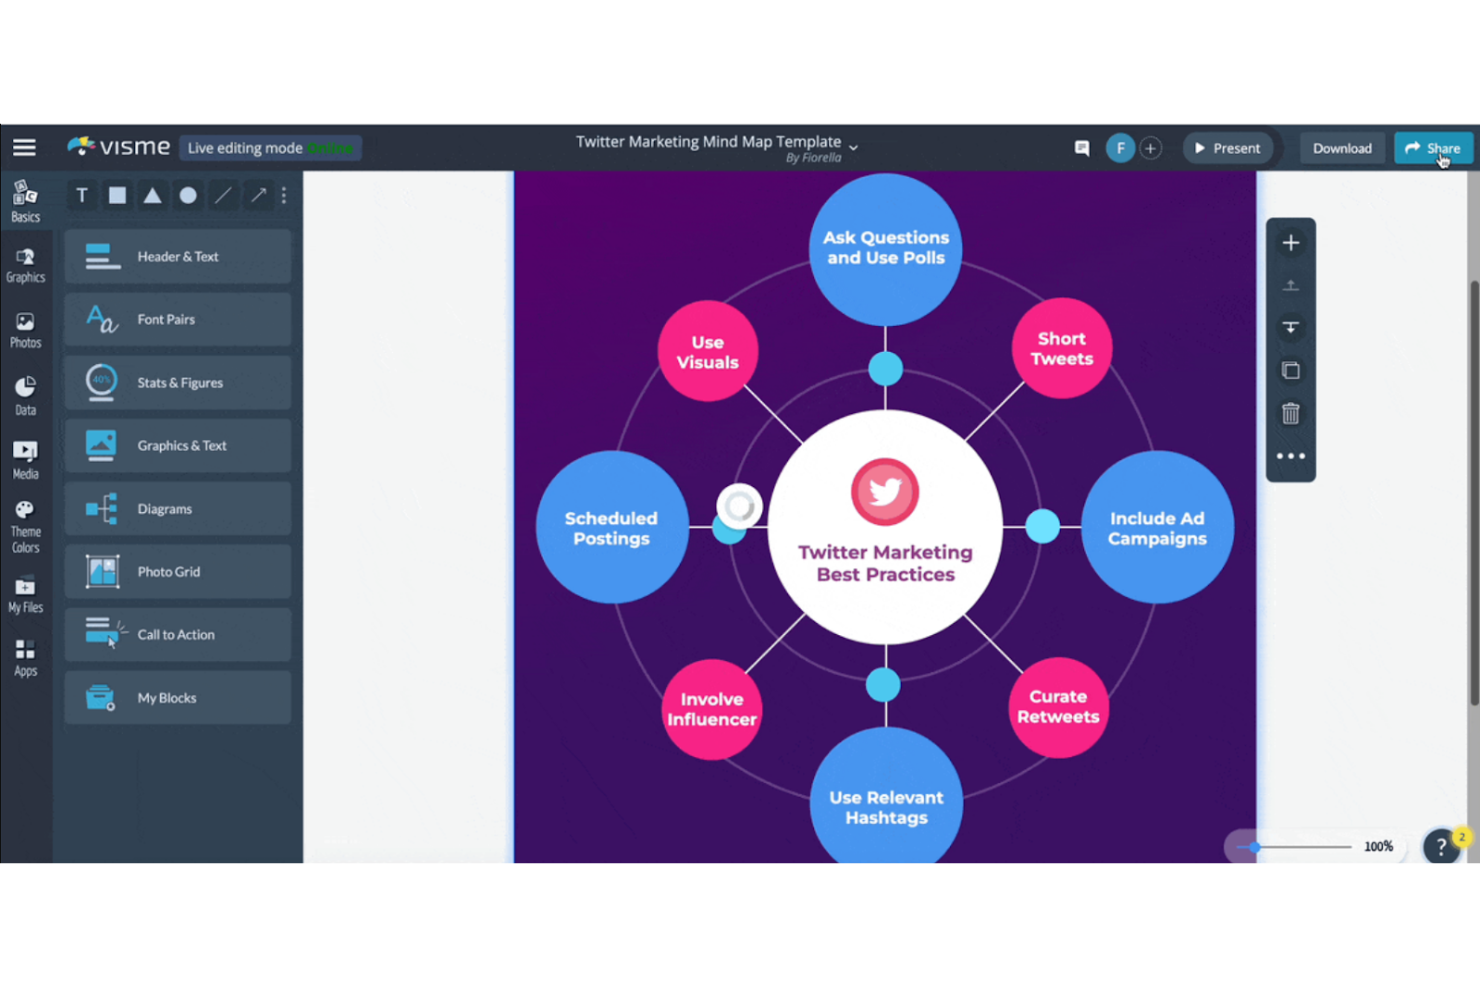
Visme is a visual content platform that covers diagrams, flowcharts, presentations, infographics, and reports through a drag-and-drop editor with a broad template library and integrations with tools like Google Drive, Slack, and monday.com.
Who Is Visme Best For?
Visme is a strong fit for teams that regularly produce client-facing presentations, reports, and branded visual content alongside their diagramming work.
Why I Picked Visme
I picked Visme as one of the best because it's genuinely strong at turning diagrams into finished, client-ready presentations without switching tools. I can build a flowchart or process diagram on the drag-and-drop canvas, then pull it directly into a branded report or pitch deck using the same editor. Visme's Recording Studio and slide-level annotation tools make it especially useful when I need to walk stakeholders through a visual workflow and capture feedback in one place.
Visme Key Features
- Diagram template library: Access templates for flowcharts, org charts, ER diagrams, network diagrams, fishbone diagrams, Venn diagrams, and process flows from a single editor.
- Project version history: Preview, restore, or revert to earlier versions of any project, with filtering by saved or named versions.
- Workspace audit log: Review a filterable, searchable log of team activity—including user, action, date, and IP—with CSV export. (Enterprise only)
- Cross-format export: Download finished diagrams and projects as PDF, PNG, JPG, PPTX, HTML5, GIF, or MP4, depending on your plan.
Visme Integrations
Visme offers native integrations with Google Drive, Dropbox, OneDrive, Google Sheets, Microsoft Excel, Slack, and monday.com for assets, data, sharing, and embedded documentation. It also supports hundreds of app connections through Zapier.
Pros and Cons
Pros:
- Polished visuals fit stakeholder presentations
- Flowchart templates reduce diagram setup time
- Drag-and-drop diagrams support quick visual mapping
Cons:
- Live co-editing trails dedicated diagramming tools
- Diagramming lacks specialized technical notation depth

Best for automated diagramming with rich templates
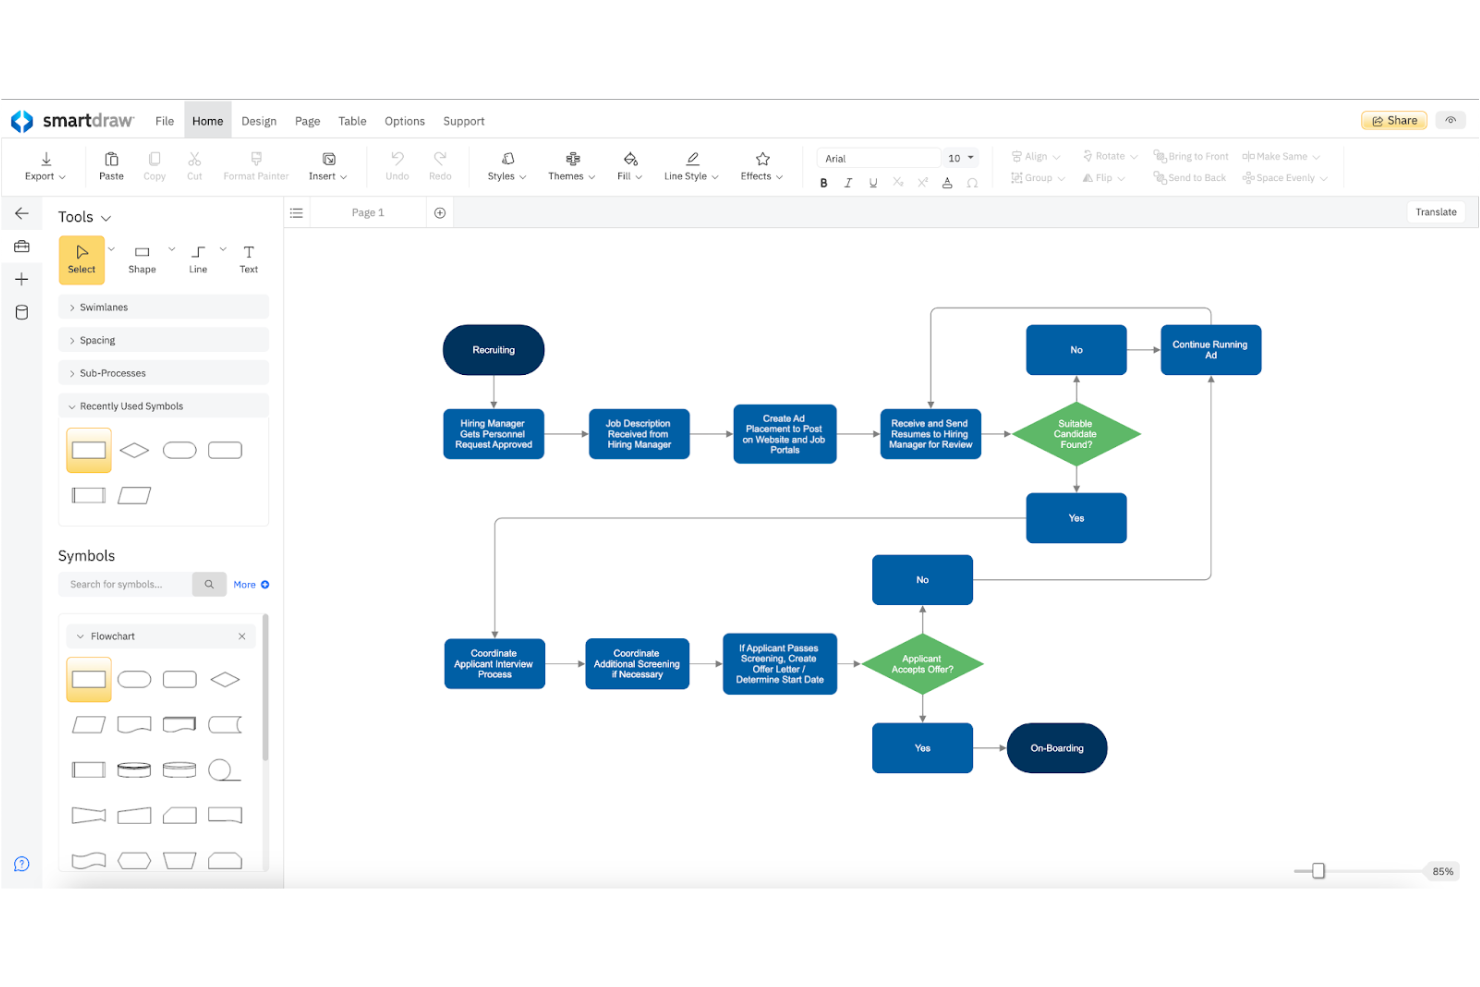
SmartDraw is a diagramming and visual documentation tool that covers flowcharts, org charts, network diagrams, floor plans, software architecture visuals, and process maps across more than 70 diagram categories.
Who Is SmartDraw Best For?
SmartDraw is a strong fit for IT administrators, process analysts, and engineering teams who need a broad diagram library with automated layout across complex documentation workflows.
Why I Picked SmartDraw
SmartDraw earns its spot on my shortlist because of its automated diagramming engine, which genuinely sets it apart from tools that require manual layout work. I love how it covers over 70 diagram categories with 800-plus templates, so whether my team is mapping a BPMN process flow or generating an AWS architecture diagram straight from live cloud data, there's a ready-made starting point. SmartDraw also explicitly supports bulk Lucidchart file migration, converting existing files into editable SmartDraw diagrams.
SmartDraw Key Features
- Data-linked conditional formatting: Link spreadsheet, Google Sheets, or CSV data to diagram shapes and set rules that change shape colors or attributes based on data values.
- Cloud architecture data visualizers: Connect AWS or Azure accounts to automatically generate an architecture diagram from live cloud data.
- Real-time collaborative workspaces: Co-edit diagrams alongside teammates with visible cursors, sticky notes, Kanban boards, and comments in a shared workspace.
- SSO and admin provisioning controls: Configure single sign-on, user groups, permissions, and shared folder access through a dedicated site-license admin panel.
SmartDraw Integrations
SmartDraw offers native integrations with AWS, Azure, Jira, GitHub, Google Drive, OneDrive, SharePoint, Confluence, Trello, and Microsoft Teams, plus Google Workspace marketplace integrations. It also provides an Open API, SDK, and MCP server for custom diagram generation.
Pros and Cons
Pros:
- Templates cover specialized technical diagram types
- Lucidchart files convert into editable diagrams
- Automatic layouts reduce manual alignment
Cons:
- Some users struggle to find symbols
- Reviewers report fewer collaboration features

Ravetree
Best for Agile project management
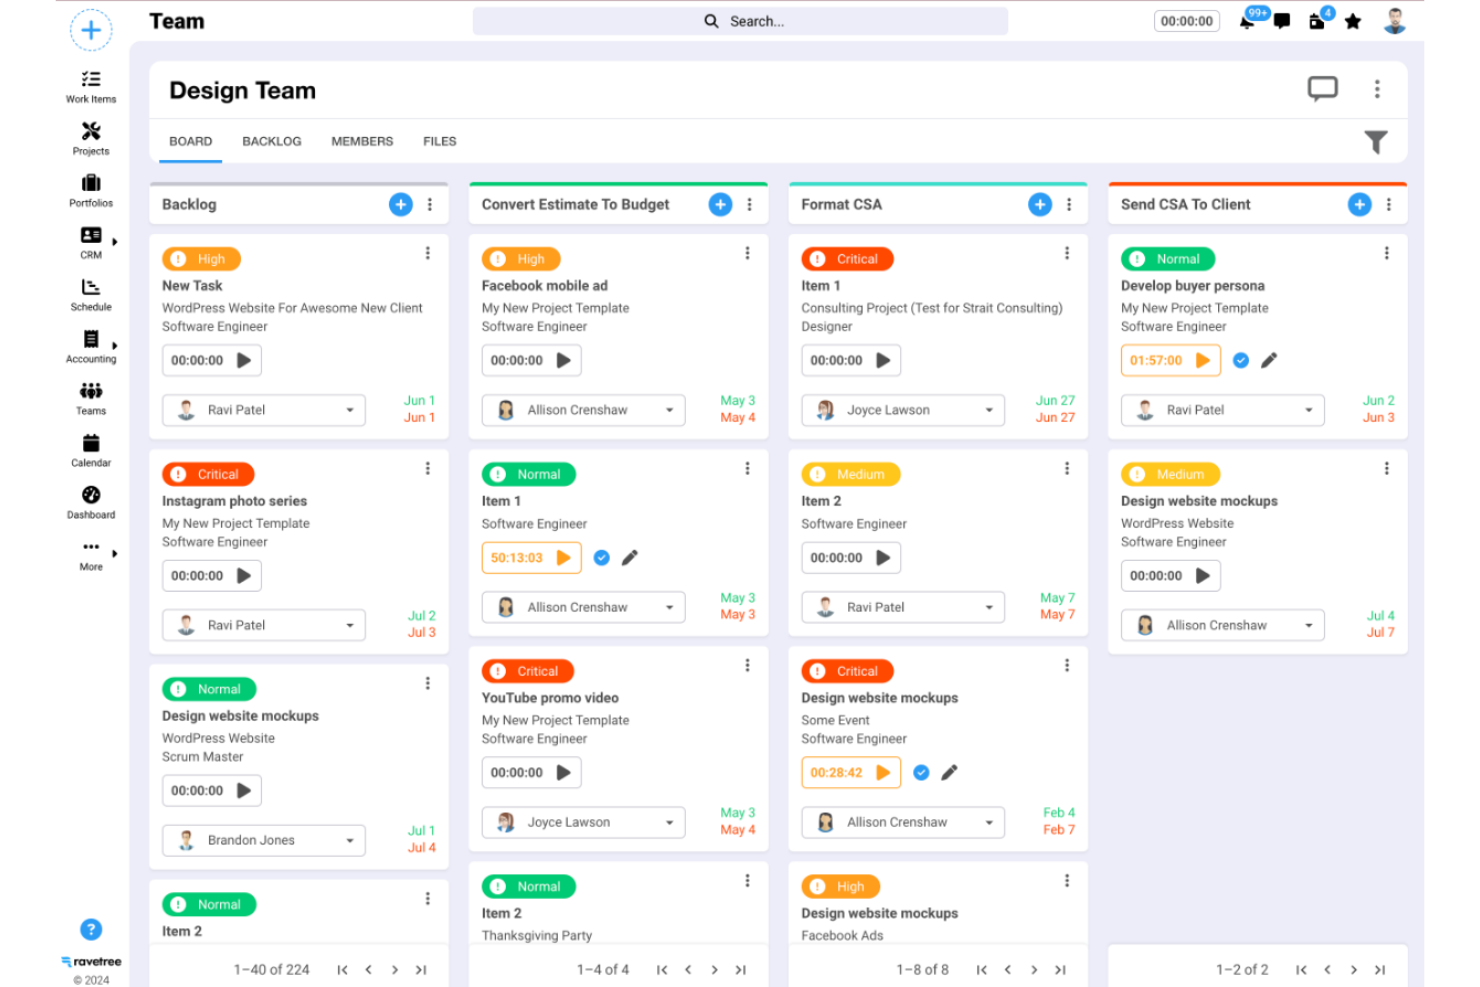
Ravetree is a work management platform that combines Agile project tracking, task management, time logging, resource planning, CRM, and billing into a single tool.
Who Is Ravetree Best For?
Ravetree is a strong fit for project managers at small-to-mid-sized agencies or service teams who need Agile project tracking, time logging, and client billing in one place.
Why I Picked Ravetree
I picked Ravetree as one of the best because its Agile project management depth is genuinely hard to replicate across separate tools. I love how sprint planning, Kanban boards, and epic tracking live alongside native time logging and client billing, so teams aren't stitching together three apps to manage one project. The phase-level budget tracking that rolls up to the project level is a detail I find especially useful when managing client work against tight margins.
Ravetree Key Features
- Resource planning: View team utilization by day, week, or month and assign unscheduled tasks using drag and drop.
- Client portal: Give clients access to live project updates, file approvals, and task requests through a dedicated portal.
- Retainer management: Automate recurring invoices, track earned versus unearned revenue, and configure overage billing per retainer.
- Custom request forms: Build intake forms with custom fields and multi-stage approval workflows for internal and external project requests.
Ravetree Integrations
Ravetree documents 16 integrations, including Google Drive, OneDrive, Box, Dropbox, Google Calendar, Outlook Calendar, HubSpot, QuickBooks, Xero, and GitHub. Its OpenAPI documentation supports custom integrations, but no diagram embedding or synchronization is documented.
Pros and Cons
Pros:
- Client portals share updates and file approvals
- Reviewers praise shared project visibility across teams
- Reviewers value budget tracking tied to project work
Cons:
- CSV exports can’t migrate Lucidchart diagrams
- No canvas, shapes, or diagram templates

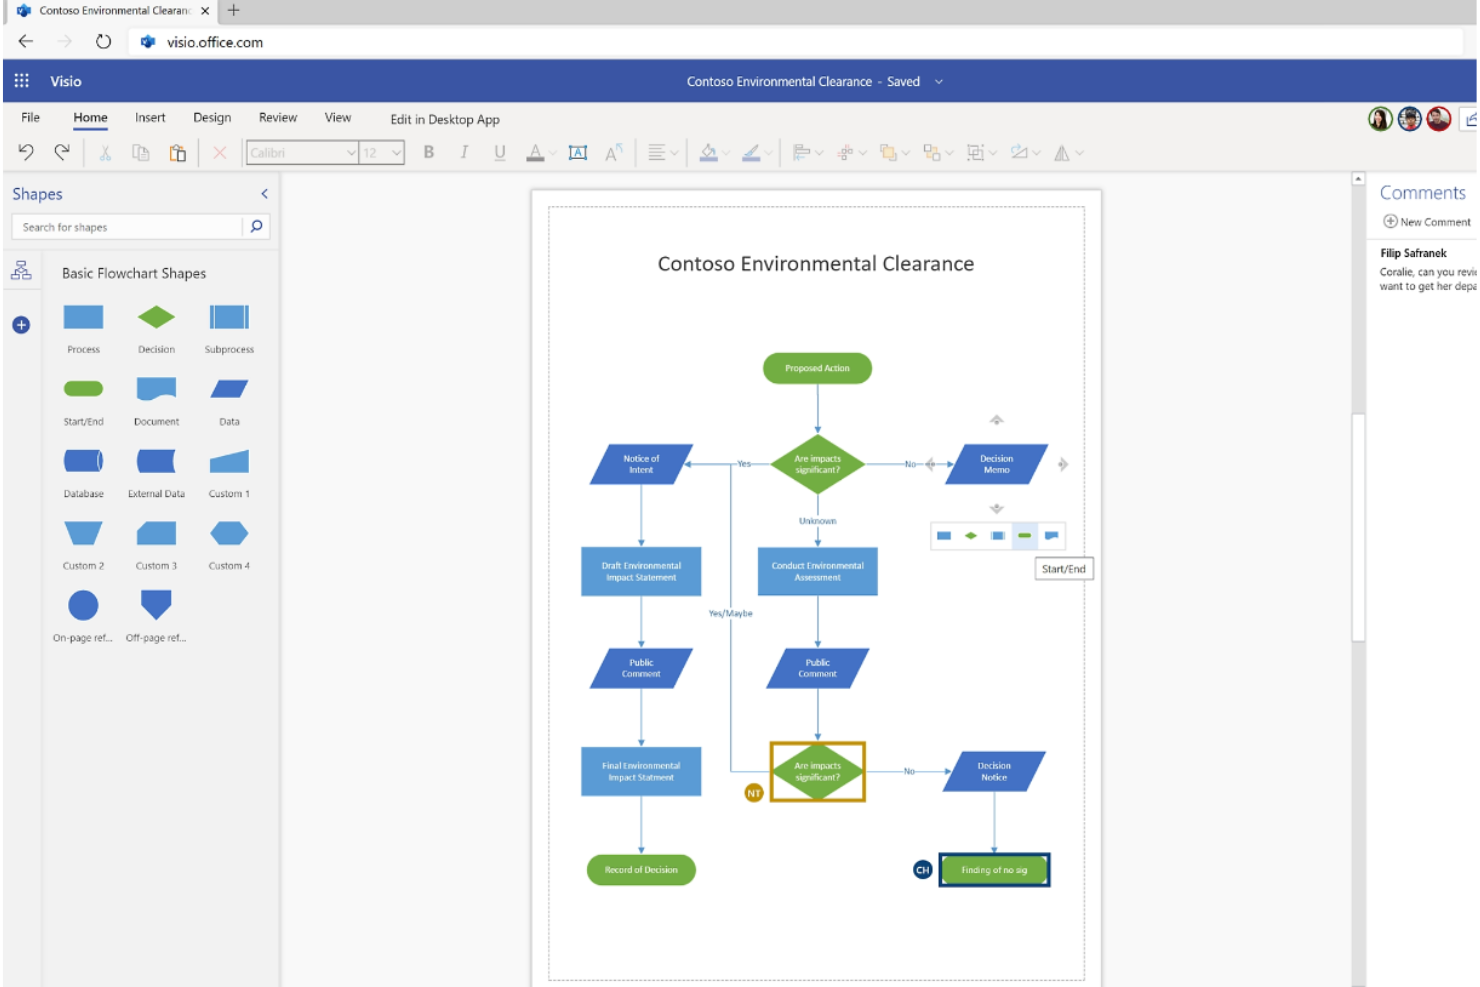
Microsoft Visio is a diagramming tool from Microsoft that covers flowcharts, org charts, network diagrams, process maps, UML, and cloud architecture diagrams, with deep integration across the Microsoft 365 ecosystem.
Who Is Microsoft Visio Best For?
Visio is a strong fit for IT teams, business analysts, and engineering leads who are already working inside the Microsoft 365 ecosystem and need a diagramming tool that fits naturally into that environment.
Why I Picked Microsoft Visio
Microsoft Visio earns its spot on my shortlist because of how naturally it fits inside the Microsoft 365 ecosystem. I love that you can convert an Excel process map into a Visio flowchart using Data Visualizer, then embed that diagram directly into a Power BI dashboard or break it into PowerPoint slides without ever leaving your existing Microsoft workflow. Visio also supports over 250,000 shapes, including Azure and AWS architecture templates, which makes it genuinely useful for IT teams documenting real infrastructure.
Microsoft Visio Key Features
- Cross-functional flowcharts: Create multi-department process diagrams with swim lanes using dedicated templates included in Plan 1.
- BPMN 2.0 diagrams: Build advanced business process model and notation diagrams using the BPMN Shapes stencil, available in Plan 2.
- Two-way data connectivity: Link diagrams to external sources like SQL Server, SharePoint lists, and Excel, then sync changes in both directions from the desktop app.
- Presentation mode: Step through diagram pages in full screen like a slide show, with pan-and-zoom tools for walking audiences through detailed visuals.
Microsoft Visio Integrations
Microsoft Visio offers native integrations across the Microsoft ecosystem, including Microsoft Teams, Power BI, Excel, PowerPoint, Word, SharePoint, OneDrive, and Azure. It connects to data sources such as SQL Server and supports custom integrations through the Visio JavaScript API.
Pros and Cons
Pros:
- Vector and image export options
- Data graphics clarify diagram-linked conditions
- Broad network and cloud architecture stencils
Cons:
- Co-editing requires matching app types
- No documented Lucidchart migration path

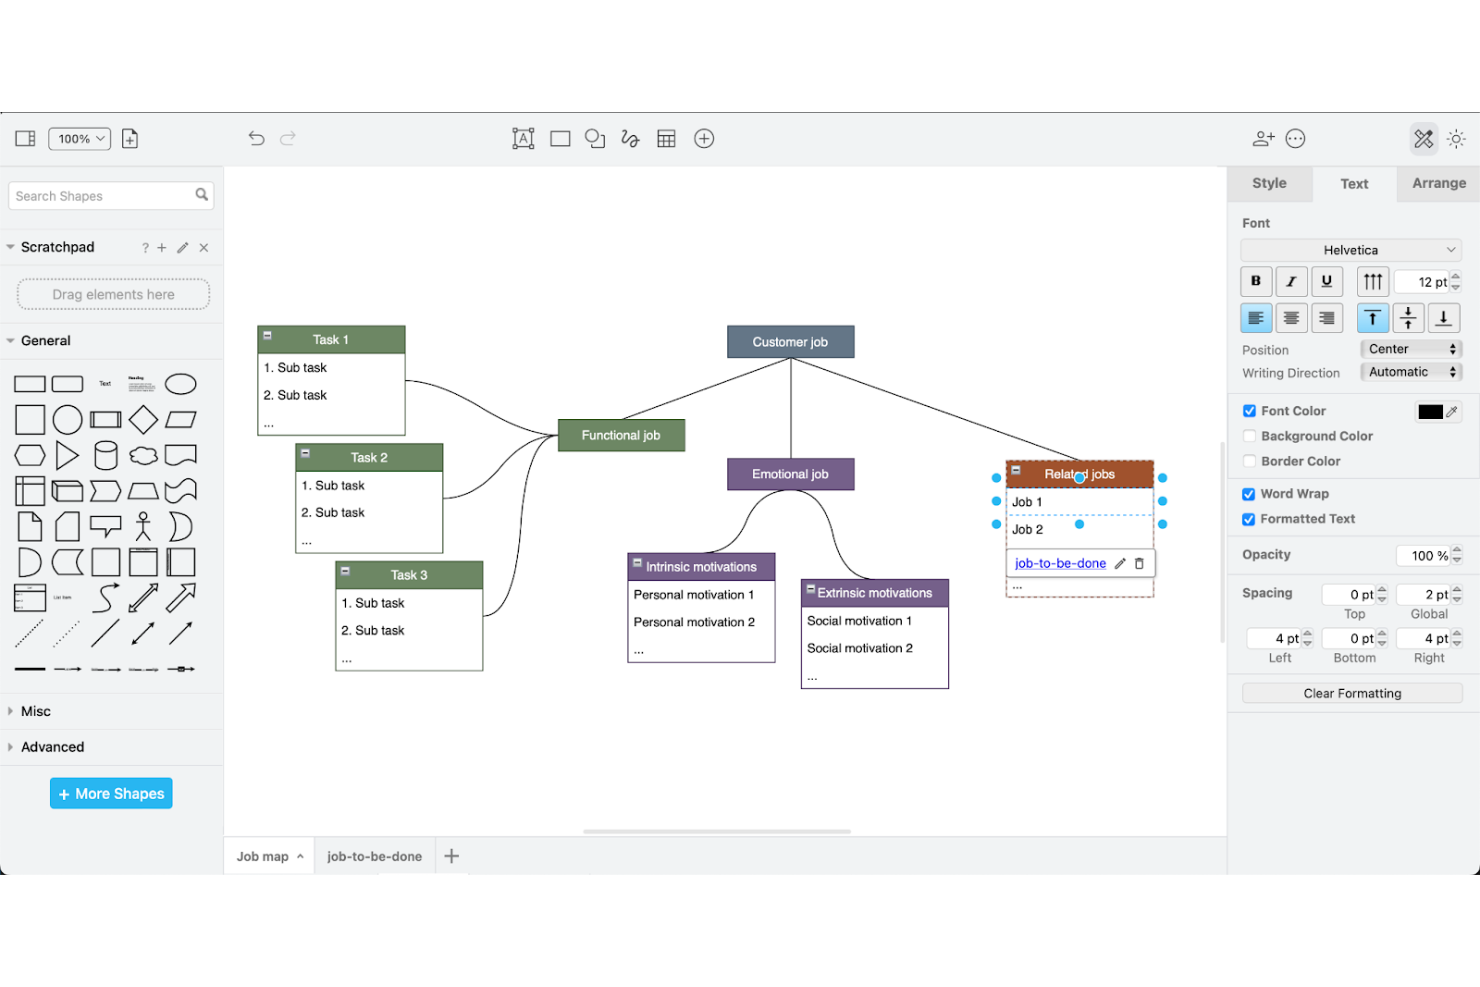
draw.io is a free, open-source diagramming tool that supports flowcharts, org charts, network diagrams, UML, and process flows, with storage and collaboration built around Google Drive and other cloud platforms.
Who Is draw.io Best For?
draw.io works best for teams and individual contributors who need capable diagramming without a subscription—especially those already working within Google Drive or Atlassian tools like Confluence and Jira.
Why I Picked draw.io
I've included draw.io in my top picks because it's the most capable free diagramming tool I've found for teams already living in Google Drive. Storing a diagram in a shared Drive folder is all it takes to unlock real-time co-editing with visible cursors and live change syncing, which makes it a practical Lucidchart replacement without a subscription. I also like that you can generate diagrams directly from CSV data or Mermaid code, so mapping a network topology or org chart doesn't always start from a blank canvas.
draw.io Key Features
- Mermaid and SQL code import: Paste Mermaid or SQL code directly into the editor to auto-generate diagrams without building them manually.
- Self-hosted Docker deployment: Run draw.io on your own infrastructure using the vendor's Docker-based container for full data control.
- Offline desktop application: The Windows, macOS, and Linux desktop app works without an internet connection, keeping diagram data entirely on-device.
- Layered canvas with automatic layout: Organize complex diagrams into discrete layers and apply automatic layouts to flowcharts and tree diagrams with a single action.
draw.io Integrations
draw.io offers native integrations with Google Drive, Microsoft OneDrive, SharePoint, GitHub, GitLab, Microsoft Teams, and Notion, plus marketplace integrations for Confluence and Jira. Its React SDK, iframe messaging interface, MCP server, and plugins support custom integrations.
Pros and Cons
Pros:
- Supports offline editing across desktop platforms
- Covers network, UML, and process diagrams
- Generates diagrams from Mermaid, CSV, and SQL
Cons:
- Crowded diagrams can lag and complicate connectors
- Lucidchart imports may fail or lose details

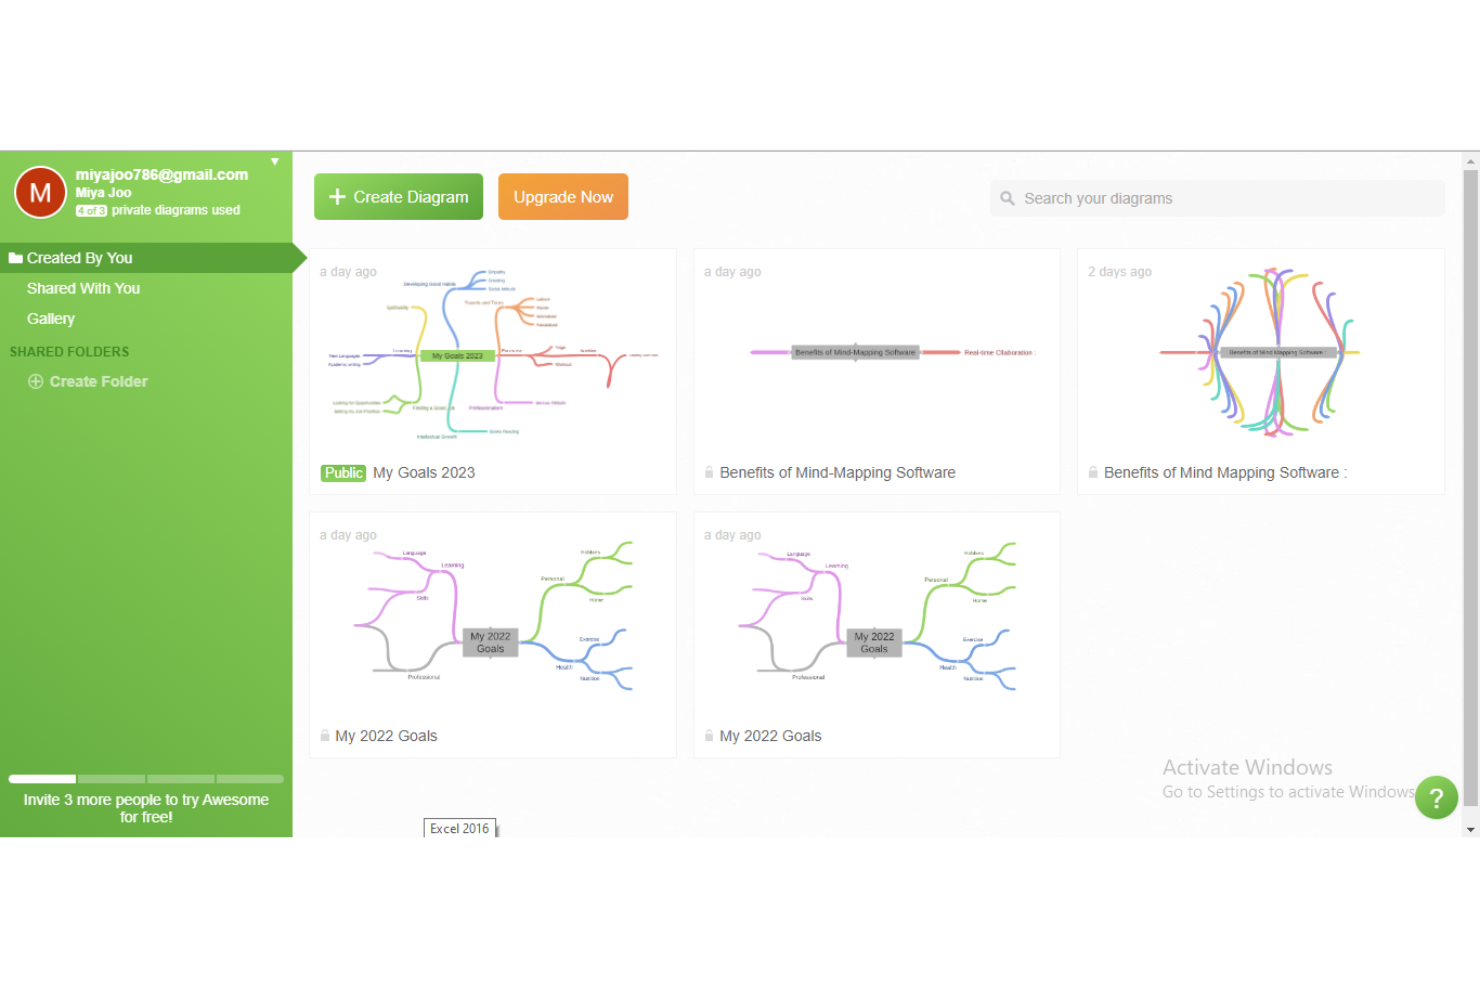
Coggle is a browser-based mind mapping and diagramming tool that supports branching diagrams, flowcharts, and org charts with real-time multi-user editing.
Who Is Coggle Best For?
Coggle is a good fit for small teams and individuals who need a lightweight, browser-based tool for collaborative mind mapping and simple flowcharts without a steep learning curve.
Why I Picked Coggle
I've included Coggle in my top picks because it keeps collaborative mind mapping genuinely simple, which is harder to find than it sounds. Multiple people can edit the same diagram simultaneously, with changes appearing almost instantly, making it practical for live brainstorming sessions without any setup friction. I also like that you can share a diagram as a copy-able template through a private link, so a team lead can lock down the original while letting others spin off their own versions.
Coggle Key Features
- Change history: Review all diagram changes and restore any earlier version by making a copy from a past state.
- Multiple export formats: Download diagrams as PDF, PNG, plain text, FreeMind
.mm, or Microsoft Visio.vsdxfiles. - Presentation mode: Switch any diagram to full screen and expand or collapse branches progressively to walk an audience through your map.
-
.drawiofile import: Drag a locally saved.drawiofile onto an empty diagram to import content from diagrams.net or draw.io.
Coggle Integrations
Coggle documents native integrations with Microsoft OneNote, OneLogin, and Okta. It also offers an API for custom diagram creation, editing, data retrieval, and synchronization with other applications.
Pros and Cons
Pros:
- Quick setup helps teams start mapping
- Branch loops map connected processes
- Live edits support team brainstorming
Cons:
- No direct Lucidchart import path
- Limited shapes constrain detailed diagrams
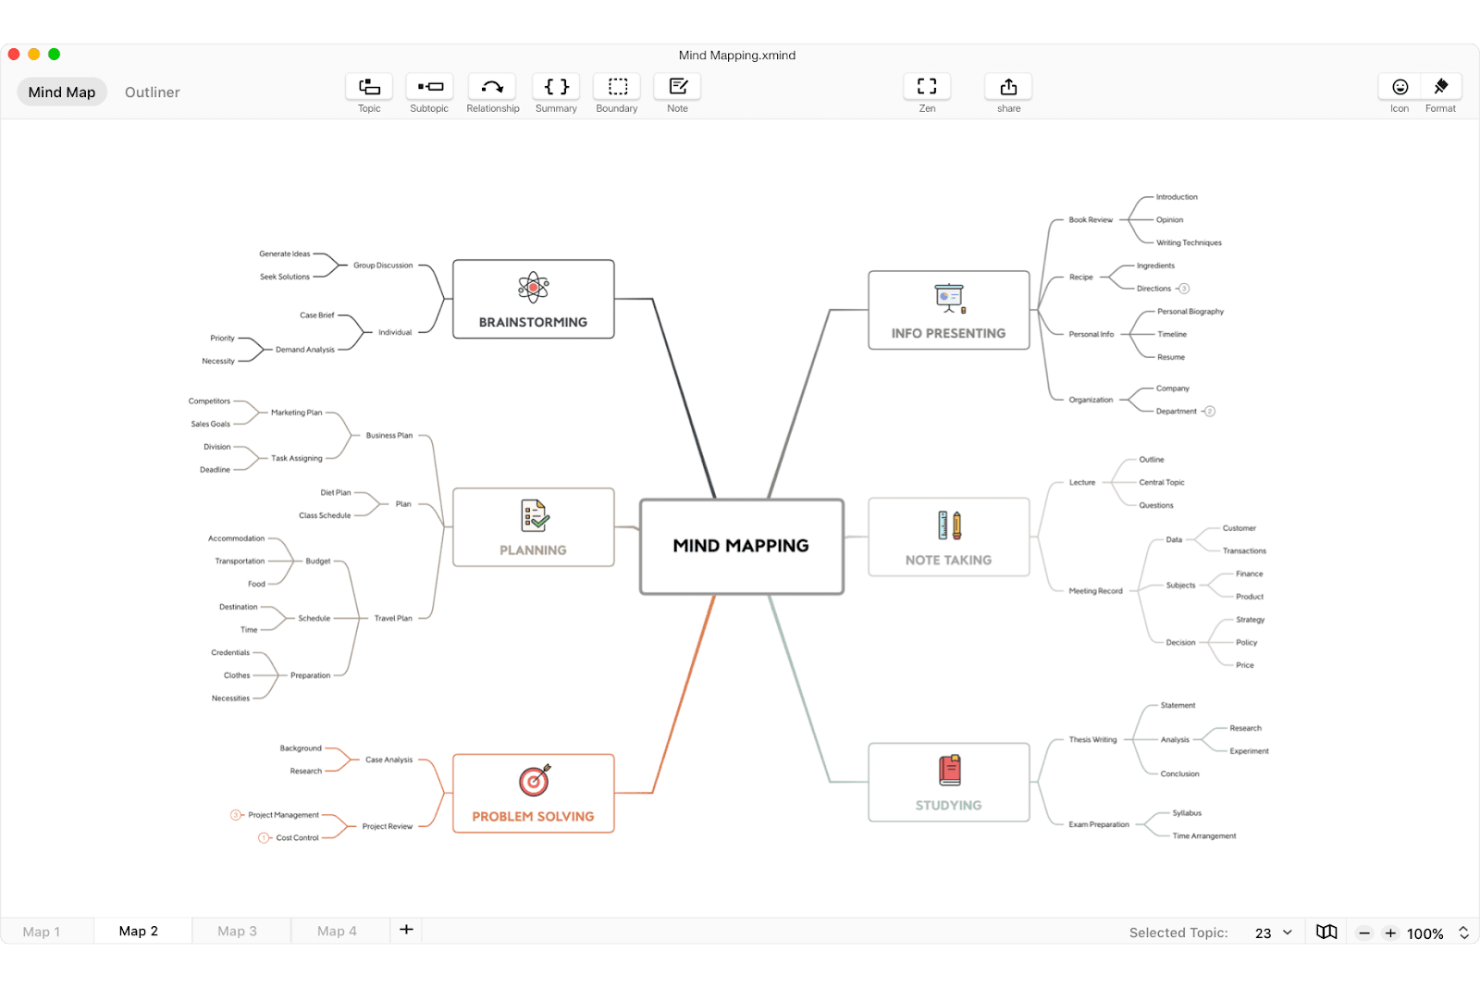
Xmind is a mind mapping tool that structures ideas into visual hierarchies, timelines, matrices, and Fishbone Charts, with built-in AI map generation, Pitch Mode presentations, and integrations with Notion, Slack, and ChatGPT.
Who Is Xmind Best For?
Xmind is a strong fit for individuals and small teams who need to capture and organize ideas quickly rather than build connector-based diagrams.
Why I Picked Xmind
I picked Xmind as one of the best because it's the tool I reach for when a project starts with a blank page and too many loose ideas. Rather than forcing you into flowchart connectors, Xmind lets you build structured thinking through mind maps, Fishbone Charts, matrices, and timelines, which is exactly the right canvas when you're in discovery mode. I also love that the built-in AI can turn a rough prompt, a PDF, or even a YouTube link into a branched map in seconds.
Xmind Key Features
- Real-time collaboration: Co-edit maps with teammates simultaneously, with view or edit permissions assigned per shared map.
- Pitch Mode: Present a mind map directly as slides without rebuilding content in a separate presentation tool.
- Gantt chart and task tracking: Convert map topics into trackable tasks with assignees, deadlines, and progress, synced to an editable Gantt view.
- Multi-format export: Export maps to PNG, SVG, PDF, Word, Excel, Markdown, and PowerPoint without watermarks on paid plans.
Xmind Integrations
Xmind offers native integrations with Notion, Slack, Zoom, and ChatGPT. Its MCP Server supports custom connections with Claude, Claude Code, Codex, and Cursor.
Pros and Cons
Pros:
- Reviewers use it to map application dependencies
- Turns maps into presentation-ready slides
- Structures brainstorming into clear visual hierarchies
Cons:
- Reviewers report lag on large maps
- Hierarchy-driven canvas limits connector-based diagramming

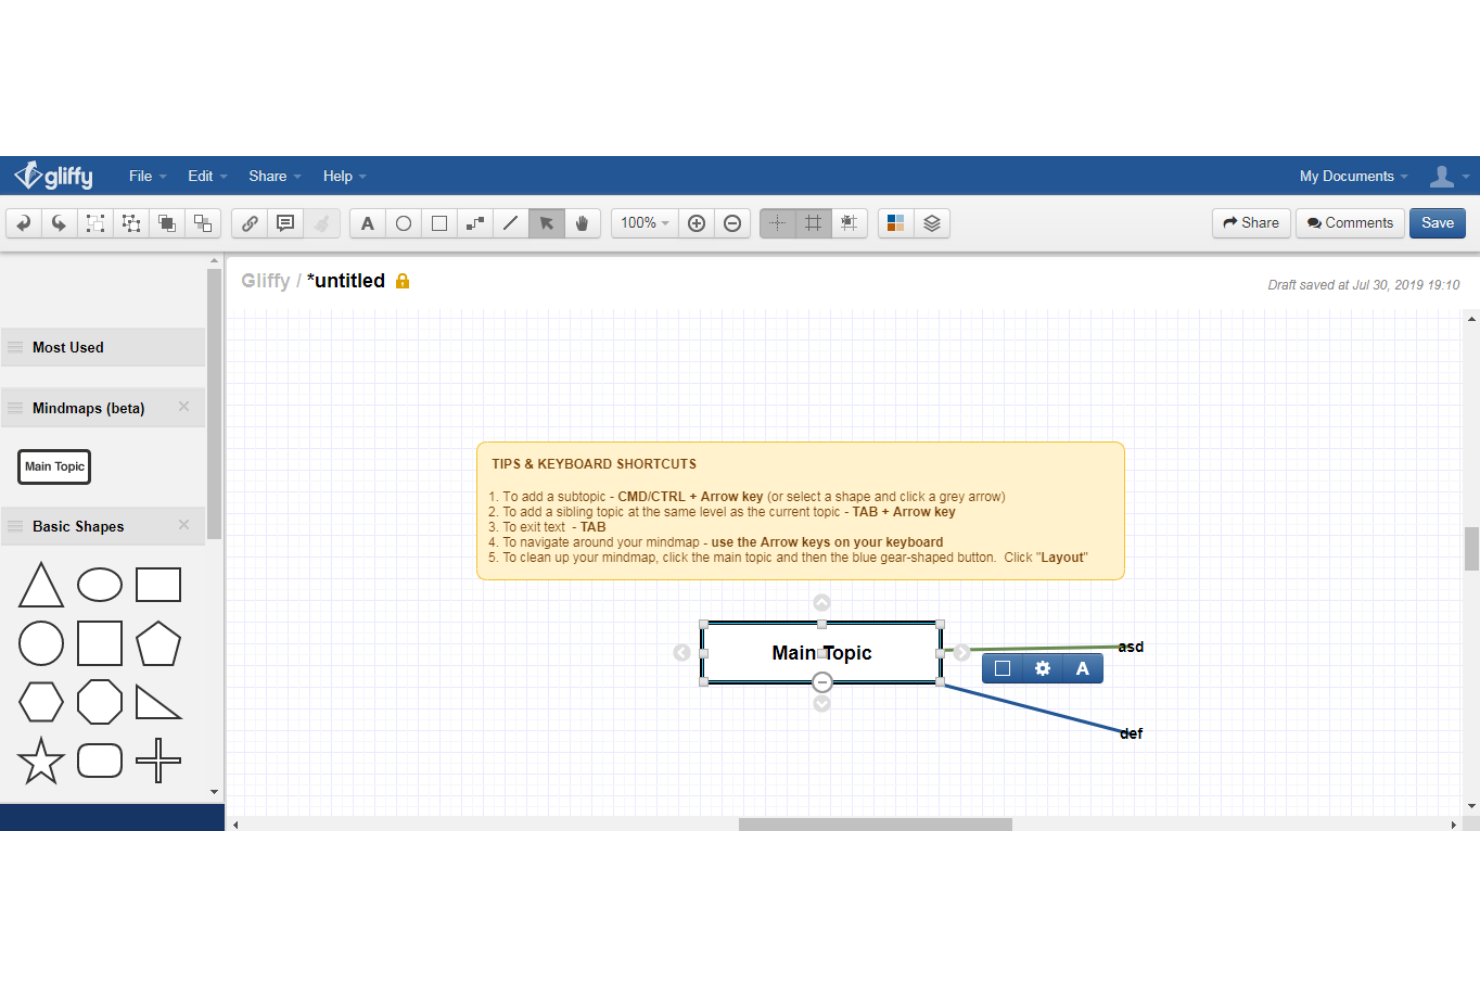
Gliffy is a diagramming tool built natively for Confluence that supports flowcharts, UML, BPMN, network diagrams, architecture diagrams, and Mermaid diagrams, with AI-assisted diagram generation and Jira integration.
Who Is Gliffy Best For?
Gliffy is a strong fit for teams already working in Confluence and Jira who need diagramming that lives directly inside their existing documentation workflows.
Why I Picked Gliffy
I picked Gliffy as one of the best Lucidchart alternatives because it lives natively inside Confluence rather than connecting to it from outside. If your team already runs on the Atlassian stack, diagrams stay searchable through Confluence and governed by the same permissions your admins already manage. I also like the Gliffy Rovo Agent, which lets you generate and edit technical diagrams directly from Rovo Chat using knowledge already stored in your Confluence pages.
Gliffy Key Features
- AI diagram generation: Generate editable flowcharts, class diagrams, and sequence diagrams from plain-text prompts directly inside Confluence.
- Real-time co-editing: Teammates viewing the same Confluence Cloud diagram can edit simultaneously, with color-coded cursors and a "Follow me" presentation mode.
- Mermaid diagram support: Write code-based diagrams and convert them into fully editable Gliffy diagrams with independently movable shapes.
- CSV data linking: Upload a CSV file or build a custom table, then drag data into your diagram so it updates automatically when the linked table changes.
Gliffy Integrations
Gliffy offers native integrations with Confluence, Jira, and Slack. Its smaller integration set suits Atlassian-centric teams that want diagrams embedded in documentation and project workflows.
Pros and Cons
Pros:
- Templates cover network and process diagrams
- Simultaneous edits show collaborator cursors
- Drag-and-drop supports workflow and architecture maps
Cons:
- Saving and reopening issues affect reliability
- Complex diagrams can disrupt object layouts

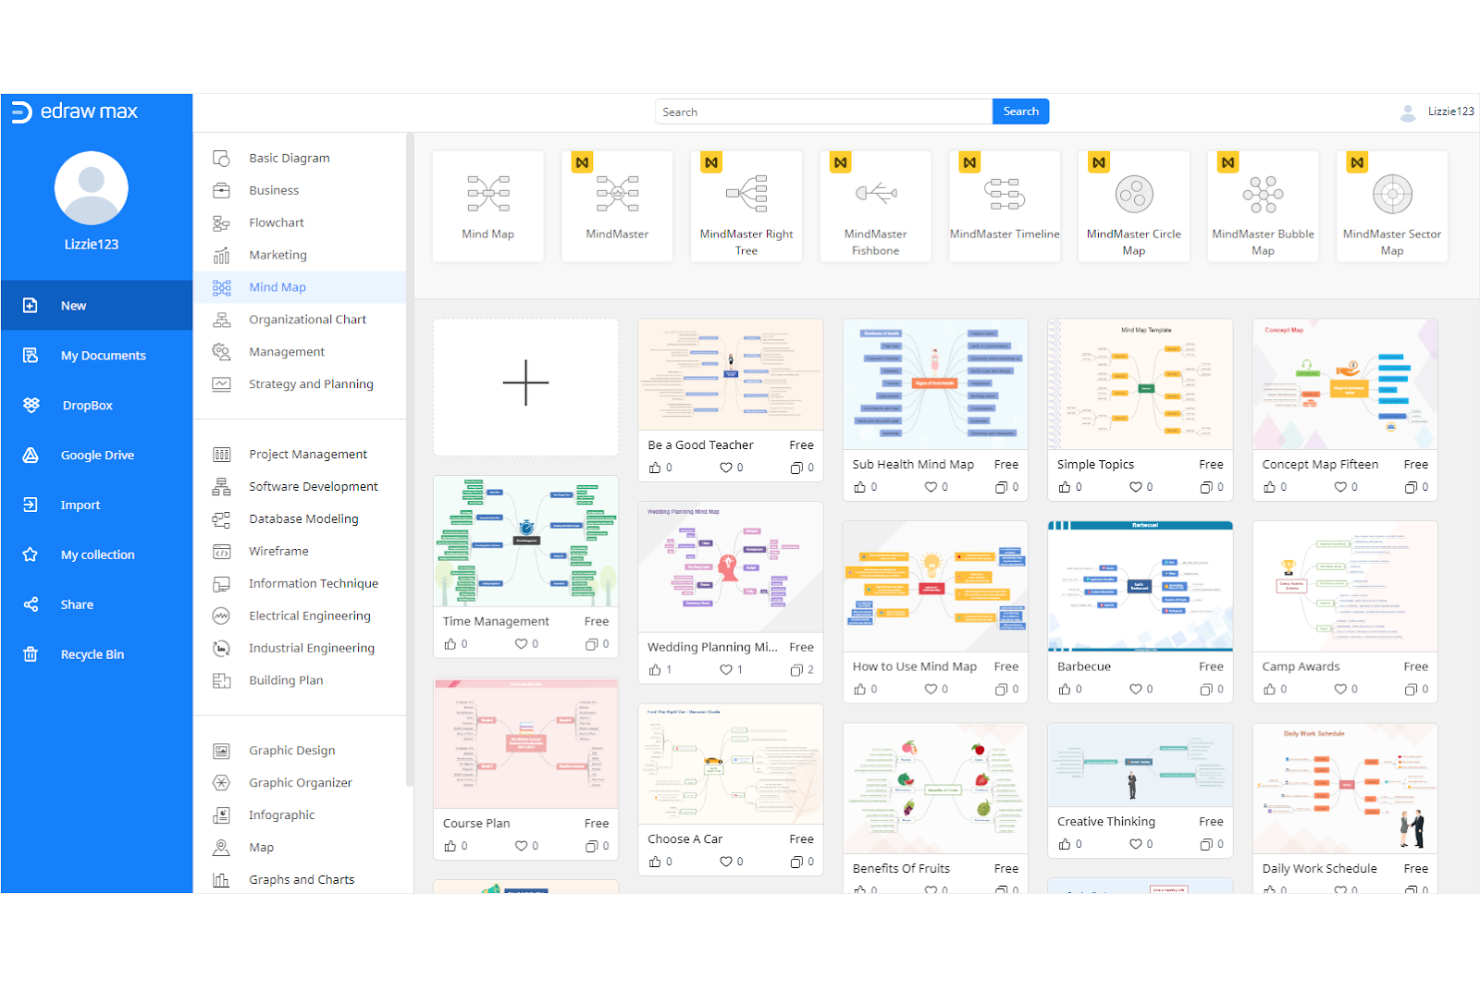
EdrawMax is a cross-platform diagramming tool that covers over 210 diagram types—from flowcharts and org charts to UML, network layouts, and electrical diagrams—with a library of 20,000+ templates and AI-powered diagram generation.
Who Is EdrawMax Best For?
EdrawMax is a strong fit for IT administrators and business analysts who need a wide range of diagram types—from network layouts to flowcharts—without being locked into a Windows-only tool.
Why I Picked EdrawMax
I picked EdrawMax as one of the best because of the sheer breadth of diagram types it supports across every major platform. With 210+ diagram types and 20,000+ templates, it covers everything from UML and network topology to electrical and P&ID diagrams, all in one tool. I especially like that it runs natively on Windows, macOS, and Linux, plus web and mobile, so teams aren't stuck on a single OS the way they would be with Visio. The AI diagram generation from text prompts is a genuine time-saver when you need a quick flowchart or mind map drafted fast.
EdrawMax Key Features
- Visio file import and export: EdrawMax lets you open and save Visio files directly, making it easy to work with existing diagrams from Visio-based teams.
- Multi-format export: You can export diagrams to more than 10 formats, including PDF, SVG, HTML, Word, Excel, and PowerPoint.
- In-app presentation mode: EdrawMax includes a built-in presentation view that lets you present diagrams directly in the app or export slides to PowerPoint.
- Multi-user team controls: Team plans include centralized deployment, multi-user management, and volume-based seat controls for admin oversight.
EdrawMax Integrations
EdrawMax offers documented integrations with Google Drive and Dropbox for saving and opening files, plus native Pixabay access. Google Drive and Dropbox require a premium plan; no broader integration directory or API is documented.
Pros and Cons
Pros:
- Desktop apps extend beyond browser-only workflows
- AI drafts flowcharts from short prompts
- Broad templates span technical and business diagrams
Cons:
- Connectors can misroute in complex diagrams
- Concurrent editing controls remain undocumented

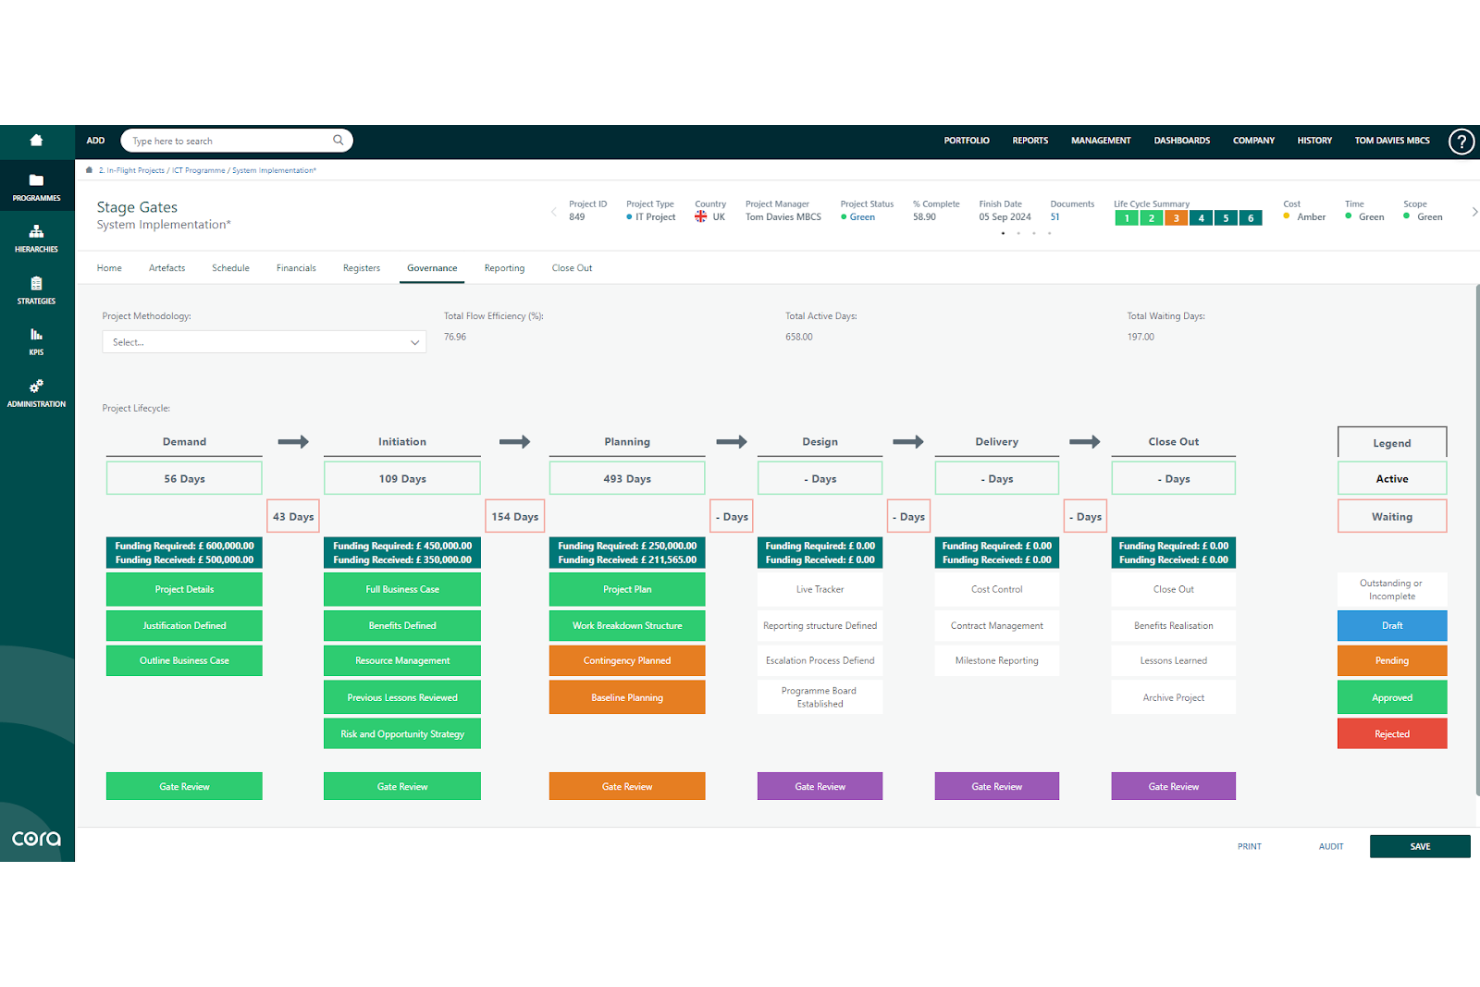
Cora Systems' antaivo is an enterprise project portfolio management platform that monitors portfolio schedule, cost, risk, and resources, and surfaces AI-driven corrective actions across projects and programs.
Who Is Cora Systems Best For?
antaivo is built for enterprise organizations that need centralized visibility across large, complex project portfolios—particularly those in regulated industries managing cost, risk, and resource allocation at scale.
Why I Picked Cora Systems
I picked Cora Systems as one of the best because antaivo brings a level of portfolio oversight that goes well beyond typical project tracking. I'm particularly drawn to its integrated master schedule, which links schedule changes directly to cost and risk impacts in real time. The AI assistant, taivo, can surface corrective actions across an entire portfolio and draft responses for a named approver, which is the kind of governed, audit-ready workflow I want when managing large, complex programs.
Cora Systems Key Features
- Integrated master schedule: Links project tasks directly to cost, schedule, and risk data so changes automatically show their downstream effects across the portfolio.
- Scenario analysis: Compares what-if portfolio configurations against cost, capacity, and strategic objectives before committing to changes.
- Earned value management: Tracks schedule variance, cost variance, and estimate at completion using live ERP financial data alongside your project plan.
- Workforce and capacity planning: Maps resource demand to skills, availability, and project timelines with what-if staffing scenarios across the portfolio.
Cora Systems Integrations
antaivo offers native integrations with SAP BTP, Microsoft Teams, Jira, and Salesforce. It also supports REST API, webhooks, and Boomi-powered iPaaS connectivity for custom integrations.
Pros and Cons
Pros:
- Governed approvals preserve accountability for AI changes
- AI can draft portfolio visuals from requests
- Portfolio dashboards connect schedules, costs, and risks
Cons:
- No shape library, diagram collaboration, or migration
- No documented flowchart or diagram canvas
Andre alternativer til Lucidchart
Nedenfor finner du en liste over flere alternativer til Lucidchart som jeg tok med på kortlisten. Selv om de ikke kom med blant de 10 beste, er de fortsatt verdifulle og verdt å undersøke nærmere.
- Miro
For collaborative online whiteboarding
- Creately
For team collaboration on diagrams
- Justinmind
For prototyping
- Box
For secure file sharing
- MindMeister
For project planning
- ClickUp
For task management
- Evernote Teams
For collaborative note-taking


Relaterte anmeldelser av prosjektstyringsprogramvare
Hvis du fortsatt ikke har funnet det du leter etter her, kan du se på disse andre relaterte verktøyene som vi har testet og evaluert:
- Prosjektstyringsprogramvare
- Ressursstyringsprogramvare
- Programvare for arbeidsflytautomatisering
- Tidsregistreringsprogramvare
- Oppgavestyringsprogramvare
- Samarbeidsverktøy
- Gantt-diagramverktøy
- Produktivitetsverktøy
- Programvare for prosjektoppfølging
- Programvare for prosjektplanlegging
How I Evaluate Lucidchart Alternatives
I evaluate Lucidchart alternatives on two levels: a baseline every tool must clear—think live co-editing, BPMN support, and Jira integration—and differentiators that determine the right fit for PM teams.
Core Functionality (Table Stakes For This List)
When I'm selecting tools for my list, I rank each one on a scale from 0 (does not offer the functionality) to 5 (excels in this area) for each core functionality listed below. Then, I calculate the tool's total score into a percentage. Each tool needs to achieve a minimum total score of 65% to be considered for inclusion.
- Diagramming Shape Library: I check whether a tool supports flowcharts, swimlanes, BPMN, UML, and ERDs—the diagram types PM teams actually use to document processes and system dependencies.
- Real-Time Collaboration: Multi-user co-editing matters when your team is distributed across time zones, so I look for live cursors, inline comments, and version history.
- PM Templates & Frameworks: A good template set should cover RACI matrices, retrospective boards, org charts, and process maps—not just generic flowchart starters.
- PM Tool Integrations: I evaluate how well each tool connects with platforms like Jira, Confluence, Asana, and Microsoft Teams, since diagrams lose value when they live outside your PM ecosystem.
- Data-Linked Diagrams: Tools that pull live data from spreadsheets or PM platforms to auto-generate org charts or workflow diagrams save hours of manual updates each sprint cycle.
- Export & Sharing Options: I look for PDF, PNG, SVG, and Visio export alongside secure share links and embed support, which are essential for stakeholder reviews and wiki documentation.
Once I have a list of tools that meet this criteria, I consider what sets each platform apart.
Differentiating Factors (What Sets Vendors Apart)
Here's how I compare and contrast different vendors:
Standout Features
AI diagram generation is a big differentiator—some tools can turn meeting notes or text prompts into process flows, which cuts hours off sprint documentation. I also look for an infinite whiteboard mode that supports sticky notes and freeform sketching during retros or planning sessions. Presentation mode matters here too, since walking stakeholders through a process map without exporting to slides keeps context intact and saves prep time.
Beyond Features
Pricing structure matters a lot here—I check whether a vendor charges per editor or per seat, since PM teams often need dozens of view-only stakeholders reviewing diagrams without inflating costs. Security and compliance are worth evaluating too, especially SSO and SCIM provisioning for enterprise PMOs managing access across large teams. I also consider scalability: how well the platform handles complex, multi-page diagrams with many concurrent editors during cross-functional planning sessions.
Viktige funksjoner du bør se etter i et Lucidchart-alternativ
Her er noen viktige funksjoner i Lucidchart som den alternative programvaren bør kunne gjenskape eller forbedre for å være et godt valg:
- Enkel utforming av figurer: Tilpassede skrifttyper, farger og linjestiler bidrar til å opprettholde et helhetlig utseende på tvers av diagrammene dine. Dette gir høy grad av personlig tilpasning og sørger for at diagrammene dine er visuelt tiltalende og i tråd med merkevaren eller prosjektstandardene dine.
- Opprett ryddige diagrammer: Ved å bruke smarte linjer til effektivt å koble sammen figurer, redusere rot og forbedre tydeligheten i diagrammene dine, sikrer du at forbindelsene dine er logiske, slik at diagrammene blir enklere å forstå.
- Tastatursnarveier: Tastatursnarveier bidrar til å fremskynde prosessen med å opprette diagrammer og utføre vanlige oppgaver raskt, noe som forbedrer produktiviteten og effektiviteten i arbeidsflyten.
- Utvidet lerret: Større lerreter gjør det mulig å arbeide med større diagrammer og gir deg mer plass til komplekse prosjekter. Denne funksjonen er særlig nyttig for detaljerte diagrammer som krever ekstra plass for å vise alle elementene tydelig.
- Organiser med beholdere: Ved å bruke beholdere eller svømmebaner til å organisere diagrammene dine i logiske seksjoner, holder du relaterte elementer samlet og gjør diagrammene mer strukturerte og enklere å navigere i.
- Samarbeid i sanntid: En samarbeidsbasert tilnærming sørger for at alle er på samme side og kan komme med innspill og tilbakemeldinger i sanntid.
- Presentasjonsbygger: Dette innebygde verktøyet effektiviserer prosessen med å lage gjennomarbeidede og virkningsfulle presentasjoner direkte fra diagrammene dine.
- Import fra Visio, Gliffy og Omnigraffle: Muligheten til å importere eksisterende diagrammer fra andre plattformer som Visio, Gliffy og Omnigraffle gjør at du kan fortsette å arbeide med prosjekter uten å måtte opprette diagrammene på nytt fra grunnen av.
- Automatisert diagramoppretting: Opprett diagrammer automatisk fra data, spar tid og sørg for nøyaktighet. Denne funksjonen bruker datainputt til å generere diagrammer, effektiviserer prosessen og reduserer manuelt arbeid.
Hvis du velger en plattform med disse funksjonene, styrker du teamets evne til å kommunisere komplekse ideer visuelt og samarbeide effektivt, noe som fører til bedre beslutninger og prosjektresultater.