


Visme Review: Key Features, Pros, Cons, and Updated Pricing for 2026



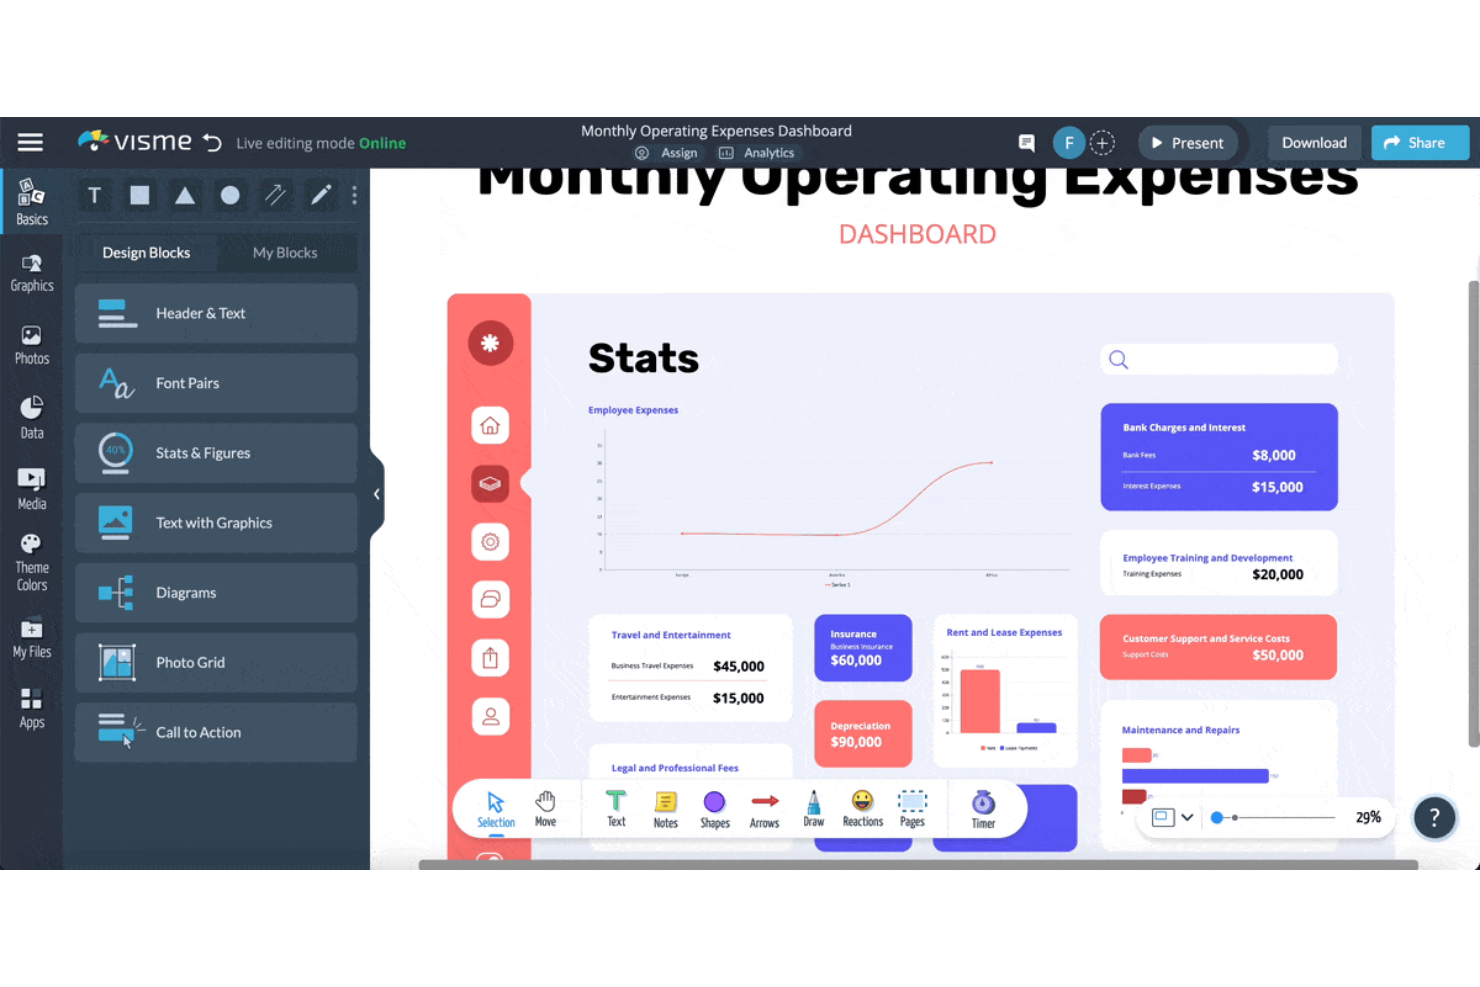
Visme is a design collaboration tool for teams that need to produce presentations, infographics, reports, and branded content without relying on a dedicated designer. I'd consider it over Canva if your team needs more than a template library. Visme goes deeper on data visualization, interactive content, and brand management across contributors.
Visme Evaluation Summary
- From $12.25/user/month (billed annually)
- Free plan available
Why Trust Our Software Recommendations
Our team has been testing and reviewing software since 2012. As project managers ourselves, we know how difficult—and important—it is to choose the right software.
For this guide, we evaluated tools using hands-on testing and independent research, scoring tools using our selection criteria. We also draw on insights from industry thought leaders and practicing project management experts.
Our reviews reflect our human editorial judgment, not a sales pitch.
Expert reviewers:
Visme Overview
Visme's clean interface, intuitive onboarding, and flexible design tools make it easy for teams to collaborate on professional presentations, infographics, and reports. Think of it as an all-in-one content creation for teams that want richer interactivity without a steep learning curve. Its pricing is competitive for the range of templates and integrations available, though animations and real-time co-editing can lag behind some alternatives. The support team is responsive, and the platform's asset management tools help keep projects organized. If you're evaluating options for marketing, education, or internal comms teams that need quick ramp-up and high-quality visual output, Visme is a solid pick—especially if you value ease of use over deep customization.
pros
-
Offers a wide selection of templates for visual projects
-
Built-in commenting and annotation for team collaboration
-
Strong data visualization and charting capabilities
cons
-
Real-time co-editing is limited compared to some competitors
-
Animations and interactivity options are basic for advanced needs
-
Export options can be restrictive on lower-tier plans
-

Celoxis
Visit WebsiteThis rating combines scores from multiple user review sites to reflect overall customer sentiment about the product.4.5 -
Smartsheet
Visit WebsiteThis rating combines scores from multiple user review sites to reflect overall customer sentiment about the product.4.5 -
Accelo
Visit WebsiteThis rating combines scores from multiple user review sites to reflect overall customer sentiment about the product.4.4




Our Review Methodology
How We Test & Score Tools
We’ve spent years building, refining, and improving our software testing and scoring system. The rubric is designed to capture the nuances of software selection and what makes a tool effective, focusing on critical aspects of the decision-making process.
Below, you can see exactly how our testing and scoring works across seven criteria. It allows us to provide an unbiased evaluation of the software based on core functionality, standout features, ease of use, onboarding, customer support, integrations, customer reviews, and value for money.
Core Functionality (25% of final scoring)
The starting point of our evaluation is always the core functionality of the tool. Does it have the basic features and functions that a user would expect to see? Are any of those core features locked to higher-tiered pricing plans? At its core, we expect a tool to stand up against the baseline capabilities of its competitors.
Standout Features (25% of final scoring)
Next, we evaluate uncommon standout features that go above and beyond the core functionality typically found in tools of its kind. A high score reflects specialized or unique features that make the product faster, more efficient, or offer additional value to the user.
We also evaluate how easy it is to integrate with other tools typically found in the tech stack to expand the functionality and utility of the software. Tools offering plentiful native integrations, 3rd party connections, and API access to build custom integrations score best.
Ease of Use (10% of final scoring)
We consider how quick and easy it is to execute the tasks defined in the core functionality using the tool. High scoring software is well designed, intuitive to use, offers mobile apps, provides templates, and makes relatively complex tasks seem simple.
Onboarding (10% of final scoring)
We know how important rapid team adoption is for a new platform, so we evaluate how easy it is to learn and use a tool with minimal training. We evaluate how quickly a team member can get set up and start using the tool with no experience. High scoring solutions indicate little or no support is required.
Customer Support (10% of final scoring)
We review how quick and easy it is to get unstuck and find help by phone, live chat, or knowledge base. Tools and companies that provide real-time support score best, while chatbots score worst.
Customer Reviews (10% of final scoring)
Beyond our own testing and evaluation, we consider the net promoter score from current and past customers. We review their likelihood, given the option, to choose the tool again for the core functionality. A high scoring software reflects a high net promoter score from current or past customers.
Value for Money (10% of final scoring)
Lastly, in consideration of all the other criteria, we review the average price of entry level plans against the core features and consider the value of the other evaluation criteria. Software that delivers more, for less, will score higher.
Core Features
Template Library
Access a wide selection of templates for presentations, infographics, and reports. Users can quickly adapt layouts to fit their brand and project needs.
Brand Kit
Store logos, fonts, and color palettes for consistent branding across projects. Teams can apply brand assets to any design with a single click.
Collaboration Tools
Add comments, annotations, and feedback directly on designs. Multiple users can review and discuss changes in a shared workspace.
Data Visualization
Create interactive charts, graphs, and maps using built-in tools. Visualize complex data with customizable styles and real-time editing.
Asset Management
Organize images, icons, and files in folders for easy access. Teams can reuse assets across multiple projects without re-uploading.
Export and Sharing Options
Download projects as PDF, JPG, HTML5, and more, or share via a live link. Control permissions to manage who can view or edit each project.
Ease of Use
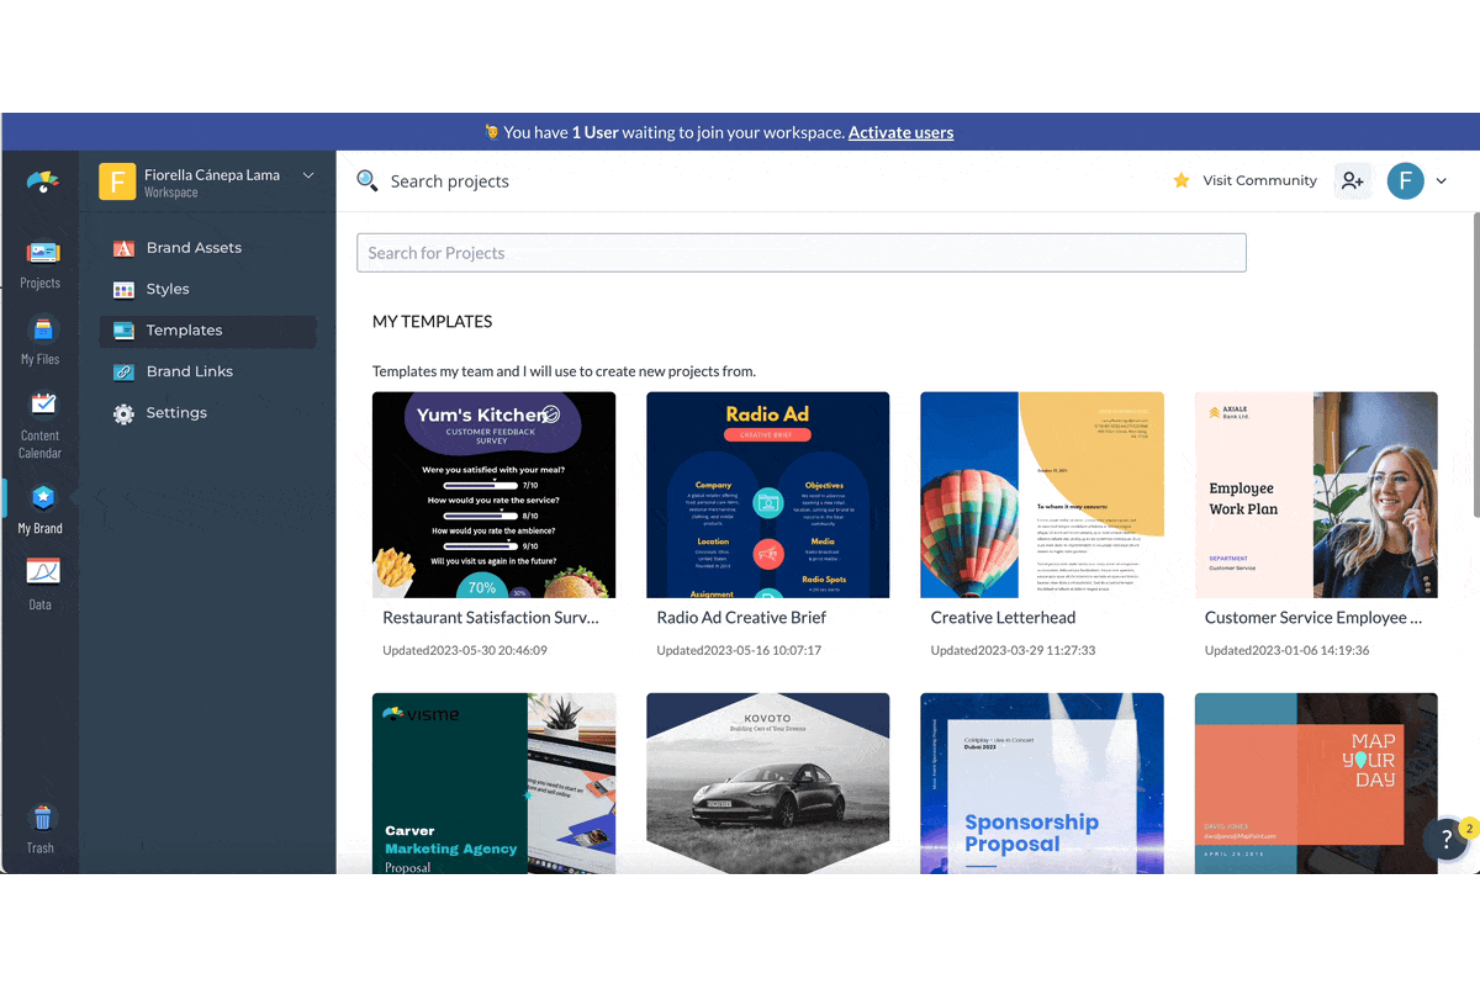
Visme is widely recognized for its user-friendly interface and intuitive drag and drop editor, making it accessible even for users with limited graphic design experience. The platform's organized workspace and clear labeling of features reduce confusion, while a broad selection of templates and stock images speed up project creation. Onboarding is quick, with guided tutorials and tooltips that help new users get started right away. Most users find collaboration and feedback tools easy to locate and use within shared projects, contributing to a smooth overall user experience.
Integrations
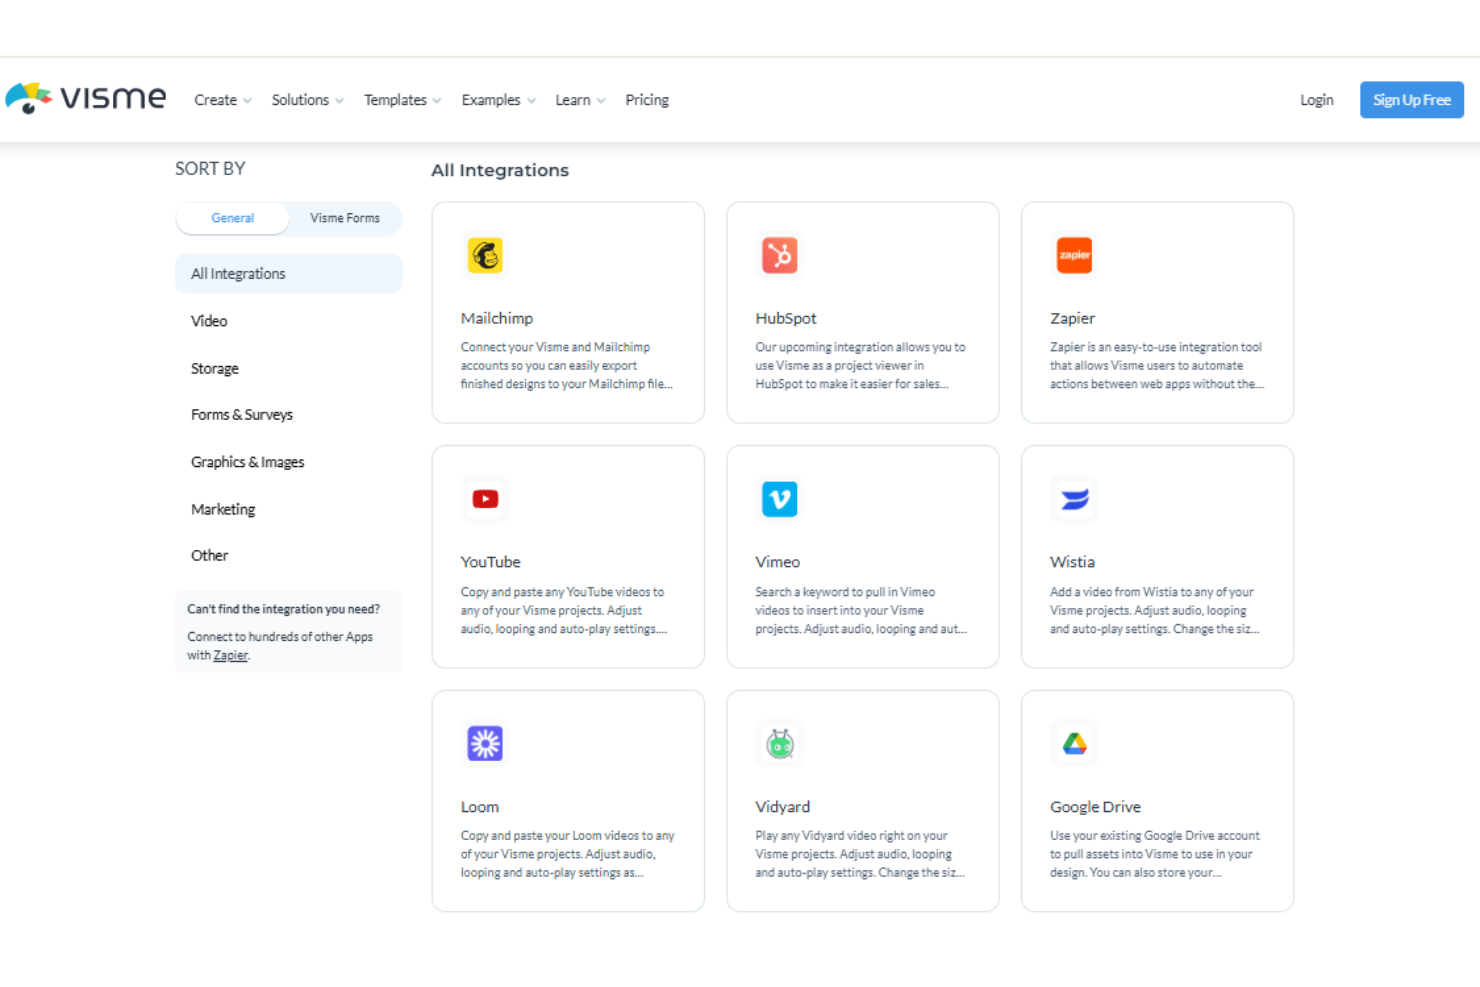
Visme integrates with Google Drive, JotForm, Slack, Loom, Mailchimp, HubSpot, Salesforce, Unsplash, and Zoom, among others.
Visme also offers an API and connects with third-party integration tools like Zapier.
Visme Specs
- A/B Testing
- Energy Production Estimates
- Geo-filtering
- Inventory Tracking
- Materials Library
- Media Streaming
- SCORM
- SEO
- Shading Analysis


