Die 10 besten Gantt-Diagramm-Ersteller für die Projektplanung im Jahr 2026

10 Beste Gantt-Diagramm-Ersteller (Shortlist)


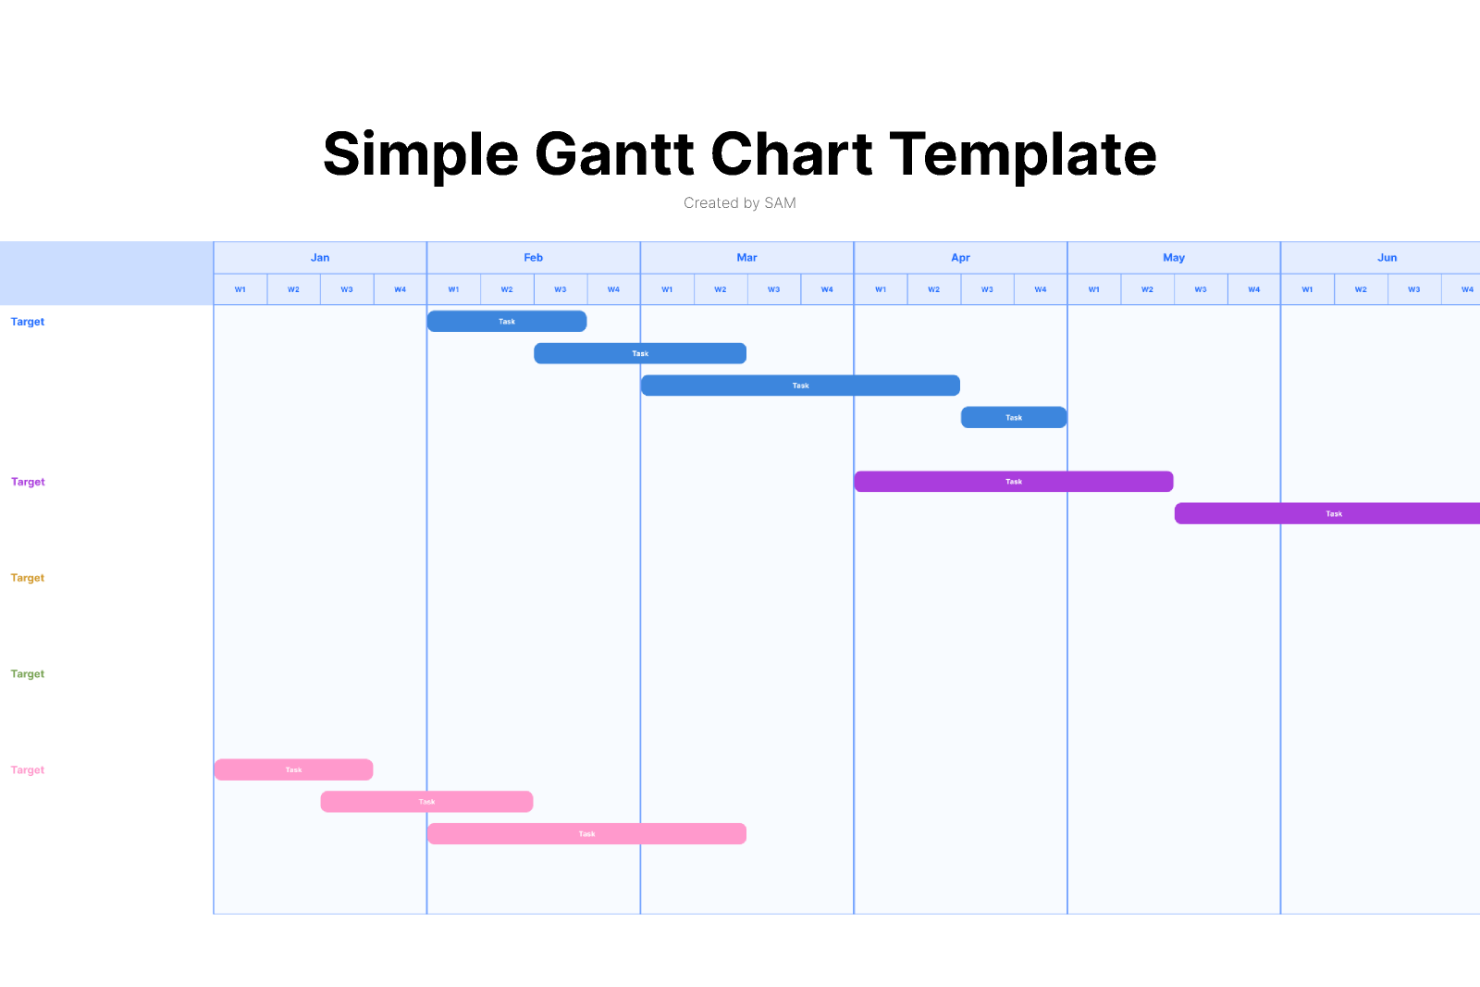
Die besten Gantt-Diagramm-Erstellungsprogramme ermöglichen Ihnen die Planung und das Management von Projekten mit einer übersichtlichen, visuellen Zeitleiste. So können Sie Aufgaben festlegen, Abhängigkeiten steuern und Meilensteine verfolgen. Ohne ein Gantt-Diagramm verpassen Sie Fristen, haben Schwierigkeiten mit der präzisen Fortschrittskontrolle und werden mit Missverständnissen konfrontiert, die zu Lieferverzögerungen und geringerer Nachvollziehbarkeit führen.
Mit über 15 Jahren Erfahrung im Projektmanagement habe ich mehr als 30 Tools zur Erstellung von Gantt-Diagrammen gründlich getestet und bewertet. Für jedes Tool stelle ich Ihnen die wichtigsten Funktionen und Anwendungsbereiche vor, sodass Sie die passende Option finden, die Ihre Teamabläufe unterstützt, die abteilungsübergreifende Zusammenarbeit erleichtert, Produktlaunches strukturiert und parallele Deadlines mit Übersicht und Kontrolle bewältigt.
So zuverlässig sind unsere Gantt-Diagramm-Software-Bewertungen
Wir testen und bewerten Gantt-Diagramm-Software seit 2012. Als Projektmanager wissen wir, wie entscheidend und gleichzeitig schwierig die Auswahl der richtigen Softwarelösung ist.
Wir führen umfassende Recherchen durch, um unseren Lesern bessere Kaufentscheidungen zu ermöglichen. Wir haben bereits über 2.000 Tools für verschiedene Anwendungsfälle im Projektmanagement getestet und mehr als 1.000 ausführliche Software-Bewertungen veröffentlicht. Erfahren Sie, wie wir Transparenz gewährleisten & unsere Bewertungsmethodik für Gantt-Diagramm-Tools.
Der große Gantt-Diagramm-Ersteller-Vergleich
Nutzen Sie diese Tabelle, um die wichtigsten Spezifikationen meiner Top-Gantt-Diagramm-Tools direkt zu vergleichen.
| Tool | Best For | Trial Info | Price | ||
|---|---|---|---|---|---|
| 1 | Am besten für individuelle Aufgabenansichten | Kostenloser Plan + kostenlose Demo verfügbar | Kostenlose Version für immer, kostenpflichtige Pläne ab $5/Monat | Website | |
| 2 | Am besten für visuelle Fortschrittsverfolgung geeignet | 14 Tage kostenlos testen | Ab $6/Nutzer/Monat | Website | |
| 3 | Am besten für interaktive Whiteboards | Kostenloser Plan verfügbar | Ab $8/Nutzer/Monat | Website | |
| 4 | Am besten geeignet für leicht zu bedienende Vorlagen | 30 Tage kostenlos testen | Ab $9.95/Monat | Website | |
| 5 | Am besten für Design-Zusammenarbeit | Kostenloser Plan verfügbar | Ab $3/Nutzer/Monat (jährlich abgerechnet) | Website | |
| 6 | Am besten geeignet zur Visualisierung von Aufgabenabhängigkeiten | Kostenloser Plan verfügbar | Ab $10.99/Nutzer/Monat (jährliche Abrechnung) | Website | |
| 7 | Am besten geeignet für KI-gestützte Arbeitsautomatisierung | 14 Tage kostenlos testen | Ab $9.80/Nutzer/Monat | Website | |
| 8 | Am besten für detaillierte Projektplanung | Kostenlose Testversion | Ab $7/Nutzer/Monat | Website | |
| 9 | Am besten für datengesteuerte Präsentationen | 30-tägige kostenlose Testversion | Ab $21/Nutzer/Monat | Website | |
| 10 | Am besten geeignet wegen benutzerfreundlicher Oberfläche | Kostenloser Tarif verfügbar | Ab $18/Nutzer/Monat | Website |


-

Celoxis
Visit WebsiteThis is an aggregated rating for this tool including ratings from Crozdesk users and ratings from other sites.4.4 -
Accelo
Visit WebsiteThis is an aggregated rating for this tool including ratings from Crozdesk users and ratings from other sites.4.4 -
Wrike
Visit WebsiteThis is an aggregated rating for this tool including ratings from Crozdesk users and ratings from other sites.4.3


Testberichte: Die besten Gantt-Diagramm-Ersteller
Hier finden Sie meine Zusammenfassung zu jedem Tool aus der Gantt-Diagramm-Software-Liste:
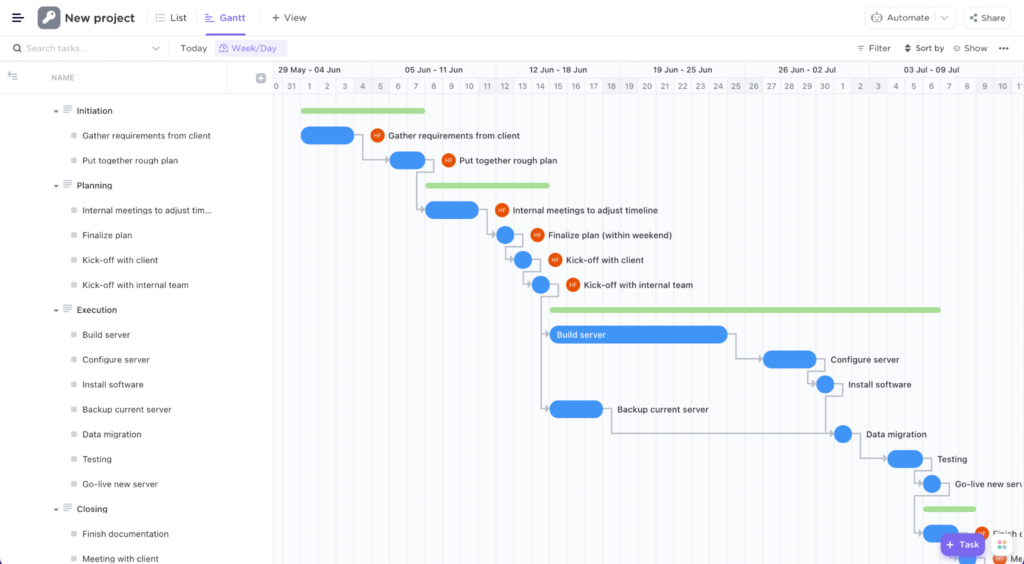
ClickUp ist eine umfassende Work-Management-Lösung, die neben zahlreichen anderen Funktionen wie Whiteboarding, Zielsetzung, Dokumentenmanagement und mehr auch ein Gantt-Diagramm-Tool bietet.
Ich habe kürzlich mit Jeff Cypher gesprochen, einem ehemaligen ClickUp-Berater, der jetzt für das Unternehmen arbeitet. Er betonte die Flexibilität von ClickUp bei Projektänderungen. 'Ich empfehle die Gantt-Ansicht von ClickUp für Projektmanager, die dynamische Projektanpassungen benötigen', sagt er.
Warum ich ClickUp ausgewählt habe
Ich habe mich für ClickUp wegen der anpassbaren Aufgabenansichten und Gantt-Diagramme entschieden. Die Drag-and-Drop-Oberfläche der Plattform ermöglicht es, Aufgaben und Abhängigkeiten einfach anzupassen und sorgt für visuelle Transparenz bei Projektzeitplänen und möglichen Engpässen. Mit Funktionen wie kritischem Pfad und Pufferzeit können Zeitplanprobleme schnell erkannt und behoben werden, was das Einhalten von Projektplänen erleichtert. Diese Anpassungsfähigkeit und Flexibilität machen ClickUp zur idealen Wahl für Teams, die ihre Projektmanagement-Prozesse optimieren möchten.
Wichtige Funktionen von ClickUp
ClickUp bietet eine Vielzahl weiterer Funktionen zur Erstellung von Gantt-Diagrammen und zur Projektverwaltung.
- Meilensteine: Sie können bedeutende Projektziele verfolgen, um sicherzustellen, dass Ihr Team wichtige Fristen einhält.
- Zeiterfassung: Damit können Sie die auf Aufgaben verwendete Zeit direkt in der Plattform überwachen, um Ihre Ressourcen und Termine besser zu steuern.
- Aufgabenprioritäten: Sie können Aufgaben Prioritätsstufen zuweisen, damit sich Ihr Team auf das Wichtigste konzentriert und Projekte reibungslos ablaufen.
- Mehrere Verantwortliche: Damit können Aufgaben mehreren Teammitgliedern zugewiesen werden, was die Zusammenarbeit fördert und Verantwortlichkeiten in Ihren Projekten stärkt.
ClickUp-Integrationen
Zu den Integrationen zählen Slack, Google Workspace, Dropbox, Figma, Vimeo, Zoom, Box und Microsoft Teams. Über Zapier sind weitere Integrationen möglich oder Sie erstellen eigene Integrationen mithilfe der API der Software.
Pros and Cons
Pros:
- Unbegrenzte Benutzer bei kostenlosem Plan
- Über 50 Widgets zur Anpassung Ihres Dashboards
- Unbegrenzter Dateispeicher bei allen kostenpflichtigen Plänen
Cons:
- Berichtsfunktion im kostenlosen Plan nicht verfügbar
- Speicher, Projekte und benutzerdefinierte Felder im kostenlosen Plan begrenzt
New Product Updates from ClickUp

ClickUp Introduces Brain² Company AI
ClickUp has introduced Brain², a self-improving company AI that routes to the best models and can complete work such as websites, slides, and project management tasks. For more information, visit ClickUp's official site.
 .
.Am besten für visuelle Fortschrittsverfolgung geeignet

monday.com ist eine Arbeitsmanagement-Plattform, die eine Vielzahl von Funktionen für die Projektplanung und Ressourcennachverfolgung bietet, darunter auch Gantt-Diagramme.
Warum ich monday.com ausgewählt habe
Ich habe mich für monday.com entschieden, weil es Ihnen ermöglicht, den Fortschritt visuell über das Gantt-Diagramm-Feature zu verfolgen. Die anpassbaren Gantt-Diagramme der Plattform ermöglichen es Ihnen, Zeitpläne zu visualisieren, Aufgaben zu priorisieren und Abhängigkeiten zu verwalten. Dadurch erhalten Sie Klarheit und Kontrolle über Ihre Projekte.
Die interaktiven Dashboards ermöglichen es Ihnen, Fortschritte, Budgets und Fristen auf einen Blick zu überwachen und fundierte Entscheidungen zu treffen. Diese Funktionen, kombiniert mit Tools für die Echtzeit-Kommunikation, machen monday.com zu einer starken Wahl für Teams, die die Projektübersicht und Koordination verbessern wollen.
monday.com Hauptfunktionen
monday.com bietet außerdem eine Reihe weiterer Funktionen zur Erstellung von Gantt-Diagrammen und zum Projektmanagement.
- Abhängigkeiten von Aufgaben: Sie können Beziehungen zwischen Aufgaben einfach visualisieren und verwalten, was Engpässe im Arbeitsablauf verhindert und einen reibungslosen Projektablauf ermöglicht.
- Fortschrittsverfolgung: Damit können Sie den Zustand Ihrer Projekte in Echtzeit mit visuellen Indikatoren überwachen, die Meilensteine und Fertigstellungsprozente anzeigen.
- Ressourcenmanagement: Mit dieser Funktion können Sie Zeitpläne und Zuständigkeiten zentralisieren und somit Ressourcen effizient zuteilen sowie die Koordination im Team verbessern.
- Projektstrukturpläne (Work Breakdown Structures): Sie können komplexe Projekte in überschaubare Aufgaben unterteilen, was bei der Projektplanung und -umsetzung hilft.
monday.com Integrationen
Zu den Integrationen gehören Dropbox, Excel, Google Kalender, Google Drive, Integromat, Slack, Trello und noch mehr über einen kostenpflichtigen Plan mit Zapier.
Pros and Cons
Pros:
- Benutzerfreundliche und intuitive Oberfläche
- Kostenloser Tarif verfügbar
- Umfassende Arbeitsmanagement-Plattform
Cons:
- Begrenzter Speicherplatz im Basic- und kostenlosen Tarif
- Gantt-Diagramme nicht im Basic- oder kostenlosen Tarif enthalten
New Product Updates from monday AI Work Space

monday.com Adds Managed Columns Across Boards
monday.com adds Managed Column to let teams standardize and reuse column labels across multiple boards from a single source of truth. The update helps organizations maintain consistency, clarity, and centralized control at scale. For more information, visit monday.com’s official site.
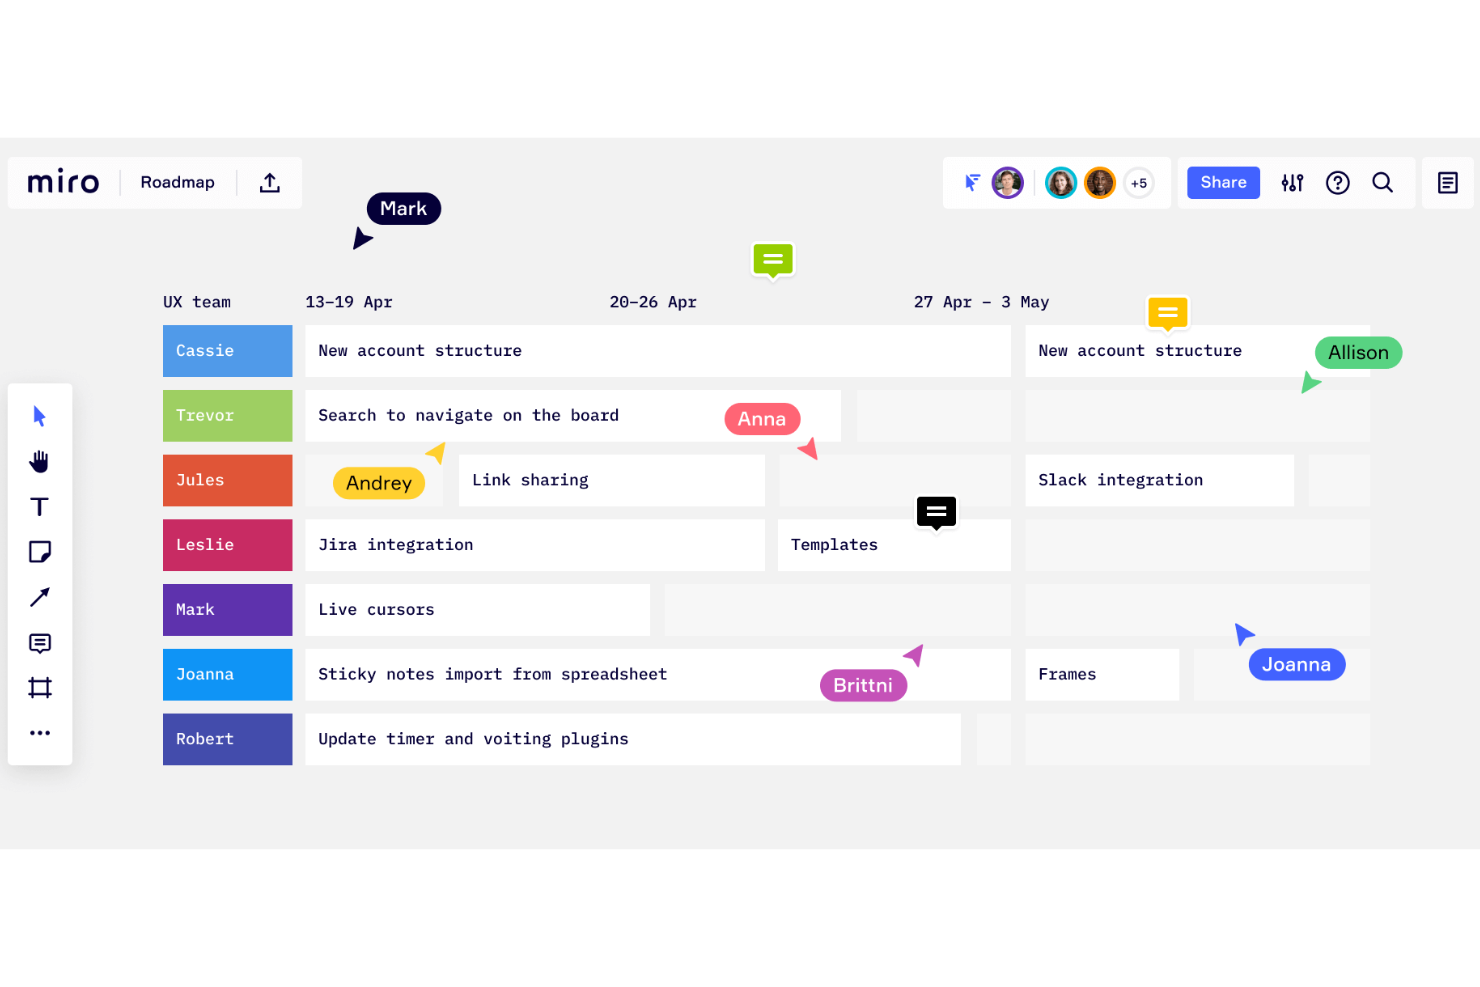
Miro ist ein kollaboratives Online-Whiteboard mit über 1.000 Vorlagen, darunter Mindmaps, Kanban-Boards, Gantt-Diagramme, Produkt-Wireframes, Recherche-Boards und Flussdiagramme.
Warum ich Miro ausgewählt habe
Ich habe Miro wegen seiner herausragenden Fähigkeit als interaktives Whiteboard ausgewählt, das sich perfekt für die Erstellung von Gantt-Diagrammen eignet. Was ich schätze, ist, dass Miro Ihrem Team ermöglicht, Projektzeitpläne direkt auf einer gemeinsamen Arbeitsfläche zu visualisieren und Aufgaben sowie Fristen in Echtzeit einfach anzupassen. Die Drag-and-Drop-Funktion macht die Anpassung Ihres Gantt-Diagramms unkompliziert und hält die Projektplanung dynamisch und reaktionsschnell.
Zusätzlich sorgt die Möglichkeit, in Echtzeit mit Teammitgliedern zusammenzuarbeiten, dafür, dass Eingaben und Aktualisierungen nahtlos integriert werden. Das hält zudem alle auf dem gleichen Stand, ohne lästigen Kommunikationsaufwand hin und her.
Wichtige Funktionen von Miro
Miro bietet außerdem mehrere weitere Funktionen, die das Erstellen von Gantt-Diagrammen und das Projektmanagement erleichtern.
- Aufwandsschätzung: Mit dieser Funktion können Sie Personen, Zeit und benötigte Tools für Aufgaben einbeziehen und so potenzielle Risiken frühzeitig in der Projektplanung erkennen.
- Meilensteine: Sie können Meilensteine festlegen und feiern, was das Team motiviert und sicherstellt, dass alle auf die Ziele des Projekts hinarbeiten.
- Anpassbare Vorlagen: Damit können Sie mit vorgefertigten Vorlagen starten oder Diagramme von Grund auf neu erstellen sowie Aufgaben, Zeitpläne und Farbcodierungen für bessere Übersicht und Klarheit hinzufügen.
- KI-Unterstützung: Die KI-Funktionen von Miro strukturieren Zeitpläne und Aufgaben automatisch basierend auf Ihren Eingaben, um Zeit zu sparen und Genauigkeit zu gewährleisten.
Miro-Integrationen
Zu den Integrationen gehören Zoom, Figma, Asana, Microsoft Teams, Jira, Slack, Google Drive, Box, Confluence, monday.com, Airtable, Notion, Azure und Webex. Einige Integrationen sind nur in kostenpflichtigen Tarifen verfügbar.
Pros and Cons
Pros:
- Intuitive und einfache Einrichtung
- Dauerhaft kostenloser Plan verfügbar
- Integrierte Kommunikationsfunktionen
Cons:
- Zoomfunktion kann bei größeren Projekten ruckelig sein
- Kein PDF-Export in hoher Qualität mit kostenlosem Plan
New Product Updates from Miro
Miro Adds Japan Data Residency for Enterprise Customers
Miro has introduced Japan data residency for enterprise customers, offering in-region storage for production data, backups, and metadata, plus in-region compute infrastructure. For more information, visit Miro's official site.
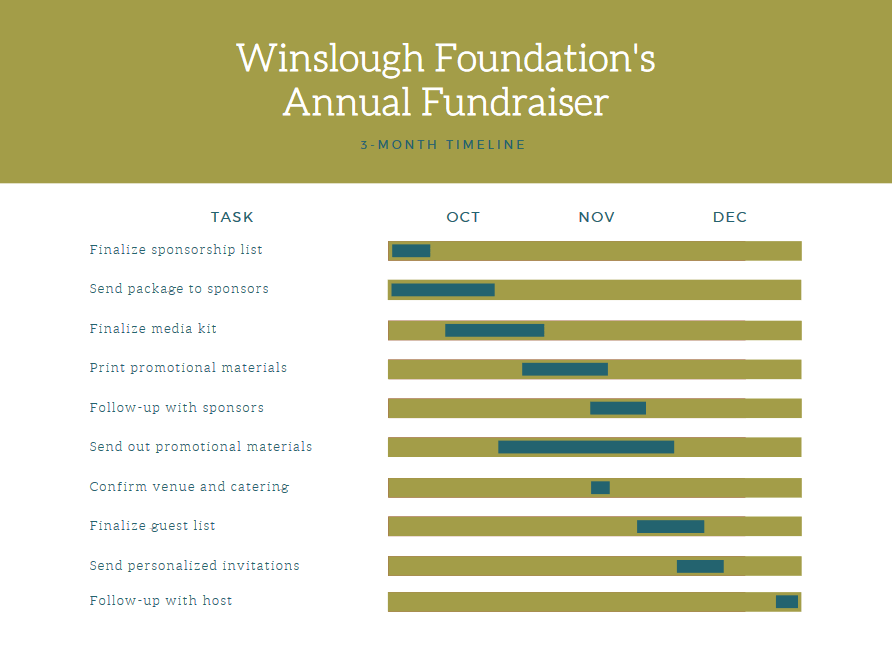
Canva ist eine Online-Design-Plattform, die extra benutzerfreundlich für Nicht-Designer entwickelt wurde. Sie bietet Vorlagen für alle möglichen Zwecke, von Gantt-Diagrammen über Präsentationsfolien, Infografiken, Social-Media-Grafiken und vieles mehr.
Warum ich Canva ausgewählt habe
Ich bin ein großer Fan der einfachen, klaren Drag-and-Drop-Oberfläche dieser Software. Sie ist selbst für diejenigen leicht zu bedienen, die wenig technisches Verständnis mitbringen. Canva wurde für diese Liste ausgewählt, weil es intuitiv bedienbar ist und eine riesige Auswahl direkt nutzbarer Vorlagen bietet. Aus Hunderttausenden verfügbaren Vorlagen kann man auswählen und sie an die eigenen Bedürfnisse anpassen. Meiner Meinung nach ist der kostenlose Canva-Tarif ein fantastischer und schneller Weg, ein präsentationsreifes Gantt-Diagramm ohne Kosten zu erstellen. Außerdem lässt sich die Plattform auch für andere Design-Anforderungen nutzen.
Wichtige Funktionen von Canva
Neben Vorlagen bietet Canva eine Reihe weiterer Funktionen, die bei der Erstellung von Gantt-Diagrammen hilfreich sind.
- Visuelle Anpassungswerkzeuge: Farben, Schriftarten und Stile lassen sich einfach an Ihre Marke anpassen, um Gantt-Diagramme funktional und optisch ansprechend zu gestalten.
- Meilensteinsetzung: Mit dieser Funktion können Sie wichtige Punkte im Projektzeitplan markieren, damit Ihr Team sich auf entscheidende Ergebnisse konzentrieren kann.
- Abhängigkeitsverwaltung: Sie können Aufgaben miteinander verknüpfen, um Abhängigkeiten sichtbar zu machen und so sicherstellen, dass Ihr Team den Ablauf der Projektaktivitäten versteht.
- Kollaborationsfunktionen: Sie und Ihr Team können gleichzeitig Änderungen vornehmen und ansehen, was die Kommunikation und Zusammenarbeit verbessert.
Canva-Integrationen
Integrationen umfassen WordPress, eClincher, Rippling, Sendible, Post Planner und Viraltag.
Pros and Cons
Pros:
- Sehr benutzerfreundlich und intuitiv
- Hunderttausende von Vorlagen
- Vorfertiges, präsentationsreifes Produkt, kein Designer nötig
Cons:
- Fehlen von fortgeschrittenen Gantt-Diagramm-Funktionen
- Begrenzte Download-Möglichkeiten im Gratis-Tarif
FigJam ist ein Online-Whiteboard-Tool, das die Zusammenarbeit von Teammitgliedern in Echtzeit erleichtert und eine dynamische Plattform für verschiedene Aktivitäten wie Brainstorming, Diagrammerstellung und strategische Planung bietet.
Warum ich FigJam ausgewählt habe
Ich habe mich für FigJam als Gantt-Diagramm-Tool entschieden, weil es eine Echtzeit-Zusammenarbeit ermöglicht – ein entscheidender Vorteil, um aktuelle Projektzeitpläne zu pflegen und die Team-Abstimmung sicherzustellen. Was FigJam besonders macht, ist die Integration von KI-Funktionen, die benutzerdefinierte Vorlagen generieren und wiederkehrende Aufgaben automatisieren – besonders nützlich bei der Erstellung und Aktualisierung von Gantt-Diagrammen.
Meiner Meinung nach eignet sich FigJam am besten für die Zusammenarbeit von Design-Teams in Echtzeit, da Teammitglieder nicht nur synchron mit Audio und Live-Chat zusammenarbeiten, sondern auch asynchron über Kommentare und Reaktionen kommunizieren können. So können alle Teammitglieder, unabhängig von Standort oder Zeitzone, an der Projektplanung mitwirken.
Wichtige Funktionen von FigJam
FigJam bietet weitere Funktionen, die es zu einer überzeugenden Wahl für Gantt-Diagramm-Software machen.
- Interaktives Whiteboard: Ermöglicht es Ihrem Team, in Echtzeit zusammenzuarbeiten, Ideen und Projektpläne direkt auf einer digitalen Leinwand zu skizzieren und komplexe Projektzeitpläne zu visualisieren.
- Meilenstein-Visualisierung: Der Fortschritt kann durch Markieren wichtiger Termine und Lieferobjekte in der Projektzeitachse verfolgt werden. So sind alle über die Projektziele im Bilde.
- Ressourcenmanagement-Werkzeuge: Ermöglicht eine effektive Zuordnung und Nachverfolgung von Ressourcen (über Vorlagen) sowie die Bewahrung von Ausgewogenheit und Effizienz bei den Projektaufgaben.
- Aufgabenzuweisung und -verwaltung: Aufgaben können direkt im Gantt-Diagramm Teammitgliedern zugewiesen werden, was die Termin- und Aufgabenverwaltung erleichtert.
FigJam-Integrationen
Zu den Integrationen gehören Figma, Microsoft Teams, Asana, Jira, Mixpanel und GitHub.
Pros and Cons
Pros:
- Bietet Community-Vorlagen für verschiedene Einsatzzwecke
- Integration mit Figma für Design-Zusammenarbeit
- Benutzerfreundliche und intuitive Oberfläche
Cons:
- Kein Offline-Zugriff verfügbar
- Einführung und Support sind auf den Enterprise-Plan beschränkt
Asana
Am besten geeignet zur Visualisierung von Aufgabenabhängigkeiten
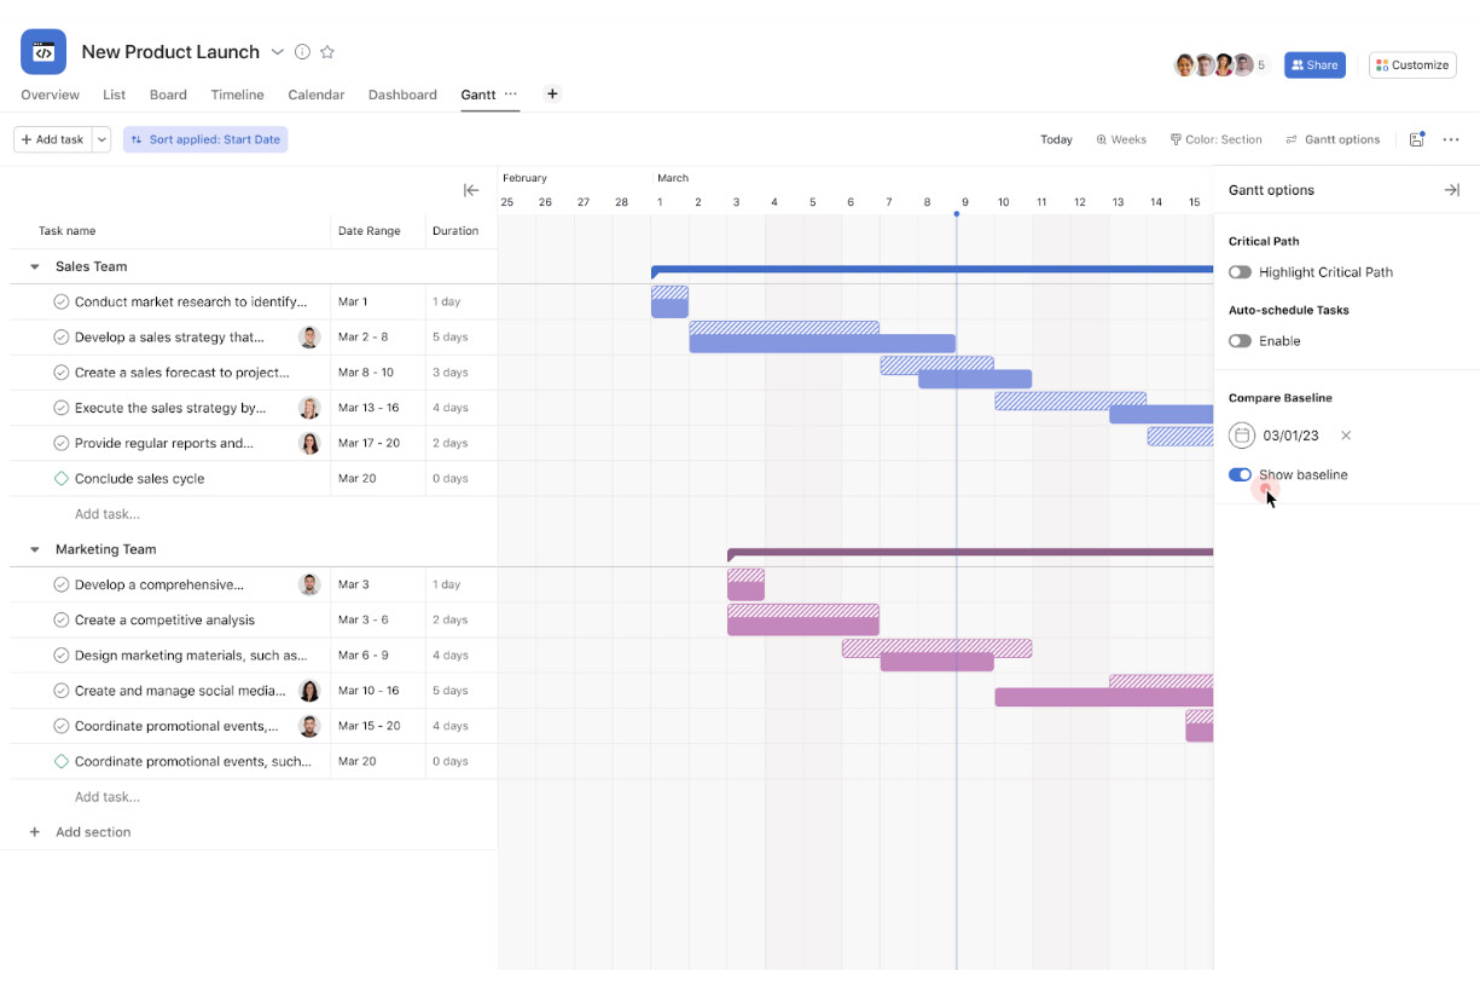
Asana ist ein Projektmanagement-Tool, das Teams dabei hilft, Arbeit im Laufe der Zeit zu planen, zu organisieren und nachzuverfolgen. Einer der wichtigsten Wege, wie dies geschieht, ist die Zeitachsen-Ansicht (auch Gantt-Ansicht genannt), in der Aufgaben entlang eines Zeitplans dargestellt werden.
Warum ich Asana gewählt habe
Ich habe Asana gewählt, weil Sie die Möglichkeit haben, Abhängigkeiten zwischen Aufgaben direkt in der Zeitachsenansicht zu zeichnen. Das bedeutet, dass Sie nicht nur Termine zu Aufgaben hinzufügen, sondern auch zeigen können, welche Aufgaben andere blockieren oder von ihnen abhängig sind. Wenn Änderungen auftreten (Aufgaben verschieben sich, Verzögerungen passieren), sehen Sie, wie sich eine Änderung auf abhängige Aufgaben auswirkt.
Wichtige Funktionen von Asana
Neben der Visualisierung von Aufgabenabhängigkeiten bietet Asana eine Reihe weiterer Funktionen für das Projektmanagement.
- Zeitachsen-Ansicht: Damit können Sie einen visuellen Projektplan erstellen und Fristen sowie Meilensteine für ein besseres Projekt-Tracking festlegen.
- Aufgabenpriorisierung: Sie können Aufgaben innerhalb von Projekten einfach priorisieren und sicherstellen, dass Ihr Team sich jederzeit auf das Wichtigste konzentriert.
- Projektvorlagen: Dies hilft Ihnen, neue Projekte schnell mit vordefinierten Strukturen und Workflows einzurichten.
- Team-Kollaborationstools: Mit eingebauten Kommunikationsfunktionen wie Kommentaren und Dateianhängen kann Ihr Team direkt innerhalb der Aufgaben zusammenarbeiten und Informationen austauschen.
Asana-Integrationen
Zu den Integrationen gehören Slack, Google Drive, Everhour, Microsoft Teams, Amazon Q Index, Splunk, Entra ID, Tableau, Jira Cloud, Microsoft Office 365, MuleSoft und BetterCloud.
Pros and Cons
Pros:
- Hervorhebung des kritischen Pfads, sodass Sie Blocker erkennen
- Ermöglicht das Zeichnen von Aufgabenabhängigkeiten in der Zeitachsenansicht
- Unterstützt Unteraufgaben innerhalb der übergeordneten Projektzeitachse
Cons:
- Komplexe Zeitachsen können unübersichtlich wirken
- Baseline-API-Zugriff für einige Daten eingeschränkt oder nicht vorhanden

Wrike ist eine cloudbasierte Projektmanagement-Plattform, die Gantt-Diagramm-Planung, Aufgabenverfolgung, Auslastungsmanagement und KI-gestützte Automatisierung für Projekte und Arbeitsabläufe kombiniert.
Für wen ist Wrike am besten geeignet?
Wrike eignet sich besonders für mittelgroße bis große Teams, die komplexe Projekte mit mehreren Beteiligten in den Bereichen Produkt, Marketing und Betrieb steuern.
Warum ich Wrike ausgewählt habe
Ich habe Wrike zu den besten Tools gewählt, weil seine KI-Automatisierung weit über oberflächliche Vorschläge hinausgeht. Die KI-Funktionen von Wrike können Arbeit zusammenfassen, Inhalte generieren und bei Projektmanagement-Arbeitsabläufen unterstützen. Mir gefällt auch Wrike Copilot, der direkt in Ihren Projekten integriert ist und auf Abruf Fragen zum Zeitplanstatus oder Sprintfortschritt beantwortet. Speziell bei der Arbeit mit Gantt-Diagrammen bedeutet dies weniger Zeit für die Suche nach Aktualisierungen und mehr Zeit für die Verwaltung der tatsächlichen Abhängigkeiten und Meilensteine.
Wichtige Funktionen von Wrike
- Interaktive Gantt-Zeitleiste: Aufgaben können direkt auf der Zeitleiste per Drag-and-Drop verschoben werden, um Arbeiten umzudisponieren und Abhängigkeiten in Echtzeit anzupassen.
- Auslastungsansicht: Anzeigen der zugewiesenen Aufgaben und der Kapazität jedes Teammitglieds über alle Projekte hinweg, um Überlastungen zu erkennen, bevor sie sich auf die Lieferung auswirken.
- Individuelle Dashboards: Erstellung projektspezifischer Dashboards zur übersichtlichen Anzeige des Aufgabenfortschritts, überfälliger Elemente und des Meilensteinstatus.
- Projektvorlagen: Speichern und Wiederverwenden von Projektstrukturen, einschließlich Zeitplänen und Aufgabenfolgen, als Vorlagen für wiederholbare Abläufe.
Wrike-Integrationen
Wrike bietet über 400 Integrationen durch eingebaute Konnektoren und das Wrike Integrate Add-on, einschließlich Tools wie Salesforce, Microsoft Teams, Google Sheets, Slack, Adobe Creative Cloud, Jira, Power BI, Tableau, Miro und Zoom. Es verbindet sich auch mit Zapier und stellt eine offene RESTful API für individuelle Integrationen bereit.
Pros and Cons
Pros:
- Eingebauter kritischer Pfad mit Pufferzeiten-Analyse
- Importiert .MPP-, .MPX- und .XML-Projektdateien
- Abhängige Aufgabendaten passen sich bei Änderungen automatisch an
Cons:
- Die Navigation zwischen Bereichen und Ansichten wirkt unübersichtlich
- Zeiterfassung erst ab dem Business-Tarif verfügbar
New Product Updates from Wrike

Wrike Improves Template Mapping and Dashboard Filters
Wrike expanded Template Mapping with workflow and custom item type mapping, and made the new filter experience the default for Dashboard chart widgets. These updates simplify workspace setup and provide a more consistent dashboard filtering experience. For more information, visit Wrike’s official site.
 .
.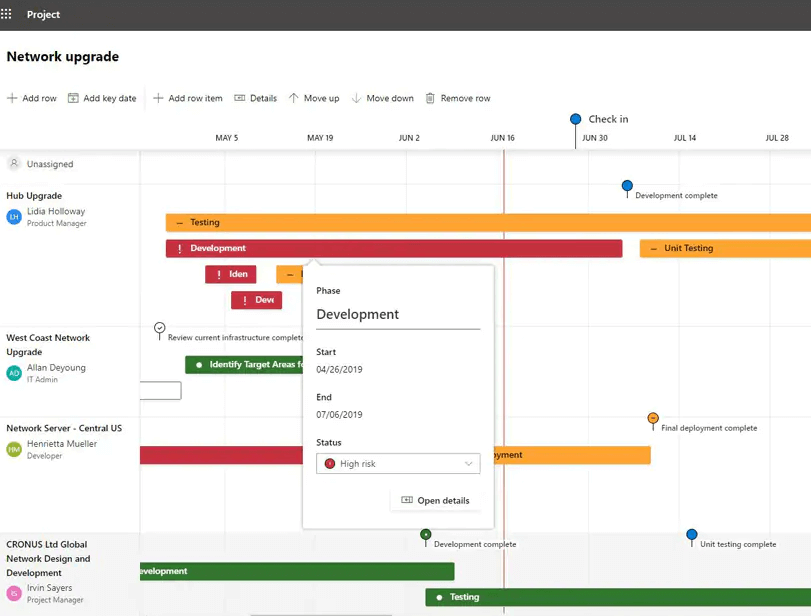
Microsoft Project ist eine von Microsoft entwickelte und vertriebene Projektmanagement-Software. Sie wurde entwickelt, um Ihnen zu helfen, Projekte unterschiedlichster Größen und Komplexitäten zu planen, zu verfolgen und zu verwalten – unter anderem mit einem Gantt-Diagramm-Generator.
Warum ich Microsoft Project ausgewählt habe
Ich habe Microsoft Project wegen seiner detaillierten Projektplanung gewählt – es ist eine hervorragende Lösung zur Erstellung von Gantt-Diagrammen. Mit Funktionen wie hierarchischer Aufgabenorganisation und Verknüpfung von Abhängigkeiten können Sie komplexe Projektzeitpläne übersichtlich visualisieren.
Die Anpassung der Gantt-Balken ermöglicht individuelle visuelle Hinweise und hilft Ihnen, komplexe Projektaufgaben zu steuern. Darüber hinaus sorgen integrierte Werkzeuge für Ressourcenzuweisung und Budgetverwaltung dafür, dass die Projektplanung im Einklang mit den Möglichkeiten Ihres Teams und mit finanziellen Vorgaben bleibt.
Microsoft Project Hauptfunktionen
Microsoft Project bietet außerdem eine Vielzahl weiterer Funktionen, die bei der Erstellung von Gantt-Diagrammen hilfreich sind.
- Zeitleistenansicht: So erhalten Sie eine Übersicht über Ihren Projektzeitplan und einen kompakten Überblick, der die detaillierte Gantt-Diagramm-Ansicht ergänzt.
- Meilensteinverfolgung: Sie können bestimmte Punkte in Ihrem Projektzeitplan kennzeichnen, um sich auf wichtige Etappenziele zu konzentrieren und sicherzustellen, dass Ihr Team entscheidende Termine einhält.
- Ressourcen-Pooling: Damit können Sie Ressourcen projektübergreifend verwalten und Teammitglieder sowie Ausrüstung effizient zuteilen.
- Priorisierung von Aufgaben: Durch die Vergabe von Prioritätsstufen an Aufgaben bearbeiten Sie zunächst die wichtigsten Aktivitäten, optimieren Ihre Abläufe und steigern die Produktivität.
Microsoft Project Integrationen
Integrationen umfassen weitere Microsoft-Software wie Outlook, Excel, Skype und mehr.
Pros and Cons
Pros:
- Modul zur Priorisierung von Antrieben für die Bewertung von Strategien/Zielen
- Hilfreiche Beschreibungen von Projektvorlagen zur Unterstützung
- Integration mit anderer Microsoft-Software
Cons:
- Begrenzte Anpassungsmöglichkeiten
- Hohe Lernkurve
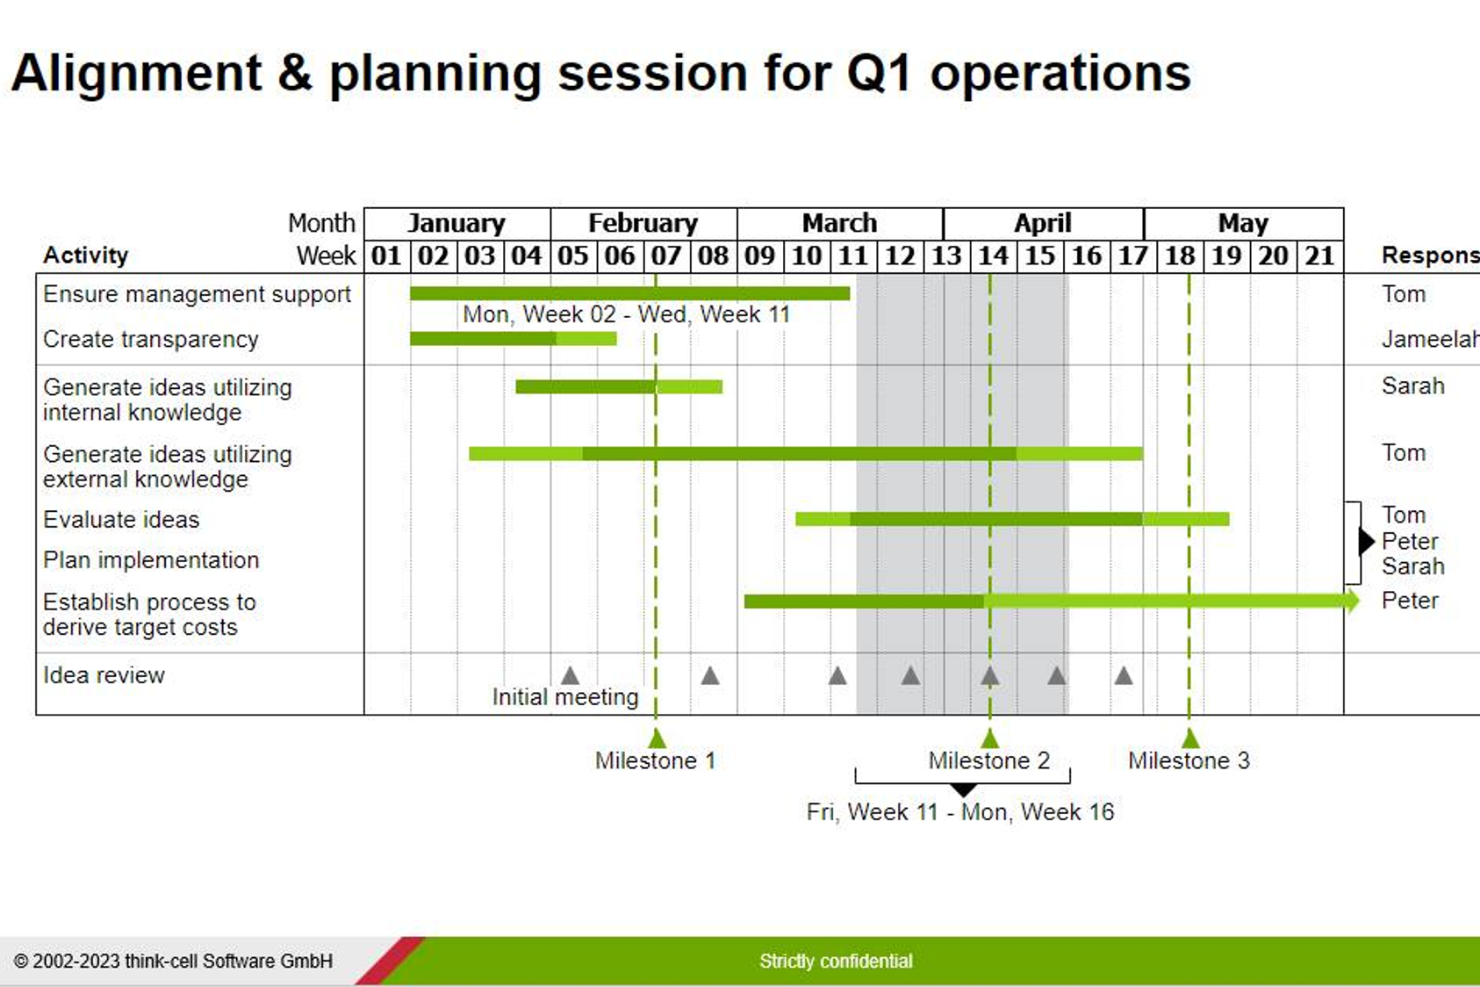
think-cell ist eine Software-Erweiterung für Microsoft PowerPoint und Excel, die Ihnen hilft, verschiedene Diagrammtypen für Ihre Präsentationen vor Stakeholdern einfach zu erstellen, einschließlich Gantt-Diagrammen.
Warum ich think-cell ausgewählt habe
Für Projektmanager, die mehr als 2 Stunden pro Woche mit der Vorbereitung von Präsentationen in Excel oder PowerPoint verbringen, glaube ich, dass diese Software Ihnen eine Menge Zeit und Kopfschmerzen ersparen wird. Sie ermöglicht es Ihnen, anpassbare, kalenderbasierte Gantt-Diagramme direkt in PowerPoint zu erstellen, mit Drag-and-Drop-Funktionen für Zeitachsen, Abhängigkeiten und Meilensteine. Sie können auch Excel-Tabellen mit PowerPoint-Diagrammen verknüpfen, sodass Aktualisierungen der Daten automatisch in Ihr Gantt-Diagramm übernommen werden.
think-cell Hauptfunktionen
think-cell bietet eine Reihe weiterer Funktionen, die speziell auf die Erstellung effektiver Gantt-Diagramme zugeschnitten sind.
- Interaktive Aktivitätseingabe: Damit können Sie Aktivitäten direkt im Gantt-Diagramm erfassen und so den Prozess zur Erstellung Ihres Projektplans optimieren.
- Anpassbare Arbeitswochen: Sie können die Arbeitswochen individuell festlegen, zum Beispiel 5- oder 7-Tage-Wochen, um die tatsächlichen Arbeitszeiten Ihres Teams genau abzubilden.
- Zeitraumklammern: Damit können Sie ganz einfach Klammern hinzufügen, um die Dauer bestimmter Aufgaben oder Projektphasen hervorzuheben und visuell klar darzustellen.
- Automatische Datumsaktualisierung: Wenn Sie Aufgaben oder Meilensteine verschieben, werden die Daten automatisch angepasst, sodass Ihre Zeitachse ohne manuelle Nacharbeit stets aktuell bleibt.
think-cell Integrationen
Integrationen umfassen Microsoft PowerPoint und Microsoft Excel.
Pros and Cons
Pros:
- Erweitert Ihre Möglichkeiten mit Microsoft-Produkten
- Automatisierungen beschleunigen wiederkehrende Aufgaben
- Benutzerfreundlich, auch für Nicht-Technikexperten
Cons:
- Es ist schwierig, Daten nach Erstellung eines Diagramms auf ein neues Diagramm zu übertragen
- Vorrangig für Windows konzipiert
Visor ist ein Gantt-Diagramm-Tool, das Nutzern hilft, kostenlose und farbenfrohe Gantt-Diagramme und Tabellen zu erstellen, die mit SaaS-Apps wie Jira verbunden werden können. Mit Visor können Sie Ihre Projektzeitpläne visualisieren, Ressourcen planen, Fortschritte verfolgen und Abhängigkeiten verwalten.
Warum ich Visor gewählt habe
Ich habe Visor wegen seiner benutzerfreundlichen Oberfläche ausgewählt, die meiner Erfahrung nach besonders hilfreich ist, um bei der Verwaltung komplexer Projekte organisiert und im Zeitplan zu bleiben. Die bidirektionale Synchronisation mit SaaS-Anwendungen sorgt dafür, dass Ihre Diagramme und Berichte immer aktuell sind, ohne dass Sie manuell eingreifen müssen, und Ihnen die Möglichkeit gibt, Gantt-Diagramme mit den Informationen aus Ihrem SaaS-Tool zu erstellen – selbst wenn die Daten nicht perfekt aufbereitet sind. Sie können für jedes Ihrer Teammitglieder Ansichten erstellen, ohne für alle einzelne Konten einrichten zu müssen. Sie können Aufgaben außerdem per Drag-and-Drop verschieben, um Zeitpläne schnell anzupassen.
Visor Hauptfunktionen
Visor bietet außerdem eine Reihe weiterer Funktionen zum Projektmanagement und zur Erstellung von Gantt-Diagrammen.
- Mehrere Ansichten: Visor stellt Gantt-, Tabellen-, Kanban- und Zeitachsenansichten bereit, sodass Ihr Team Projekte aus verschiedenen Perspektiven verwalten und die Ansicht wählen kann, die am besten zum Arbeitsstil passt.
- KI-Smart-Vorlagen: Sie können KI-gestützte Vorlagen nutzen, um schnell Gantt-Diagramme zu erstellen, die auf Ihre spezifischen Aufgaben zugeschnitten sind. So spart Ihr Team wertvolle Zeit und Aufwand beim Projektaufbau.
- Meilenstein-Hinzufügung: Damit können Sie Meilensteine für Aufgaben und Unteraufgaben einfach hinzufügen und farblich kennzeichnen. Das hilft, den Projektfortschritt zu visualisieren und wichtige Lieferungen zu priorisieren.
- Benutzerdefinierte Felder: Sie können benutzerdefinierte Felder zum Erfassen und Kennzeichnen von Daten innerhalb der Gantt-Diagramme erstellen. Das bietet Flexibilität, um Informationen entsprechend den individuellen Anforderungen Ihres Projekts zu erfassen und zu kategorisieren.
Visor Integrationen
Integrationen sind unter anderem Jira, Salesforce und Asana.
Pros and Cons
Pros:
- Ermöglicht Workflows über mehrere Apps hinweg
- Bidirektionaler Sync, der Infos zur Quelle zurückschreibt
- Farbenfrohe und benutzerfreundliche Oberfläche
Cons:
- Sync-Guthaben ist begrenzt
- Nur zur Ansicht – benötigt ein weiteres Tool
Weitere Gantt-Diagramm-Ersteller-Software
Die oben aufgeführten Tools sind nicht die einzigen Gantt-Diagramm-Lösungen auf dem Markt. Hier sind einige weitere Programme, die eine Erwähnung verdienen.
- MindView
Am besten geeignet für Projektstrukturpläne (WBS)
- TeamGantt
Am besten geeignet zur Verfolgung kritischer Projektpfade
- Gantter
Am besten für KI-Empfehlungen
- GanttPRO
Am besten für das Management von Arbeitsauslastung in Echtzeit
- Smartsheet
Am besten für abteilungsübergreifende Planung
- Zoho Projects
Am besten für Skalierbarkeit
- ProjectManager
Am besten für große Unternehmen
- Office Timeline
Am besten für die Erstellung von Zeitachsen


Sehen Sie sich unser Video zu den besten Gantt-Diagramm-Erstellern an:

Weitere Projektmanagement-Tool-Bewertungen
Falls Sie hier noch nicht fündig geworden sind, schauen Sie sich auch unsere anderen Testberichte zu Projektmanagement-Tools an, die wir für Sie zusammengestellt haben:
- Produktivitäts-Tools
- Projekt-Tracking-Software
- Projektplanungssoftware
- Projektmanagement-Software
- Ressourcenmanagement-Software
- Workflow-Automatisierungssoftware
- Projektmanagement-Software mit Gantt-Diagramm
Auswahlkriterien für Gantt-Diagramm-Ersteller
Bei der Auswahl der besten Gantt-Diagramm-Tools für diese Liste habe ich typische Bedürfnisse und Schmerzpunkte von Käufern berücksichtigt, wie die Möglichkeit, Projektzeitpläne einfach nachzuverfolgen und mit Teammitgliedern zusammenzuarbeiten. Ich habe den folgenden Bewertungsrahmen genutzt, um meine Analyse strukturiert und fair zu gestalten:
Kernfunktionen (25% der Gesamtbewertung)
Um in diese Liste aufgenommen zu werden, musste jede Lösung die folgenden typischen Anwendungsfälle abdecken:
- Erstellung und Bearbeitung von Gantt-Diagrammen
- Verfolgung des Projektfortschritts mit Meilensteinen
- Zuweisung von Aufgaben an Teammitglieder
- Visualisierung von Abhängigkeiten zwischen Aufgaben
- Export von Gantt-Diagrammen in verschiedenen Formaten
Weitere herausragende Funktionen (25% der Gesamtbewertung)
Um die Auswahl weiter einzugrenzen, habe ich zudem auf folgende besondere Funktionen geachtet:
- Integration mit gängigen Projektmanagement-Tools
- Echtzeit-Kollaborationsfunktionen
- Anpassbare Vorlagen für Gantt-Diagramme
- Erweiterte Ressourcenmanagement-Werkzeuge
- KI-gestützte Terminempfehlungen
Benutzerfreundlichkeit (10% der Gesamtbewertung)
Um einen Eindruck von der Benutzerfreundlichkeit jeder Lösung zu gewinnen, habe ich auf folgende Aspekte geachtet:
- Eine intuitive Drag-and-Drop-Oberfläche
- Klar strukturierte und ansprechende Diagrammdesigns
- Einfache Navigation zwischen Projekten
- Unkomplizierte Aktualisierung und Änderung von Aufgaben
- Geringe Systemverzögerungen auch bei großen Projekten
Onboarding (10% der Gesamtbewertung)
Um die Benutzerfreundlichkeit beim Einstieg zu bewerten, habe ich geprüft, ob das Tool Folgendes bietet:
- Zugang zu interaktiven Produkttouren
- Bereitgestellte Vorlagen für einen schnellen Start
- Umfassende Trainingsvideos und Dokumentationen
- Live-Chat- oder Chatbot-Support während der Einrichtung
- Webinare oder Demo-Sessions für neue Nutzer
Kundensupport (10% der Gesamtbewertung)
Zur Bewertung des Kundensupports jedes Softwareanbieters habe ich darauf geachtet, ob das Gantt-Diagramm-Tool folgende Leistungen bietet:
- Rund um die Uhr erreichbarer Kundensupport
- Eine ausführliche Wissensdatenbank oder FAQs
- Verschiedene Kontaktmöglichkeiten wie E-Mail, Chat und Telefon
- Antworten auf Anfragen in angemessener Zeit
- Proaktive Kontaktaufnahme zur Problemlösung
Preis-Leistungs-Verhältnis (10% der Gesamtbewertung)
Um das Preis-Leistungs-Verhältnis jeder Plattform zu bewerten, habe ich geprüft, ob das Tool Folgendes bietet:
- Flexible Preispläne für verschiedene Teamgrößen
- Kostenlose Testphasen oder Freemium-Optionen
- Erweiterte Funktionen zu einem wettbewerbsfähigen Preis
- Alle notwendigen Funktionen bereits in den Basistarifen
- Verborgene Kosten oder überraschende Zusatzgebühren
Kundenbewertungen (10% der Gesamtbewertung)
Um das Gesamtbild der Kundenzufriedenheit zu erfassen, habe ich geprüft, ob sich in den Kundenrezensionen folgende Aspekte finden:
- Benutzerfreundlichkeit und einfache Anwendung
- Zuverlässigkeit und Verfügbarkeit
- Zufriedenheit mit dem Kundensupport
- Wahrgenommenes Preis-Leistungs-Verhältnis
- Gesamteffektivität im Projektmanagement
So wählen Sie eine Gantt-Diagramm-Software aus
Es ist leicht, sich in langen Funktionslisten und komplizierten Preisstrukturen zu verlieren. Damit Sie den Überblick behalten, finden Sie hier eine Checkliste mit wichtigen Auswahlkriterien:
| Faktor | Was zu beachten ist |
|---|---|
| Skalierbarkeit | Stellen Sie sicher, dass das Tool mit Ihrem wachsenden Team und zunehmend komplexeren Projekten Schritt halten kann, ohne langsamer zu werden. |
| Integrationen | Prüfen Sie, ob die Software mit den von Ihnen bereits genutzten Tools wie Projektmanagement-Software, CRM-Systemen oder Cloud-Speichern verbunden werden kann. |
| Anpassbarkeit | Suchen Sie nach Möglichkeiten, Gantt-Diagramme mit benutzerdefinierten Feldern, Farben oder Layouts an den Arbeitsablauf Ihres Teams anzupassen. |
| Benutzerfreundlichkeit | Stellen Sie sicher, dass die Benutzeroberfläche intuitiv ist, damit Ihr Team schnell loslegen kann, ohne lange Schulungen zu benötigen. |
| Budget | Vergleichen Sie die Preispläne und stellen Sie sicher, dass die von Ihnen benötigten Funktionen enthalten sind, ohne teure Zusatzpakete zu erfordern. |
| Sicherheitsmaßnahmen | Vergewissern Sie sich, dass die Plattform über starke Datenschutzmaßnahmen wie Verschlüsselung und Zugriffskontrollen verfügt, um Ihre Projekte zu schützen. |
| Zusammenarbeit | Prüfen Sie, ob die Software die Teamzusammenarbeit durch Funktionen wie Aufgabenkommentare, Echtzeit-Updates und Dateifreigabe unterstützt. |
| Berichtsfunktionen | Stellen Sie sicher, dass klare, umsetzbare Berichte bereitgestellt werden, mit denen Fortschritte verfolgt und fundierte Entscheidungen getroffen werden können. |
Trends bei Gantt-Diagramm-Tools
Hier ein Einblick in einige Trends rund um Gantt-Diagramm-Tools, von denen wir erwarten, dass sie sich dieses Jahr weiterentwickeln:
- Bessere visuelle Oberflächen: Software wie Smartsheet und ClickUp haben erhebliche Verbesserungen der Benutzeroberfläche vorgenommen, um die Visualisierung von Projekten intuitiver, farbenfroher und interaktiver zu gestalten.
- Integration künstlicher Intelligenz: Tools wie Hive und Height bieten KI-Funktionen, die zeitraubende Aufgaben automatisieren und vorausschauende Einblicke liefern können. Das ist besonders hilfreich bei der Ressourcenplanung und Risikoerkennung und kann die Arbeitsbelastung senken.
- Echtzeit-Kollaborations-Plugins: Da spezialisierte Software abnimmt, bieten mehr Tools Plugins und Integrationen, mit denen Nutzer sich austauschen, Dateien teilen und Entscheidungen treffen können, ohne die Plattform zu verlassen.
Was ist ein Gantt-Diagramm-Tool?
Ein Gantt-Diagramm-Tool ist eine Projektmanagement-Lösung zur Erstellung von Gantt-Diagrammen—visuelle Zeitpläne von Projekten—und deren Verwendung zur Fortschrittsverfolgung. Mit Gantt-Software können Sie Aufgaben, Zeitspannen, Start- und Enddaten, Abhängigkeiten, den kritischen Pfad sowie Ressourcen planen.
Programme zur Erstellung von Gantt-Diagrammen bieten oft zudem Funktionen zur Zuweisung von Aufgaben und Ressourcen, erleichtern die Projektplanung und schaffen Transparenz und Abstimmung beim Projektplan und Projektstand.
Funktionen von Gantt-Diagramm-Software
Achten Sie bei der Auswahl einer Gantt-Diagramm-Software auf folgende Schlüsselfunktionen:
- Aufgabenabhängigkeiten: Sie können Aufgaben einfach miteinander verknüpfen und sehen, was zuerst erledigt werden muss. So erkennen Sie Engpässe und halten Projekte in Bewegung.
- Drag-and-drop-Oberfläche: Sie können per Klick Aufgaben direkt auf der Zeitleiste verschieben—so ist das Anpassen von Zeitplänen schnell und intuitiv.
- Meilensteinverfolgung: Sie können wichtige Meilensteine setzen und visualisieren, damit jeder weiß, wie die Arbeit voranschreitet.
- Ressourcenzuweisung: Weisen Sie Teammitglieder oder Ressourcen konkreten Aufgaben zu, vermeiden Sie Überlastung und sorgen Sie für Synchronisation.
- Zoom- und Zeitachsenanpassung: Wechseln Sie zwischen einer stunden- bis monatsgenauen Ansicht, um Details oder das große Ganze im Blick zu behalten.
- Fortschrittsverfolgung: Überwachen Sie den Fertigstellungsgrad jeder Aufgabe – so behalten Sie stets den aktuellen Stand im Blick.
- Kollaborationsfunktionen: Laden Sie Kollegen ein, hinterlassen Kommentare oder teilen Projektupdates, um Teamarbeit einfach und Kommunikation reibungslos zu machen.
- Export- und Sharing-Optionen: Erstellen Sie PDFs, Links oder Bildexporte Ihrer Diagramme und teilen Sie Projektpläne mit Kunden oder Teamkollegen.
- Farbkodierung: Nutzen Sie Farbschemata, um Aufgaben nach Team, Priorität oder Phase zu kategorisieren und das Diagramm übersichtlich zu halten.
- Kritischer Pfad: Markieren Sie die Aufgabenreihe, die unmittelbar das Projektendedatum beeinflusst, damit Sie den Fokus auf das Dringendste legen können.
KI-Funktionen, auf die Sie bei Gantt-Diagramm-Tools achten sollten
Viele Gantt-Tools bieten zudem KI-basierte Funktionen, die Zeit sparen und die Effizienz steigern:
- Automatisierte Zeitplanung: Sie können KI-Vorschläge für optimale Aufgabenreihenfolgen und Zeitpläne basierend auf Projektanforderungen, Fristen und Ressourcenverfügbarkeit erhalten.
- Prädiktive Analysen: Sie erhalten Prognosen über potenzielle Verzögerungen oder Risiken, indem historische Daten und aktuelle Projekttrends analysiert werden.
- Intelligente Ressourcenallokation: Sie bekommen KI-gestützte Empfehlungen für die Zuordnung von Teammitgliedern oder Ressourcen, um Arbeitslasten auszugleichen und Konflikte zu vermeiden.
- Natürliche Spracheingabe: Damit können Sie Ihr Projekt in einfachem Deutsch beschreiben und die KI generiert für Sie einen Entwurf des Gantt-Diagramms – ganz ohne manuelle Dateneingabe.
- Automatisierte Fortschritts-Updates: KI kann den Abschluss von Aufgaben verfolgen und Ihr Diagramm automatisch aktualisieren, indem sie mit anderen Projektmanagement-Tools integriert wird oder sogar Teamkommunikation auswertet.
- Intelligente Benachrichtigungen: Sie erhalten proaktive Erinnerungen und Warnungen zu bevorstehenden Fristen, potenziellen Hürden oder Terminänderungen.
- Szenarienplanung: Sie können mit KI „Was-wäre-wenn“-Szenarien modellieren und sehen, wie sich Änderungen beim Umfang, Ressourcen oder Fristen auf Ihren Zeitplan auswirken könnten.
- Priorisierung von Aufgaben: Sie erhalten Vorschläge, welche Aufgaben priorisiert werden sollten, basierend auf Abhängigkeiten, Fristen und Teamkapazitäten, sodass Ihr Projekt auf Kurs bleibt.
Obwohl diese Funktionen in dieser Software-Kategorie üblich sind, entwickeln sich Produkte ständig weiter. Daher sollten Sie die Update-Häufigkeit eines Produkts berücksichtigen. Wie Robyn Birkedal anmerkt:
Eine Sache, die man beachten sollte, ist, wie oft ein Tool aktualisiert wird. Neue Funktionen können toll sein, aber wenn man nicht Schritt hält, kann es überwältigend wirken, wenn sich die Benutzeroberfläche unerwartet ändert.
Vorteile von Gantt-Diagramm-Software
Hier sind fünf zentrale Vorteile von Gantt-Diagramm-Software:
- Vereinfachtes Projektmanagement: Gantt-Diagramm-Software bietet eine zentrale Plattform für die Verwaltung aller Projektaufgaben. Dieser konsolidierte Ansatz ermöglicht es Ihnen, den Überblick über den Fortschritt der Aufgaben, die Ressourcenzuteilung und Fristen zu behalten und eine bessere Projektauslieferung zu fördern.
- Verbesserte Teamzusammenarbeit: Teammitglieder können Updates teilen, Feedback geben und klare Kommunikation pflegen. Das stellt sicher, dass alle auf die Projektziele ausgerichtet bleiben und produktiv arbeiten können.
- Effiziente Ressourcenallokation: Mit Gantt-Diagramm-Software können Sie Ressourceneinsatz effektiv visualisieren und steuern. Durch die strategische Zuweisung der Ressourcen stellen Sie eine optimale Auslastung sicher, verbessern Projektergebnisse und vermeiden Überlastung.
- Erkennen und Minimieren von Projektrisiken: Erweiterte Analysen durch Gantt-Diagramm-Software helfen potenzielle Hindernisse frühzeitig zu erkennen und Risiken rechtzeitig zu managen. Sie können so Probleme proaktiv lösen und Projektverzögerungen minimieren.
- Bessere Entscheidungsfindung: Mit umfassenden Berichten und Auswertungen stellt Gantt-Diagramm-Software Ihnen und Ihren Stakeholdern die nötigen Daten bereit, um fundierte Entscheidungen zu treffen. Sie eliminieren so das Rätselraten und steuern Projekte evidenzbasiert in Richtung Erfolg.
Kosten & Preismodelle für Gantt-Diagramm-Software
Nachfolgend finden Sie eine Tabelle mit den verschiedenen Tarifoptionen und deren Preisen für Gantt-Diagramm-Software:
| Tarifname | Preis (pro Benutzer/Monat) | Funktionen |
|---|---|---|
| Free | $0 | Grundlegende Gantt-Diagramm-Funktionen, begrenzte Benutzer und Projekte |
| Basic | $5 - $10 | Gantt-Diagramm-Erstellung, Aufgabenabhängigkeiten, Basis-Berichte, begrenzte Benutzer und Projekte |
| Standard | $10 - $20 | Erweiterte Gantt-Funktionen, Aufgabenplanung, Ressourcenmanagement, mehrere Benutzer/Projekte |
| Premium | $20 - $50 | Fortschrittliche Projektplanung, anpassbare Gantt-Diagramme, Integrationen, unbegrenzte Benutzer/Projekte |
Typische Zeitpunkte, zu denen Ihr Unternehmen möglicherweise den Tarif wechseln möchte, sind:
- Zunahme der Projektkomplexität: Wenn Projekte komplexer werden, müssen Sie möglicherweise auf eine höhere Preiskategorie upgraden, um auf erweiterte Funktionen zugreifen zu können.
- Teamerweiterung: Wenn Ihr Team wächst, müssen Sie eventuell Ihre Preiskategorie anpassen, um mehr Benutzerlizenzen, bessere Kollaborationswerkzeuge und eine ausgefeiltere Rechteverwaltung zu ermöglichen.
- Integrationsbedarf: Wenn Sie Ihre Gantt-Diagramm-Software mit anderen Tools wie CRM-, ERP-Systemen oder Projektmanagement-Suiten integrieren müssen, bietet ein Upgrade auf eine höhere Preiskategorie erweiterte Integrationsmöglichkeiten.
- Daten- und Berichtswesen-Anforderungen: Sie müssen eventuell auf eine höhere Preiskategorie upgraden, wenn Sie erweiterte Berichtsfunktionen, Analysen und Möglichkeiten zur Datenvisualisierung benötigen.
- Kundensupport und Schulungen: Höhere Stufen des Kundensupports, Trainings und Onboardings werden mit dem Wachstum Ihres Unternehmens unerlässlich, da sie Ihnen helfen, das Tool effektiv zu nutzen und den Nutzen zu maximieren.
Gantt-Diagramm-Generator FAQs
Finden Sie Antworten auf häufig gestellte Fragen zu diesem Thema.
Was ist die beste kostenlose Gantt-Diagramm-Software?
Die beste kostenlose Gantt-Diagramm-Software hängt von Ihren konkreten Anwendungsfällen ab, aber zu den beliebtesten Optionen zählen Programme wie ClickUp, TeamGantt und GanttProject. Alle bieten eine kostenlose Stufe mit Kernfunktionen wie Aufgabenplanung und Zeitachsen-Darstellung.
ClickUp punktet durch flexible Projektansichten und unbegrenzte Nutzer. TeamGantt überzeugt durch eine intuitive Drag-and-Drop-Oberfläche, begrenzt Gratisnutzer aber auf ein Projekt gleichzeitig. GanttProject ist komplett kostenlos zum Download. Berücksichtigen Sie die Teamgröße und die Komplexität Ihrer Projekte, um die richtige Variante für Ihre Anforderungen auszuwählen.
Wie unterscheiden sich Gantt-Diagramme und Kanban-Boards im Aufgabenmanagement?
Gantt-Diagramme helfen Ihnen bei der Planung und Verfolgung von Projekten mit Zeitachsen, Abhängigkeiten und Meilensteinen. Sie sind ideal, um zu planen und zu visualisieren, wie Aufgaben sich überschneiden.
Kanban-Boards konzentrieren sich auf Arbeitsabläufe, nutzen Spalten, um den Aufgabenstatus anzuzeigen, und sind am besten geeignet für aufgabenorientiertes Arbeiten mit vielen Übergaben. Wenn Sie Deadlines und übergeordnete Abhängigkeiten im Blick behalten möchten, sind Gantt-Diagramme besser. Viele Projektmanager nutzen beide – Kanban für die tägliche Arbeit und ein Gantt-Diagramm für den Gesamtüberblick über das Projekt.
Was sind Best Practices für das Aktualisieren von Gantt-Diagrammen während eines Projekts?
Aktualisieren Sie Ihr Gantt-Diagramm regelmäßig (mindestens wöchentlich), um es aktuell zu halten und reale Änderungen abzubilden. Überprüfen Sie den Aufgabenstatus, passen Sie Fristen bei Verzögerungen an und informieren Sie Ihr Team über Anpassungen.
Nutzen Sie Farbmarkierungen oder Kommentare, um Änderungen und Erläuterungen hervorzuheben. Die meisten Tools ermöglichen automatisierte Aktualisierungen mit Benachrichtigungen. Konsistente Aktualisierungen helfen dabei, Engpässe frühzeitig zu erkennen, das Team auf dem gleichen Stand zu halten und böse Überraschungen kurz vor der Deadline zu vermeiden.
Was sind die Hauptunterschiede zwischen kostenlosen und kostenpflichtigen Gantt-Diagramm-Generators?
Kostenlose Gantt-Diagramm-Tools begrenzen meist die Nutzeranzahl, die Anzahl der Projekte, Integrationen oder fortgeschrittene Funktionen wie Berichte und Ressourcenmanagement. Bezahlt-Versionen bieten mehr Kollaborationsoptionen, Automatisierungen, benutzerdefinierte Felder und besseren Support.
Wenn Sie viele Projekte haben oder Funktionen wie Arbeitslastverfolgung und Integrationen benötigen, empfiehlt sich ein kostenpflichtiger Tarif. Starten Sie mit einem Gratisplan, um zu testen, ob das Tool zu Ihnen passt – bei wachsendem Team oder komplexeren Projekten ist meist ein Upgrade nötig.
Kann ich einen Gantt-Diagramm-Generator mit anderen Projektmanagement-Tools integrieren?
Ja, die meisten Gantt-Diagramm-Generatoren lassen sich mit anderen Projektmanagement-Tools wie Asana, Trello, Slack und Google Workspace integrieren. Über die Integrationen können Sie Aufgaben synchronisieren, Arbeitsabläufe automatisieren und doppelte sowie manuelle Aktualisierungen auf mehreren Plattformen reduzieren.
Prüfen Sie im App-Marktplatz oder in den Einstellungen, welche Integrationen unterstützt werden. Falls Ihr Team bereits ein zentrales PM-Tool nutzt, ist ggf. bereits Gantt-Funktionalität enthalten, alternativ können Sie auch darauf achten, dass sich das bevorzugte Tool direkt oder über Zapier anbinden lässt.
Wie kann ich die Ressourcenzuteilung mit Gantt-Diagramm-Software steuern?
Die meisten Gantt-Tools ermöglichen es, Aufgaben zuzuweisen, Arbeitslast zu überwachen und die Teamkapazitäten darzustellen. Ressourcen – zum Beispiel Teammitglieder oder Geräte – können direkt auf dem Zeitstrahl Aufgaben zugeordnet werden. Über Arbeitslast-Ansichten oder Ressourcen-Histogramme erkennen Sie überbuchte Mitarbeiter oder Leerzeiten. Prüfen Sie die Zuteilungen regelmäßig, damit Arbeitslasten ausgeglichen bleiben und Überlastungen bzw. Verzögerungen vermieden werden.
Worauf sollte ich achten, wenn ich einen Gantt-Diagramm-Generator für mein Team auswähle?
Achten Sie auf eine intuitive Bedienung, Kollaborationsfeatures, Integrationsmöglichkeiten und die Preisgestaltung. Wichtig sind Drag-and-Drop-Funktion, Abhängigkeitsmanagement und Exportoptionen.
Prüfen Sie, ob Zeiterfassung, Echtzeit-Aktualisierungen und Team-Messaging unterstützt werden. Suchen Sie nach einer Lösung, die zu Ihrer Projektgröße und der Erfahrung Ihres Teams mit Gantt-Diagrammen passt. Testen Sie am besten mit einer kostenlosen Version oder einem Probeabo, bevor Sie sich festlegen.
Gibt es Gantt-Diagramm-Tools, die agiles Projektmanagement unterstützen?
Ja, viele Gantt-Generatoren wie ClickUp, Smartsheet und Wrike bieten Funktionen zur Unterstützung agiler Methoden. Achten Sie auf Backlog-Management, Sprintplanung und flexible Zeitachsen. Manche Tools kombinieren Gantt-Zeitachsen mit agilen Boards, sodass Sie Sprints durchführen und gleichzeitig den Überblick über Fristen und Abhängigkeiten behalten. Dies hilft Ihnen, agile Arbeitsweisen mit strukturierter Zeitplanung zu vereinen.

Wie geht es weiter?
Möchtest du dich mit anderen digitalen Projektmanager:innen vernetzen, um Ressourcen und Best Practices auszutauschen? Tritt unserer Mitglieder-Community bei und erhalte Zugang zu über 100 Vorlagen, Beispielen und Mustern – und tausche dich im Slack mit Hunderten anderen digitalen Projektmanager:innen aus.