Los 10 Mejores Creadores de Diagramas de Gantt Para la Planificación de Proyectos en 2026

10 Mejores herramientas para crear diagramas de Gantt: Shortlist


Las mejores herramientas para crear diagramas de Gantt te permiten planificar y gestionar proyectos con una línea de tiempo visual clara que facilita el mapeo de tareas, la gestión de dependencias y el seguimiento de hitos. Sin un diagrama de Gantt, perderás plazos, tendrás dificultades para hacer un seguimiento preciso del avance y te toparás con malentendidos que retrasan la entrega y erosionan la responsabilidad.
He utilizado mis más de 15 años de experiencia en gestión de proyectos para probar a fondo y analizar más de 30 herramientas para crear diagramas de Gantt. He abordado las características clave y los casos de uso de cada herramienta para que puedas encontrar la opción adecuada que apoye los flujos de trabajo de tu equipo, te ayude a coordinar equipos interfuncionales, planificar lanzamientos de productos y manejar plazos superpuestos con control y claridad.
Puedes confiar en nuestras reseñas de herramientas para crear diagramas de Gantt
Hemos estado probando y analizando software para crear diagramas de Gantt desde 2012. Como gestores de proyectos, sabemos lo crucial y desafiante que es elegir el software adecuado.
Realizamos una investigación profunda para ayudar a nuestra audiencia a tomar mejores decisiones de compra. Hemos probado más de 2,000 herramientas para diferentes casos de uso de gestión de proyectos y escrito más de 1,000 reseñas de software completas. Descubre cómo mantenemos la transparencia y nuestra metodología para reseñas de herramientas de diagramas de Gantt.
Tabla comparativa de las mejores herramientas para crear diagramas de Gantt
Utiliza esta tabla para comparar las especificaciones de mis seleccionados de herramientas para crear diagramas de Gantt, lado a lado.
| Tool | Best For | Trial Info | Price | ||
|---|---|---|---|---|---|
| 1 | Mejor para vistas personalizadas de tareas | Plan gratuito + demo gratis disponible | Gratis para siempre con planes de pago desde $5/mes | Website | |
| 2 | Ideal para el seguimiento visual del progreso | 14 días de prueba gratuita | Desde $6/usuario/mes | Website | |
| 3 | Mejor para pizarras interactivas | Plan gratuito disponible | Desde $8/usuario/mes | Website | |
| 4 | Ideal para plantillas fáciles de usar | 30 días de prueba gratis | Desde $9.95/mes | Website | |
| 5 | Ideal para la colaboración en diseño | Plan gratuito disponible | Desde $3/usuario/mes (facturado anualmente) | Website | |
| 6 | Mejor para visualizar dependencias entre tareas | Plan gratuito disponible | Desde $10.99/usuario/mes (facturado anualmente) | Website | |
| 7 | Ideal para automatización de trabajo potenciada por IA | 14 días de prueba gratis | Desde $9.80/usuario/mes | Website | |
| 8 | Ideal para una planificación de proyectos detallada | Prueba gratuita | Desde $7/usuario/mes | Website | |
| 9 | Ideal para presentaciones basadas en datos | Prueba gratuita de 30 días | Desde $21/usuario/mes | Website | |
| 10 | Ideal por su interfaz fácil de usar | Plan gratuito disponible | Desde $18/usuario/mes | Website |


-

Celoxis
Visit WebsiteThis is an aggregated rating for this tool including ratings from Crozdesk users and ratings from other sites.4.4 -
Accelo
Visit WebsiteThis is an aggregated rating for this tool including ratings from Crozdesk users and ratings from other sites.4.4 -
Wrike
Visit WebsiteThis is an aggregated rating for this tool including ratings from Crozdesk users and ratings from other sites.4.3


Reseñas de los mejores creadores de diagramas de Gantt
Aquí tienes mi resumen de cada software de diagramas de Gantt de la lista:

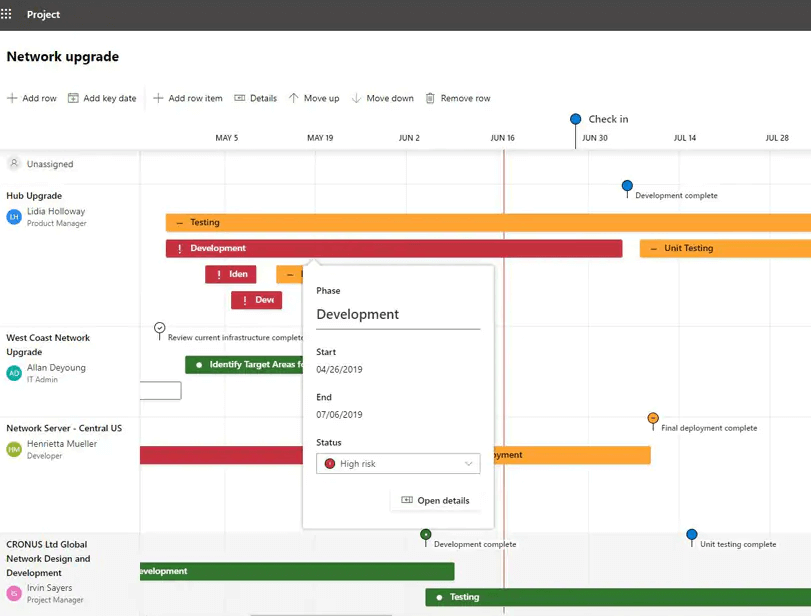
ClickUp es una solución integral de gestión de trabajo que ofrece un creador de diagramas de Gantt, además de otras funciones como pizarras, establecimiento de objetivos, gestión de documentos y mucho más.
Recientemente hablé con Jeff Cypher, un ex consultor de ClickUp que ahora trabaja para la empresa. Él habló sobre la flexibilidad de ClickUp en lo que respecta a los cambios en los proyectos. 'Recomiendo la vista de Gantt de ClickUp para los jefes de proyecto que necesitan ajustes dinámicos en sus proyectos', dice.
Por qué elegí ClickUp
Elegí ClickUp por sus vistas personalizables de tareas y los diagramas de Gantt. La interfaz de arrastrar y soltar de la plataforma permite ajustar fácilmente las tareas y dependencias, y ofrece claridad visual sobre los cronogramas de los proyectos y posibles obstáculos. Con funciones como ruta crítica y tiempo de holgura, puedes identificar y abordar rápidamente los retos de programación, lo que facilita mantener los proyectos encaminados. Esta personalización y flexibilidad hacen de ClickUp una opción ideal para los equipos que desean optimizar sus procesos de gestión de proyectos.
Funciones clave de ClickUp
ClickUp ofrece una variedad de otras funciones para crear diagramas de Gantt y gestionar proyectos.
- Hitos: Puedes seguir los logros más importantes del proyecto para asegurar que tu equipo cumpla los plazos clave.
- Seguimiento de tiempo: Esto te permite monitorear el tiempo dedicado a las tareas directamente desde la plataforma para gestionar mejor los recursos y los plazos.
- Prioridades de tareas: Puedes asignar niveles de prioridad a las tareas para ayudar a tu equipo a centrarse en lo más importante y mantener los proyectos avanzando sin problemas.
- Múltiples responsables: Esto te permite asignar tareas a varios miembros del equipo para fomentar la colaboración y mantener la responsabilidad en todos tus proyectos.
Integraciones de ClickUp
Las integraciones incluyen Slack, Google Workspace, Dropbox, Figma, Vimeo, Zoom, Box y Microsoft Teams. También puedes utilizar Zapier para integraciones adicionales, o crear integraciones personalizadas usando la API del software.
Pros and Cons
Pros:
- Usuarios ilimitados en el plan gratuito
- Más de 50 widgets para personalizar tu panel
- Almacenamiento de archivos ilimitado en todos los planes de pago
Cons:
- Los informes no están disponibles en el plan gratuito
- Almacenamiento, proyectos y campos personalizados limitados en el plan gratuito
New Product Updates from ClickUp

ClickUp Introduces Brain² Company AI
ClickUp has introduced Brain², a self-improving company AI that routes to the best models and can complete work such as websites, slides, and project management tasks. For more information, visit ClickUp's official site.
 .
.
monday.com es una plataforma de gestión de trabajo que ofrece una gran cantidad de funciones para la planificación de proyectos y el seguimiento de recursos, entre ellas los diagramas de Gantt.
Por qué elegí monday.com
Elegí monday.com porque te permite hacer un seguimiento visual del progreso mediante su función de diagrama de Gantt. Los diagramas de Gantt personalizables de la plataforma te permiten visualizar cronogramas, priorizar tareas y gestionar dependencias, además de proporcionar claridad y control sobre tus proyectos.
Sus paneles interactivos te permiten monitorear el progreso, los presupuestos y los plazos de un vistazo, y facilitan la toma de decisiones informadas. Estas características, combinadas con herramientas de comunicación en tiempo real, hacen de monday.com una excelente opción para los equipos que desean mejorar la visibilidad y coordinación en sus proyectos.
Funciones clave de monday.com
monday.com también ofrece una variedad de otras funciones para crear diagramas de Gantt y gestionar proyectos.
- Dependencias de tareas: Puedes visualizar y gestionar fácilmente las relaciones entre tareas, lo que previene cuellos de botella en el flujo de trabajo y permite mantener la ejecución fluida del proyecto.
- Seguimiento del progreso: Esto te permite monitorear la salud de tus proyectos en tiempo real con indicadores visuales que muestran hitos y porcentajes de finalización.
- Gestión de recursos: Esta función te permite centralizar los cronogramas y responsabilidades y facilita una asignación eficiente de recursos y coordinación entre equipos.
- Estructura de desglose del trabajo: Puedes dividir proyectos complejos en tareas manejables, lo que ayuda en la planificación y ejecución del proyecto.
Integraciones de monday.com
Las integraciones incluyen Dropbox, Excel, Google Calendar, Google Drive, Integromat, Slack, Trello y aún más a través de un plan de pago con Zapier.
Pros and Cons
Pros:
- Interfaz intuitiva y fácil de usar
- Plan gratuito para siempre disponible
- Plataforma completa de gestión de trabajo
Cons:
- Almacenamiento limitado en los planes básico y gratuito
- Los diagramas de Gantt no están incluidos en el plan básico ni en el gratuito
New Product Updates from monday AI Workspace

monday.com Adds Managed Columns Across Boards
monday.com adds Managed Column to let teams standardize and reuse column labels across multiple boards from a single source of truth. The update helps organizations maintain consistency, clarity, and centralized control at scale. For more information, visit monday.com’s official site.
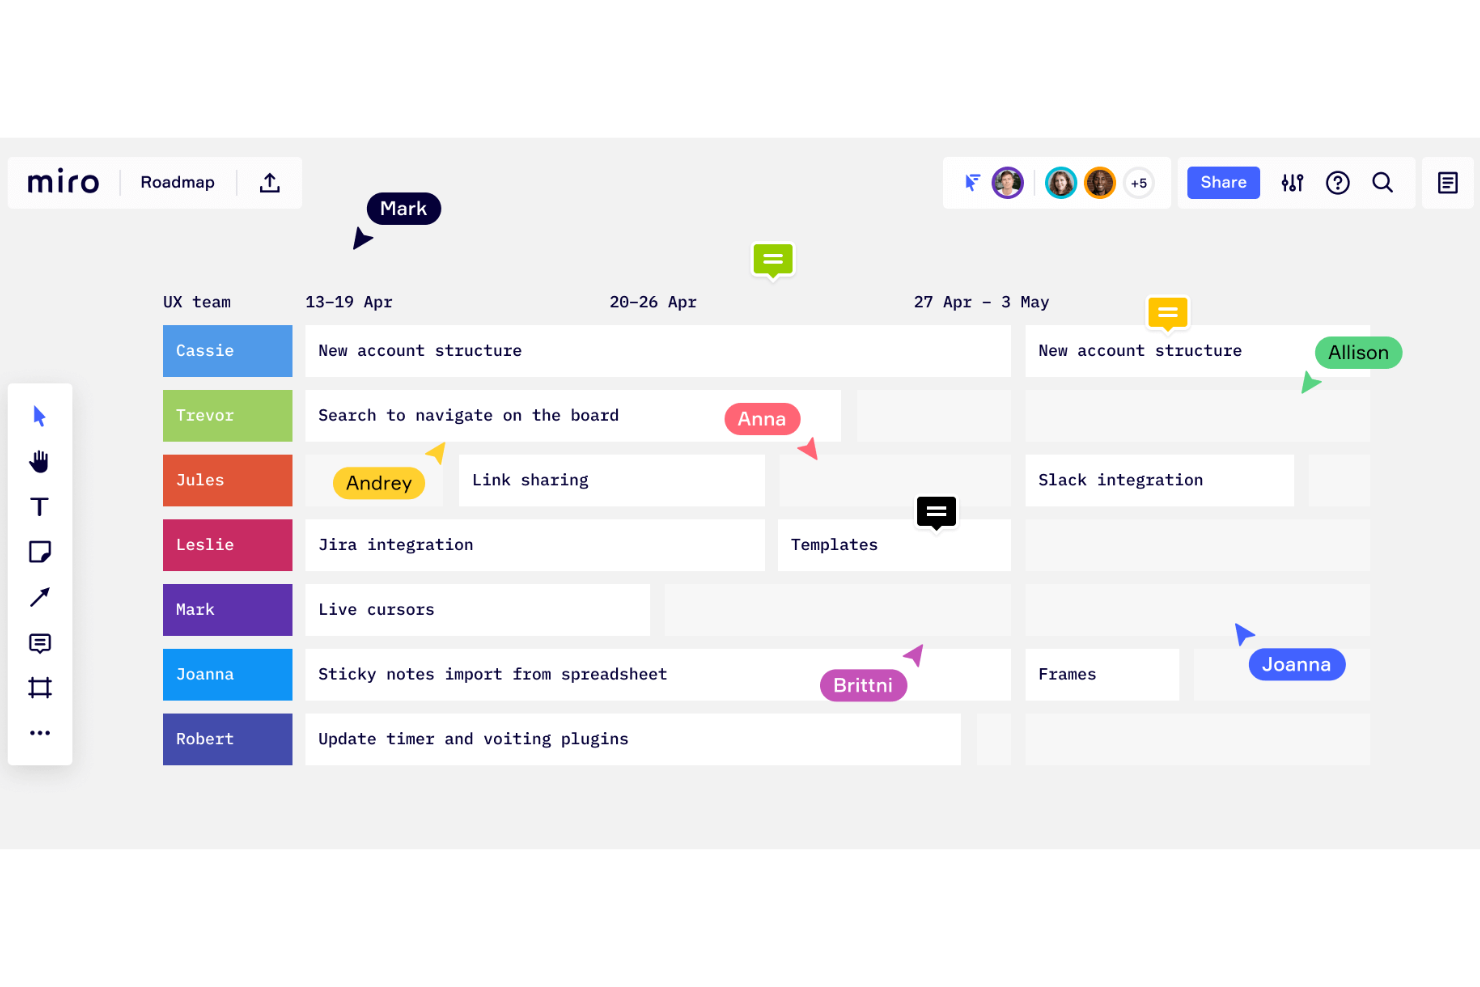
Miro es un pizarrón colaborativo en línea que ofrece más de 1.000 plantillas, incluidas mapas mentales, tableros Kanban, diagramas de Gantt, esquemas de productos, tableros de investigación y diagramas de flujo.
Por qué elegí Miro
Elegí Miro por su destacada capacidad como pizarrón interactivo, lo cual es perfecto para crear diagramas de Gantt. Lo que valoro es que Miro permite a tu equipo visualizar las líneas de tiempo del proyecto directamente en un lienzo colaborativo y facilita ajustar tareas y fechas límite en tiempo real. La funcionalidad de arrastrar y soltar hace que modificar tu diagrama de Gantt sea sencillo y mantiene la planificación de proyectos dinámica y receptiva.
Además, la capacidad de colaborar con los miembros del equipo en tiempo real significa que los aportes y actualizaciones se integran sin inconvenientes. Esto también mantiene a todos alineados sin el tedio del intercambio constante de comunicaciones.
Características clave de Miro
Miro también ofrece varias otras funciones que lo hacen útil para crear diagramas de Gantt y gestionar proyectos.
- Estimación de esfuerzo: Esta función permite considerar personas, tiempo y herramientas necesarias para las tareas y ayuda a identificar posibles riesgos desde las primeras etapas de la planificación.
- Hitos: Puedes establecer y celebrar hitos, lo que ayuda a mantener motivado a tu equipo y a asegurar que todos estén alineados con los objetivos del proyecto.
- Plantillas personalizables: Esto te permite comenzar con plantillas listas para usar o crear diagramas desde cero y añadir tareas, líneas de tiempo y codificación por colores para una mejor organización y claridad.
- Asistencia por IA: Las funciones de IA de Miro pueden estructurar automáticamente cronogramas y tareas en base a tus aportes, ahorrando tiempo y manteniendo la precisión.
Integraciones de Miro
Las integraciones incluyen Zoom, Figma, Asana, Microsoft Teams, Jira, Slack, Google Drive, Box, Confluence, monday.com, Airtable, Notion, Azure y Webex. Algunas integraciones solo están disponibles en planes de pago.
Pros and Cons
Pros:
- Configuración intuitiva y sencilla
- Plan gratuito para siempre disponible
- Funcionalidades de comunicación integradas
Cons:
- La función de zoom puede ser inestable en proyectos grandes
- Sin exportación de PDF de alta calidad en el plan gratuito
New Product Updates from Miro
Miro Adds Japan Data Residency for Enterprise Customers
Miro has introduced Japan data residency for enterprise customers, offering in-region storage for production data, backups, and metadata, plus in-region compute infrastructure. For more information, visit Miro's official site.
Canva es una plataforma de diseño en línea creada para ser fácil de usar, incluso para quienes no son expertos en diseño. Ofrece plantillas para todo tipo de cosas, desde diagramas de Gantt hasta presentaciones, infografías, recursos para redes sociales y mucho más.
Por Qué Elegí Canva
Soy un gran fanático de la interfaz simple y directa de este software, basada en arrastrar y soltar. Es fácil de usar, incluso para los menos expertos en tecnología. Elegí Canva para esta lista porque es intuitivo y cuenta con una enorme cantidad de plantillas listas para usar. Puedes elegir entre cientos de miles de plantillas disponibles y personalizarlas según tus necesidades. En mi opinión, el plan gratuito de Canva es una forma fantástica y rápida de crear un diagrama de Gantt listo para presentación, sin costo alguno. Además, podrás usar la plataforma para otras necesidades de diseño también.
Características Clave de Canva
Además de las plantillas, Canva ofrece una variedad de otras funciones útiles para la creación de diagramas de Gantt.
- Herramientas de personalización visual: Puedes ajustar fácilmente los colores, fuentes y estilos para que coincidan con tu marca y hacer que tus diagramas de Gantt sean funcionales y visualmente atractivos.
- Configuración de hitos: Esta función te permite marcar puntos importantes en la línea de tiempo de tu proyecto para ayudar a tu equipo a enfocarse en los entregables clave.
- Gestión de dependencias: Puedes conectar tareas para visualizar dependencias y asegurarte de que tu equipo comprenda la secuencia de las actividades del proyecto.
- Funciones de colaboración: Tú y tu equipo pueden editar y ver los cambios simultáneamente, lo que ayuda a mejorar la comunicación y el trabajo en equipo.
Integraciones de Canva
Las integraciones incluyen WordPress, eClincher, Rippling, Sendible, Post Planner y Viraltag.
Pros and Cons
Pros:
- Súper fácil de usar e intuitivo
- Cientos de miles de plantillas
- Producto presentable, no necesitas diseñador
Cons:
- Carece de funciones avanzadas para diagramas de Gantt
- Opciones de descarga limitadas con el plan gratuito

FigJam es una herramienta de pizarra en línea diseñada para facilitar la colaboración en tiempo real entre los miembros del equipo, proporcionando una plataforma dinámica para una variedad de actividades incluyendo lluvias de ideas, diagramación y planificación estratégica.
Por qué elegí FigJam
Elegí FigJam como creador de diagramas de Gantt debido a su capacidad para la colaboración en tiempo real, lo que es crucial para mantener actualizadas las líneas de tiempo de los proyectos y asegurar la alineación del equipo. Lo que diferencia a FigJam es su integración de funciones de IA que pueden generar plantillas personalizadas y automatizar tareas repetitivas, lo cual es especialmente útil al crear y actualizar diagramas de Gantt.
Creo que FigJam es la mejor opción para la colaboración en tiempo real de equipos de diseño porque no solo permite que los miembros trabajen juntos de manera síncrona con audio y chat en vivo, sino que también respalda la comunicación asincrónica mediante comentarios y reacciones, garantizando que todos los miembros del equipo, sin importar su ubicación o zona horaria, puedan contribuir al proceso de planificación del proyecto.
Características clave de FigJam
FigJam ofrece varias otras funciones que lo convierten en una opción destacada como software para diagramas de Gantt.
- Pizarra interactiva: Permite que tu equipo colabore en tiempo real, esboce ideas y planes de proyecto directamente en un lienzo digital y visualice líneas de tiempo complejas.
- Visualización de hitos: Puedes hacer seguimiento del progreso marcando fechas importantes y entregables dentro de la línea de tiempo y asegurándote de que todos estén alineados en los objetivos del proyecto.
- Herramientas de gestión de recursos: Permite asignar y hacer seguimiento de los recursos de manera efectiva (mediante plantillas), y mantener el equilibrio y la eficiencia a lo largo de las tareas del proyecto.
- Asignación y gestión de tareas: Puedes asignar tareas a los miembros del equipo directamente dentro del diagrama de Gantt, lo que facilita la gestión de los cronogramas y responsabilidades.
Integraciones de FigJam
Las integraciones incluyen Figma, Microsoft Teams, Asana, Jira, Mixpanel y GitHub.
Pros and Cons
Pros:
- Ofrece plantillas comunitarias para diversos usos
- Se integra con Figma para colaboración en diseño
- Interfaz fácil de usar e intuitiva
Cons:
- No hay acceso sin conexión disponible
- El soporte para incorporación y cuenta está limitado al plan empresarial

Asana es una herramienta de gestión de proyectos que ayuda a los equipos a planificar, organizar y hacer seguimiento del trabajo a lo largo del tiempo. Una de las principales formas en que lo hace es mediante su vista de cronograma (también llamada vista Gantt), que te permite ver las tareas distribuidas a lo largo de un calendario.
Por qué elegí Asana
Elegí Asana porque te da la capacidad de crear dependencias entre tareas directamente en la vista de cronograma. Esto significa que no solo asignas fechas a las tareas, sino que también puedes mostrar cuáles tareas bloquean a otras o dependen de otras. A medida que surgen cambios (las tareas se mueven, hay retrasos), puedes ver cómo una modificación afecta a las tareas dependientes.
Características clave de Asana
Además de la visualización de dependencias entre tareas, Asana ofrece una variedad de otras funciones para la gestión de proyectos.
- Vista de cronograma: Te permite crear un plan visual del proyecto y definir fechas límite y hitos clave para un mejor seguimiento.
- Priorización de tareas: Puedes priorizar fácilmente las tareas dentro de los proyectos y asegurar que tu equipo se concentre en lo más importante en cada momento.
- Plantillas de proyectos: Facilita la creación rápida de nuevos proyectos con estructuras y flujos de trabajo predefinidos.
- Herramientas de colaboración en equipo: Con funciones de comunicación integradas como comentarios y archivos adjuntos, tu equipo puede colaborar y compartir información directamente en las tareas.
Integraciones de Asana
Las integraciones incluyen Slack, Google Drive, Everhour, Microsoft Teams, Amazon Q Index, Splunk, Entra ID, Tableau, Jira Cloud, Microsoft Office 365, MuleSoft y BetterCloud.
Pros and Cons
Pros:
- Destaca el camino crítico para identificar bloqueos
- Permite crear dependencias entre tareas en la vista de cronograma
- Admite subtareas dentro de un cronograma de proyecto más amplio
Cons:
- Los cronogramas complejos pueden volverse visualmente saturados
- El acceso a la API de línea base está limitado o no disponible para algunos datos
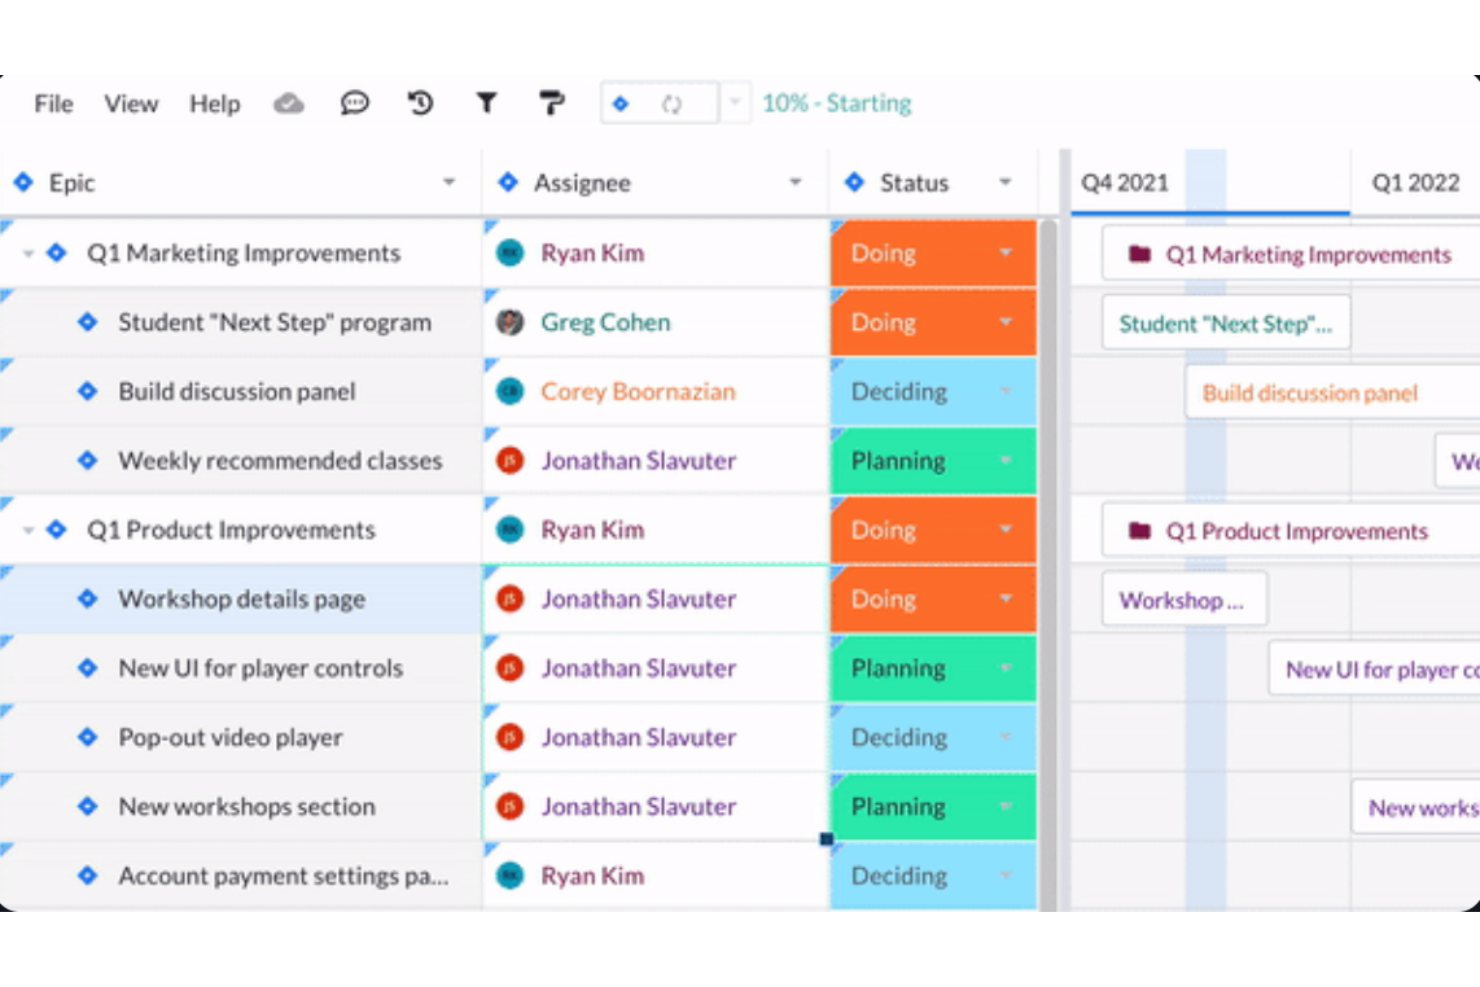
Wrike es una plataforma de gestión de proyectos basada en la nube que combina la programación mediante diagramas de Gantt, el seguimiento de tareas, la gestión de cargas de trabajo y la automatización potenciada por IA en proyectos y flujos de trabajo.
¿Para quién es mejor Wrike?
Wrike es ideal para equipos de tamaño mediano a empresarial que gestionan proyectos complejos con múltiples partes interesadas en áreas de producto, marketing y operaciones.
Por qué elegí Wrike
Elegí Wrike como uno de los mejores porque su automatización con IA va mucho más allá de simples sugerencias superficiales. Las capacidades de IA de Wrike pueden ayudar a resumir el trabajo, generar contenido y asistir en los flujos de trabajo de la gestión de proyectos. También me gusta Wrike Copilot, que está integrado en tus proyectos y responde preguntas sobre el estado de la cronología o el avance de los sprints en el momento. Específicamente para trabajar con diagramas de Gantt, esto significa menos tiempo persiguiendo actualizaciones y más tiempo gestionando dependencias reales e hitos importantes.
Características clave de Wrike
- Cronograma de Gantt interactivo: Arrastra y suelta tareas directamente en la línea de tiempo para reprogramar el trabajo y ajustar las dependencias en tiempo real.
- Vista de carga de trabajo: Consulta las tareas asignadas y la capacidad de cada miembro del equipo en todos los proyectos para detectar sobrecargas antes de que afecten la entrega.
- Tableros personalizados: Crea tableros específicos de proyectos que muestran el progreso de las tareas, elementos atrasados y el estado de los hitos de un vistazo.
- Plantillas de proyectos: Guarda y reutiliza estructuras de proyectos, incluidas cronologías y secuencias de tareas, como plantillas para flujos de trabajo repetibles.
Integraciones de Wrike
Wrike ofrece más de 400 integraciones mediante sus conectores integrados y el complemento Wrike Integrate, incluyendo herramientas como Salesforce, Microsoft Teams, Google Sheets, Slack, Adobe Creative Cloud, Jira, Power BI, Tableau, Miro y Zoom. También se conecta con Zapier y proporciona una API RESTful abierta para integraciones personalizadas.
Pros and Cons
Pros:
- Ruta crítica incorporada con análisis de holgura
- Importa archivos de proyecto .MPP, .MPX y .XML
- Las fechas de tareas dependientes se ajustan automáticamente ante cambios
Cons:
- La navegación entre espacios y vistas resulta confusa
- El control horario está limitado al plan Business y superiores
New Product Updates from Wrike

Wrike AI Agents Add Prebuilt Agents and Smarter People References
Wrike adds prebuilt AI Agents, dynamic role-based @mentions, and People custom field support. These updates help automate task assignments, notifications, and workflow actions without manual setup. For more information, visit Wrike's official site.
 .
.
Microsoft Project es un software de gestión de proyectos desarrollado y vendido por Microsoft. Está diseñado para ayudarte a planificar, realizar seguimiento y gestionar proyectos de distintos tamaños y complejidades a través de una variedad de funciones, incluido su creador de diagramas de Gantt.
Por qué elegí Microsoft Project
Elegí Microsoft Project por su planificación de proyectos detallada, lo que lo convierte en una excelente opción para crear diagramas de Gantt. Con funciones como la organización jerárquica de tareas y la vinculación de dependencias, puedes visualizar cronogramas de proyectos complejos con claridad.
La personalización de las barras de Gantt permite ofrecer señales visuales individualizadas y te ayuda a gestionar tareas de proyectos intrincados. Además, las herramientas integradas de asignación de recursos y gestión de presupuestos ayudan a mantener la planificación del proyecto alineada con las capacidades de tu equipo y las limitaciones financieras.
Funciones clave de Microsoft Project
Microsoft Project también ofrece una variedad de otras funciones que lo hacen útil como creador de diagramas de Gantt.
- Vista de cronograma: Esta te permite ver una visión general del calendario de tu proyecto y proporciona una instantánea de alto nivel que complementa la vista detallada del diagrama de Gantt.
- Seguimiento de hitos: Puedes establecer puntos específicos en el cronograma de tu proyecto para centrarte en logros clave y asegurarte de que tu equipo cumpla con plazos cruciales.
- Uso compartido de recursos: Esto te permite gestionar recursos entre varios proyectos y asignar miembros del equipo y equipos de manera eficiente.
- Priorización de tareas: Al asignar niveles de prioridad a las tareas, puedes abordar primero las actividades más críticas, optimizar tus flujos de trabajo y maximizar la productividad.
Integraciones de Microsoft Project
Las integraciones incluyen otros programas de Microsoft, como Outlook, Excel, Skype y más.
Pros and Cons
Pros:
- Módulo de priorización de estrategias/objetivos
- Descripciones útiles de plantillas de proyectos para orientación
- Integración con otros programas de Microsoft
Cons:
- Opciones de personalización limitadas
- Curva de aprendizaje pronunciada
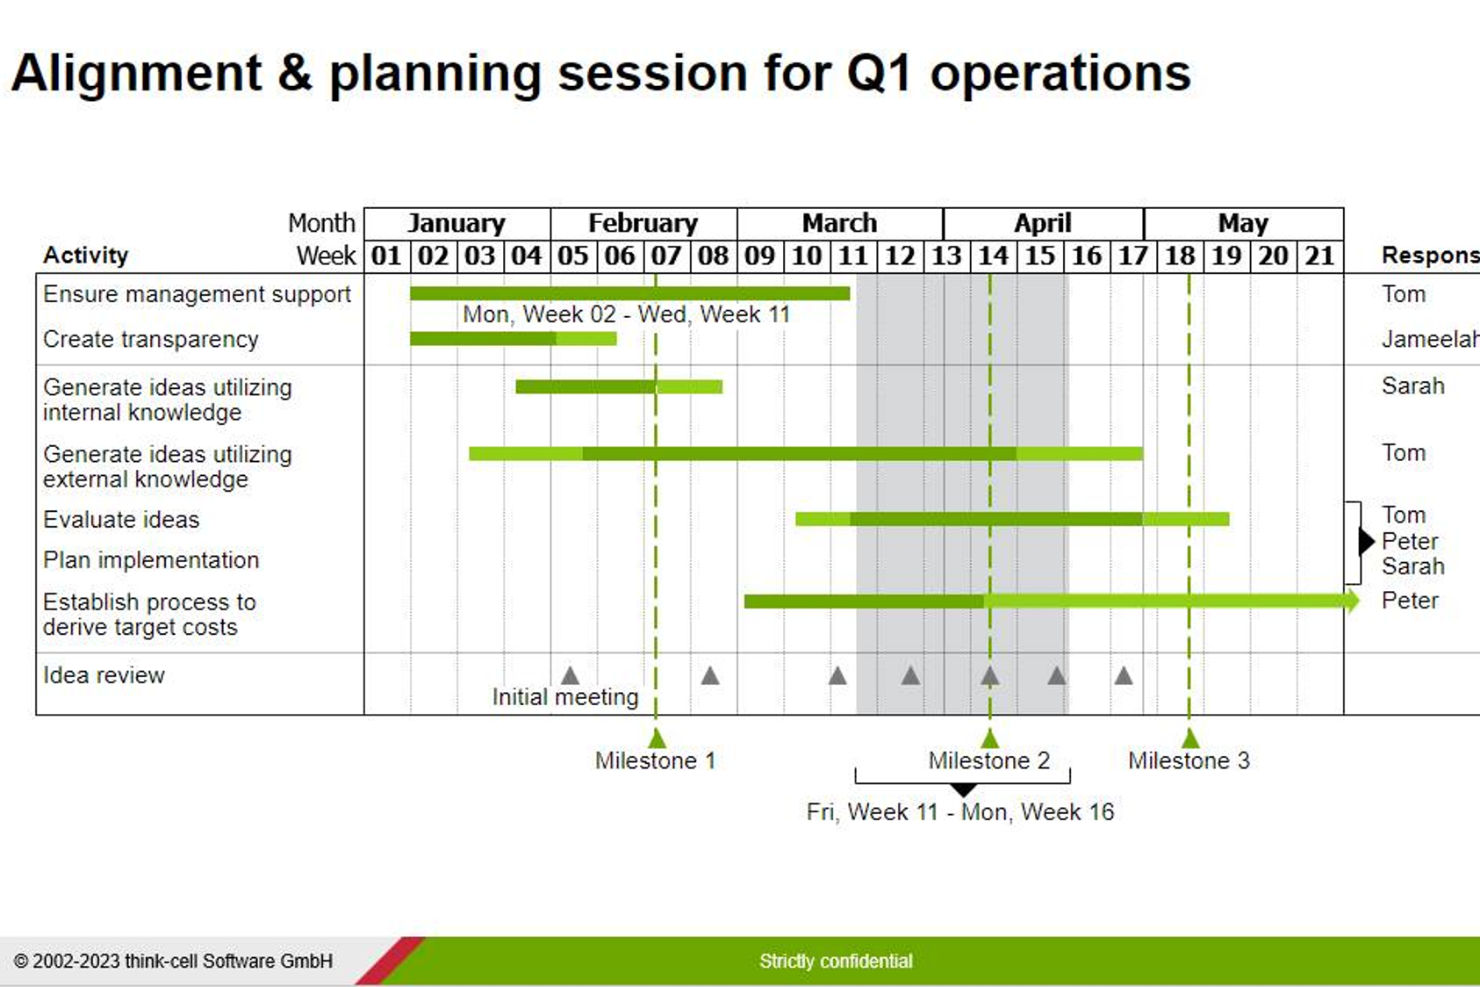
think-cell es un complemento de software para Microsoft PowerPoint y Excel que te ayuda a crear fácilmente varios tipos de gráficos para tus presentaciones a partes interesadas, incluyendo diagramas de Gantt.
Por qué elegí think-cell
Para los gerentes de proyectos que pasan más de 2 horas por semana preparando presentaciones en Excel o PowerPoint, creo que este software te ahorrará mucho tiempo y dolores de cabeza. Te permite crear diagramas de Gantt ajustables basados en calendarios directamente en PowerPoint, con capacidades de arrastrar y soltar para las líneas de tiempo, dependencias y hitos. También puedes vincular hojas de Excel a gráficos de PowerPoint para que cualquier actualización de datos se refleje automáticamente en tu diagrama de Gantt.
Características clave de think-cell
think-cell ofrece una variedad de características diseñadas para crear diagramas de Gantt efectivos.
- Ingreso interactivo de actividades: Esto te permite ingresar actividades directamente en el diagrama de Gantt para agilizar el proceso de construir la línea de tiempo de tu proyecto.
- Semanas laborales personalizables: Puedes definir la configuración de la semana laboral, como semanas de 5 o 7 días, para reflejar con precisión el horario de trabajo de tu equipo.
- Corchetes de duración temporal: Esto te permite agregar fácilmente corchetes para indicar la duración de tareas o fases específicas dentro de tu proyecto y proporciona señales visuales claras.
- Actualización automática de fechas: Cuando mueves tareas o hitos, las fechas se ajustan automáticamente, lo que garantiza que tu línea de tiempo permanezca precisa sin intervención manual.
Integraciones de think-cell
Las integraciones incluyen Microsoft PowerPoint y Microsoft Excel.
Pros and Cons
Pros:
- Potencia tus capacidades con productos de Microsoft
- Automatización para acelerar tareas repetitivas
- Fácil de usar, incluso para quienes no son expertos técnicos
Cons:
- Difícil trasladar los datos a un nuevo gráfico una vez creado uno
- Diseñado principalmente para Windows
Visor es una herramienta para crear diagramas de Gantt que ayuda a los usuarios a crear diagramas de Gantt y hojas de cálculo coloridas y gratuitas que se conectan con aplicaciones SaaS como Jira. Con Visor, los usuarios pueden visualizar los cronogramas de sus proyectos, planificar recursos, hacer seguimiento del progreso y gestionar dependencias.
Por qué elegí Visor
Elegí Visor por su interfaz fácil de usar, que en mi experiencia es especialmente útil para mantenerse organizado y al día al gestionar proyectos complejos. Su sincronización bidireccional con aplicaciones SaaS asegura que tus gráficos e informes se mantengan precisos sin trabajo manual y permite crear diagramas de Gantt usando la información de tu herramienta SaaS, incluso si los datos no están perfectamente limpios. Puedes hacer vistas para cada miembro de tu equipo sin tener que crear cuentas individuales para todos. También puedes arrastrar y soltar tareas para ajustar los plazos rápidamente.
Características clave de Visor
Visor también ofrece una variedad de otras funciones para gestionar proyectos y crear diagramas de Gantt.
- Vistas múltiples: Visor proporciona vistas de Gantt, tabla, Kanban y cronograma, para que tu equipo pueda gestionar proyectos desde distintas perspectivas y elegir la vista que mejor se adapte a su flujo de trabajo.
- Plantillas inteligentes con IA: Puedes aprovechar plantillas potenciadas por IA para generar rápidamente diagramas de Gantt adaptados a tus tareas específicas, lo que ahorra tiempo valioso y esfuerzo a tu equipo en la configuración de proyectos.
- Adición de hitos: Esto te permite añadir fácilmente hitos y codificarlos por colores para tareas y sub-tareas, lo que te ayuda a visualizar el avance del proyecto y priorizar entregables clave de manera efectiva.
- Campos personalizados: Puedes crear campos personalizados para registrar y etiquetar datos dentro de los diagramas de Gantt, lo que ofrece flexibilidad para captar y categorizar información según las necesidades únicas de tu proyecto.
Integraciones de Visor
Las integraciones incluyen Jira, Salesforce y Asana.
Pros and Cons
Pros:
- Permite flujos de trabajo entre múltiples aplicaciones
- Sincronización bidireccional que envía información a la fuente
- Interfaz colorida y amigable
Cons:
- Los créditos de sincronización son limitados
- Solo es un visor: necesita otra herramienta
Otros programas para crear diagramas de Gantt
Las herramientas anteriores no son los únicos creadores de diagramas de Gantt disponibles. Aquí tienes otros programas de Gantt que merecen una mención especial.
- MindView
Ideal para estructuras de desglose del trabajo
- TeamGantt
Ideal para rastrear rutas críticas en proyectos
- Gantter
La mejor para recomendaciones con IA
- GanttPRO
Ideal para la gestión de carga de trabajo en tiempo real
- Smartsheet
Ideal para la planificación entre departamentos
- Zoho Projects
Mejor para escalabilidad
- ProjectManager
Mejor para organizaciones empresariales
- Office Timeline
Ideal para la creación de cronogramas


Mira nuestro video sobre las mejores herramientas para crear diagramas de Gantt:

Otras reseñas relacionadas de gestión de proyectos
Si aún no has encontrado lo que buscas aquí, consulta estas otras reseñas de herramientas de gestión de proyectos que hemos seleccionado para ti:
- Herramientas de productividad
- Software de seguimiento de proyectos
- Software de programación de proyectos
- Software de gestión de proyectos
- Software de gestión de recursos
- Software de automatización de flujos de trabajo
- Software de gestión de proyectos con diagramas de Gantt
Criterios de selección para herramientas de diagramas de Gantt
Al seleccionar los mejores creadores de gráficos de Gantt para incluir en esta lista, tuve en cuenta las necesidades habituales de los compradores y sus puntos de dolor, como la capacidad de realizar un seguimiento fácil de los cronogramas de los proyectos y colaborar con los miembros del equipo. Utilicé el siguiente marco para mantener mi evaluación estructurada y justa:
Funcionalidad principal (25% de la puntuación total)
Para ser considerado e incluido en esta lista, cada solución debía cumplir estos casos de uso comunes:
- Crear y editar gráficos de Gantt
- Seguimiento del progreso del proyecto con hitos
- Asignar tareas a los miembros del equipo
- Visualizar dependencias entre tareas
- Exportar gráficos de Gantt en varios formatos
Funciones adicionales destacadas (25% de la puntuación total)
Para ayudar a reducir la competencia, también busqué funciones únicas, tales como:
- Integración con herramientas populares de gestión de proyectos
- Funciones de colaboración en tiempo real
- Plantillas personalizables para los gráficos de Gantt
- Herramientas avanzadas de gestión de recursos
- Recomendaciones de programación con inteligencia artificial
Usabilidad (10% de la puntuación total)
Para evaluar la facilidad de uso de cada sistema, busqué lo siguiente:
- Interfaz intuitiva de arrastrar y soltar
- Diseños de gráficos claros y visualmente atractivos
- Navegación sencilla entre proyectos
- Actualizaciones y cambios de tareas sencillos
- Baja latencia del sistema para proyectos grandes
Onboarding (10% de la puntuación total)
Para evaluar la experiencia de incorporación de cada plataforma, consideré si la herramienta ofrece:
- Acceso a recorridos interactivos por el producto
- Plantillas listas para usar para una configuración rápida
- Vídeos de capacitación y documentación completa
- Soporte por chat en vivo o chatbot durante la configuración
- Webinars o sesiones de demostración para nuevos usuarios
Soporte al cliente (10% de la puntuación total)
Para evaluar los servicios de atención al cliente de cada proveedor de software, consideré si el creador de gráficos de Gantt ofrece:
- Soporte al cliente disponible 24/7
- Base de conocimientos o preguntas frecuentes detalladas
- Métodos de contacto variados, como email, chat y teléfono
- Respuestas a consultas en un plazo razonable
- Contactos proactivos para la resolución de problemas
Relación calidad-precio (10% de la puntuación total)
Para evaluar la relación calidad-precio de cada plataforma, consideré si la herramienta cuenta con lo siguiente:
- Planes de precios flexibles para diferentes tamaños de equipos
- Pruebas gratuitas u opciones freemium
- Funciones avanzadas a un precio competitivo
- Todas las funciones necesarias en los niveles de precio base
- Cargos ocultos o costes sorpresa
Opiniones de los clientes (10% de la puntuación total)
Para entender la satisfacción general de los clientes, consideré si las opiniones de usuarios cubrían lo siguiente:
- Facilidad de uso y usabilidad
- Confiabilidad y rendimiento (uptime)
- Satisfacción con el soporte al cliente
- Percepción de la relación calidad-precio
- Efectividad global en la gestión de proyectos
Cómo elegir un software para crear gráficos de Gantt
Es fácil perderse en listas interminables de funciones y estructuras de precios complejas. Para ayudarte a mantener el enfoque, aquí tienes una lista de factores que debes tener en cuenta:
| Factor | Qué considerar |
|---|---|
| Escalabilidad | Asegúrate de que la herramienta pueda gestionar tu equipo en crecimiento y proyectos cada vez más complejos sin ralentizarse. |
| Integraciones | Verifica si el software se conecta con las herramientas que ya utilizas, como software de gestión de proyectos, CRMs o almacenamiento en la nube. |
| Personalización | Busca opciones para adaptar los diagramas de Gantt con campos personalizados, colores o diseños que se ajusten al flujo de trabajo de tu equipo. |
| Facilidad de uso | Asegúrate de que la interfaz sea intuitiva para que tu equipo pueda empezar a utilizarla rápidamente sin necesidad de formación extensa. |
| Presupuesto | Compara los planes de precios y asegúrate de que las funciones que necesitas estén incluidas sin requerir complementos costosos. |
| Salvaguardas de seguridad | Comprueba que la plataforma cuenta con sólidas medidas de protección de datos como cifrado y controles de acceso de usuarios para mantener tus proyectos seguros. |
| Colaboración | Confirma que soporte la colaboración en equipo con funciones como comentarios en tareas, actualizaciones en tiempo real y compartición de archivos. |
| Herramientas de reporte | Verifica si ofrece informes claros y accionables que te ayuden a seguir el progreso y tomar decisiones basadas en datos. |
Tendencias en creadores de diagramas de Gantt
Aquí tienes un adelanto de algunas tendencias que anticipamos seguirán desarrollándose este año en los creadores de diagramas de Gantt:
- Mejores interfaces visuales: Programas como Smartsheet y ClickUp han llevado a cabo importantes mejoras de interfaz para que la visualización de proyectos sea más intuitiva, colorida e interactiva.
- Integración de inteligencia artificial: Herramientas como Hive y Height ofrecen funciones de IA capaces de automatizar tareas que consumen mucho tiempo y proporcionar conocimientos predictivos. Esto es especialmente útil para la asignación de recursos y la identificación de riesgos, y puede ayudarte a reducir la carga de trabajo.
- Complementos para colaboración en tiempo real: Con la disminución del software especializado, más herramientas ofrecen complementos e integraciones que permiten a los usuarios discutir, compartir archivos y tomar decisiones sin salir de la plataforma.
¿Qué es un creador de diagramas de Gantt?
Un creador de diagramas de Gantt es una herramienta de gestión de proyectos para crear diagramas de Gantt—cronogramas visuales de proyectos—y utilizarlos para hacer seguimiento del progreso. Puedes usar software de diagramas de Gantt para organizar tareas, duraciones, fechas de inicio y fin, dependencias, la ruta crítica y los recursos.
Los programas de diagramas de Gantt también suelen incluir funciones para la asignación de tareas y distribución de recursos, pueden ayudar a simplificar la planificación de proyectos y permiten claridad y alineación tanto en el plan como en el avance del proyecto.
Funciones del software creador de diagramas de Gantt
Al elegir un creador de diagramas de Gantt, presta atención a las siguientes características clave:
- Dependencias entre tareas: Puedes vincular fácilmente tareas y visualizar cuáles deben completarse primero. Esto te permite detectar cuellos de botella y mantener los proyectos en movimiento.
- Interfaz de arrastrar y soltar: Esto te permite hacer clic y mover tareas directamente en la línea de tiempo, haciendo que actualizar los horarios sea rápido e intuitivo.
- Seguimiento de hitos: Puedes establecer y visualizar los principales hitos del proyecto, para que todos sepan cómo avanza el trabajo.
- Asignación de recursos: Esto te permite asignar miembros del equipo o recursos a tareas específicas, evitar la sobrecarga de trabajo y mantener a todos sincronizados.
- Personalización de zoom y línea de tiempo: Puedes ajustar la vista desde horas hasta meses para centrarte en los detalles o ver el panorama general según sea necesario.
- Seguimiento del progreso: Así puedes monitorizar el porcentaje completado de cada tarea, teniendo siempre una visión clara del estado de las cosas.
- Herramientas de colaboración: Puedes invitar colegas, dejar comentarios o compartir actualizaciones del proyecto para facilitar el trabajo en equipo y la comunicación fluida.
- Opciones de exportación y compartición: Esto te permite crear archivos PDF, enlaces o exportar imágenes de tus diagramas y compartir planes de proyectos con clientes o compañeros.
- Códigos de colores: Puedes utilizar esquemas de colores para categorizar tareas por equipo, prioridad o fase y mantener organizado tu diagrama.
- Resaltado de la ruta crítica: Esto te ayuda a identificar la serie de tareas que impactan directamente en la fecha de finalización de tu proyecto, para que puedas enfocarte en lo más urgente.
Funciones de IA que debes buscar en un creador de diagramas de Gantt
Muchos creadores de diagramas de Gantt también incluyen funciones impulsadas por inteligencia artificial para ahorrarte tiempo y aumentar la eficiencia:
- Programación automatizada: Puedes dejar que la IA sugiera secuencias de tareas y cronogramas óptimos según los requisitos del proyecto, los plazos y la disponibilidad de recursos.
- Análisis predictivo: Obtendrás pronósticos sobre posibles retrasos o riesgos al analizar datos históricos y tendencias actuales del proyecto.
- Asignación inteligente de recursos: Puedes recibir recomendaciones impulsadas por IA para asignar miembros del equipo o recursos y así mantener cargas de trabajo equilibradas y evitar conflictos.
- Entrada en lenguaje natural: Esto te permite describir tu proyecto en lenguaje sencillo y la IA generará un borrador de diagrama de Gantt sin la necesidad de ingresar datos manualmente.
- Actualizaciones automáticas del progreso: La IA puede rastrear la finalización de tareas y actualizar tu diagrama automáticamente al integrarse con otras herramientas de gestión de proyectos o incluso analizando las comunicaciones del equipo.
- Notificaciones inteligentes: Recibirás recordatorios y alertas proactivas sobre próximos plazos, posibles obstáculos o cambios en el cronograma.
- Planificación de escenarios: Puedes usar la IA para modelar escenarios hipotéticos y ver cómo los cambios en el alcance, los recursos o los plazos pueden afectar tu cronograma.
- Priorización de tareas: Recibirás sugerencias sobre qué tareas priorizar según dependencias, plazos y capacidad del equipo, para mantener tu proyecto en marcha.
Aunque estas características son comunes en esta categoría de software, los productos están en constante cambio. Por lo tanto, considera la frecuencia con la que el producto se actualiza. Como señala Robyn Birkedal:
Algo a tener en cuenta es la frecuencia con la que una herramienta se actualiza. Las nuevas funciones pueden ser excelentes, pero si no te mantienes al día, puede resultar abrumador cuando la interfaz cambia de forma inesperada.
Beneficios del software para crear diagramas de Gantt
Aquí tienes cinco beneficios principales del software para crear diagramas de Gantt:
- Gestión de proyectos simplificada: El software de diagramas de Gantt proporciona una plataforma centralizada para gestionar todas las tareas del proyecto. Este enfoque consolidado te permite mantener el control del progreso de las tareas, la asignación de recursos y los plazos, además de mejorar la entrega de proyectos.
- Colaboración mejorada en el equipo: Los miembros del equipo pueden compartir actualizaciones, ofrecer retroalimentación y mantener una comunicación clara. Esto asegura que todos estén alineados con los objetivos del proyecto y puedan mantenerse productivos.
- Asignación eficiente de recursos: El software de diagramas de Gantt te permite visualizar y gestionar la distribución de los recursos de manera eficaz. Al asignar los recursos estratégicamente, puedes asegurar la utilización óptima, mejorar los resultados del proyecto y evitar la sobrecarga de recursos.
- Identificar y mitigar riesgos en el proyecto: Los análisis avanzados que proporciona el software de diagramas de Gantt te permiten detectar posibles obstáculos y gestionar riesgos a tiempo. Esto te permite resolver problemas de forma proactiva y minimizar los retrasos en el proyecto.
- Mejora en la toma de decisiones: Con informes completos y análisis detallados, el software de diagramas de Gantt te equipa a ti y a tus partes interesadas con los datos necesarios para tomar decisiones informadas. Eliminarás la incertidumbre y ayudarás a que los proyectos avancen con éxito sobre la base de evidencia sólida.
Costos y precios de los creadores de diagramas de Gantt
A continuación, se muestra una tabla que detalla las diferentes opciones de planes y sus precios para software de diagramas de Gantt:
| Nombre del plan | Precio (por usuario/mes) | Funciones |
|---|---|---|
| Gratuito | $0 | Funcionalidad básica de diagramas de Gantt, usuarios y proyectos limitados |
| Básico | $5 - $10 | Creación de diagramas de Gantt, dependencias de tareas, informes básicos, usuarios y proyectos limitados |
| Estándar | $10 - $20 | Funciones avanzadas de diagramas de Gantt, programación de tareas, gestión de recursos, múltiples usuarios/proyectos |
| Premium | $20 - $50 | Programación avanzada de proyectos, diagramas de Gantt personalizables, integraciones, usuarios/proyectos ilimitados |
Algunas etapas comunes en las que tu empresa puede querer actualizar su plan de precios incluyen:
- Incremento de la complejidad del proyecto: Cuando los proyectos se vuelven más complejos, es posible que debas actualizar a un nivel de precios superior para acceder a funciones avanzadas.
- Expansión del equipo: A medida que tu equipo crece, podrías necesitar aumentar el nivel de precios para acomodar más licencias de usuario, mejores herramientas de colaboración y una gestión de permisos más sofisticada.
- Necesidades de integración: Cuando necesitas integrar tu software de diagramas de Gantt con otras herramientas como CRM, ERP o suites de gestión de proyectos, subir a un nivel de precios superior puede proporcionar capacidades de integración avanzadas.
- Requisitos de datos e informes: Es posible que debas actualizar tu nivel de precios si necesitas reportes avanzados, análisis y funciones de visualización de datos.
- Atención al cliente y formación: Niveles más altos de atención al cliente, capacitación e incorporación se vuelven esenciales a medida que tu empresa crece, ya que te ayudarán a utilizar la herramienta eficazmente y a maximizar sus beneficios.
Preguntas frecuentes sobre creadores de diagramas de Gantt
Encuentra respuestas a preguntas comunes sobre este tema.
¿Cuál es el mejor software gratuito para crear diagramas de Gantt?
El mejor software gratuito para crear diagramas de Gantt depende de tus casos de uso específicos, pero algunas de las opciones más populares incluyen herramientas como ClickUp, TeamGantt y GanttProject. Cada uno ofrece un plan gratuito con funciones básicas como la programación de tareas y la visualización de líneas de tiempo.
ClickUp se destaca por sus vistas de proyecto flexibles y usuarios ilimitados. TeamGantt cuenta con una interfaz intuitiva de arrastrar y soltar, pero limita a los usuarios gratis a un solo proyecto a la vez. GanttProject es completamente gratuito para descargar. Considerar el tamaño de tu equipo y la complejidad de tus proyectos te ayudará a elegir la mejor opción gratuita para tus necesidades.
¿Cómo se comparan los diagramas de Gantt con los tableros Kanban para la gestión de tareas?
Los diagramas de Gantt te ayudan a planificar y hacer seguimiento de proyectos con líneas de tiempo, dependencias y hitos. Son ideales para programar y visualizar cómo se superponen las tareas.
Los tableros Kanban se centran en los flujos de trabajo y utilizan columnas para mostrar el estado de las tareas, siendo mejores para trabajos centrados en tareas que implican muchos traspasos. Si necesitas ver fechas límite y dependencias generales, los diagramas de Gantt son mejores. Muchos gestores de proyectos usan ambos: Kanban para el trabajo diario y un diagrama de Gantt para una visión general de todo el proyecto.
¿Cuáles son las mejores prácticas para actualizar diagramas de Gantt durante un proyecto?
Actualiza tu diagrama de Gantt regularmente (al menos una vez por semana) para mantenerlo preciso y asegurarte de que refleje los cambios reales. Revisa el estado de las tareas, ajusta los plazos ante retrasos y comunica las actualizaciones a tu equipo.
Utiliza colores o comentarios para resaltar cambios y aclaraciones. La mayoría de las herramientas admiten actualizaciones automáticas con notificaciones. Las actualizaciones constantes te ayudan a identificar cuellos de botella, mantener a tu equipo alineado y evitar sorpresas cerca de las fechas límite.
¿Cuáles son las principales diferencias entre los creadores de diagramas de Gantt gratuitos y de pago?
Las herramientas gratuitas para diagramas de Gantt suelen limitar la cantidad de usuarios, el número de proyectos que puedes ejecutar, las integraciones o características avanzadas como informes y gestión de recursos. Las herramientas de pago ofrecen más opciones de colaboración, automatizaciones, campos personalizados y mejor soporte.
Si gestionas muchos proyectos o necesitas funciones como seguimiento de cargas de trabajo e integraciones, elige un plan de pago. Comenzar con un plan gratuito es una buena forma de evaluar si una herramienta se adapta a tus necesidades, pero tendrás que actualizar cuando crezcan tu equipo y la complejidad del proyecto.
¿Puedo integrar un creador de diagramas de Gantt con otras herramientas de gestión de proyectos?
Sí, la mayoría de los creadores de diagramas de Gantt se integran con otras herramientas de gestión de proyectos como Asana, Trello, Slack y Google Workspace. Las integraciones te ayudan a sincronizar tareas, automatizar flujos de trabajo y reducir las actualizaciones manuales y duplicadas en varias plataformas.
Revisa el marketplace de aplicaciones o ajustes del software para ver las opciones de integración. Si tu equipo ya usa una herramienta principal de gestión de proyectos, es posible que ya tenga funcionalidad de Gantt, pero también puedes buscar software de diagramas de Gantt que se conecte nativamente o por medio de Zapier.
¿Cómo puedo gestionar la asignación de recursos usando un software de diagramas de Gantt?
La mayoría de las herramientas de diagramas de Gantt te permiten asignar tareas, hacer seguimiento de cargas de trabajo y visualizar la capacidad del equipo. Asigna recursos—como miembros del equipo o equipos—a las tareas directamente en la línea de tiempo. Puedes usar funciones como vistas de carga de trabajo o histogramas de recursos para detectar miembros sobrecargados o tiempos muertos. Revisa periódicamente las asignaciones para mantener el equilibrio y prevenir sobrecargas o retrasos.
¿Qué debo buscar al elegir un creador de diagramas de Gantt para mi equipo?
Enfócate en un diseño intuitivo, funciones de colaboración, opciones de integración y precios. Asegúrate de que la herramienta ofrezca funciones de arrastrar y soltar, seguimiento de dependencias y opciones de exportación.
Revisa si admite seguimiento de tiempo, actualizaciones en tiempo real y mensajería para el equipo. Elige una solución que se ajuste al tamaño de tu proyecto y a la experiencia de tu equipo con diagramas de Gantt. Siempre puedes solicitar una prueba gratuita o usar versiones freemium antes de comprometerte.
¿Existen herramientas de diagramas de Gantt que apoyen la gestión ágil de proyectos?
Sí, muchos creadores de diagramas de Gantt, como ClickUp, Smartsheet y Wrike, ofrecen funciones que apoyan los métodos ágiles. Busca gestión de backlog, planificación de sprints y flexibilidad en la línea de tiempo. Algunas herramientas combinan diagramas de Gantt con tableros ágiles, así puedes ejecutar sprints mientras haces seguimiento de líneas de tiempo generales y dependencias. Esto te ayuda a combinar flujos ágiles con una programación estructurada.

¿Qué sigue?
¿Quieres conectar con otros gestores de proyectos digitales para compartir recursos y mejores prácticas? Únete a nuestra comunidad de miembros y obtén acceso a más de 100 plantillas, ejemplos y muestras, y conecta con cientos de otros gestores de proyectos digitales en Slack.