10 Best Drag-and-Drop Report Builders of 2026

Best Drag-and-Drop Report Builders Shortlist


Choosing the right drag-and-drop report builder can be a challenge. You want to create reports quickly and efficiently, but with so many options on the market, the solutions may seem endless.
To help teams get started in their search, I used my experience in project management to test and compare several of the top drag-and-drop report builders available. From there, I compiled my insights into in-depth reviews, listing the pros, cons, features, and integrations of each option.
Whether you’re a small business or a large enterprise, I’m confident that you’ll find your next software in the list below.
Why Trust Our Software Reviews
We’ve been testing and reviewing project management software since 2012. As SaaS researchers, we know how critical and challenging it is to decide when selecting software.
We invest in deep research to help our audience make better software purchasing decisions. We’ve tested over 2,000 tools for different project management use cases and written over 1,000 comprehensive software reviews. Learn how we stay transparent and our software review methodology.
Best Drag-and-Drop Report Builders Summary
| Tool | Best For | Trial Info | Price | ||
|---|---|---|---|---|---|
| 1 | Best for digital marketers needing preset report templates | 14-day free trial + free demo available | From $44/month (billed annually) | Website | |
| 2 | Best for marketing agencies | 14-day free trial + free demo available | From $20/client/month (billed annually) | Website | |
| 3 | Best for no-code data science and analytics | Free plan available | From $19/month | Website | |
| 4 | Best for cross-channel marketing data integration | Free plan available | From $229/month (billed annually) | Website | |
| 5 | Best for AI-driven customer data unification | Free demo available | Pricing upon request | Website | |
| 6 | Best for enterprise-scale data visualization | Free plan available | From £10.80/user/month (billed annually) | Website | |
| 7 | Best for real-time 3D project management | 30-day free trial | From $185/month (billed annually) + free plan available | Website | |
| 8 | Best for financial advisors needing real-time portfolio monitoring | 7-day free trial | Pricing upon request | Website | |
| 9 | Best for self-service business intelligence | Free plan available | From $90/month (billed annually) | Website | |
| 10 | Best for developers needing customizable report builders | Free plan available | From $40/month (billed annually) | Website |
-

Celoxis
Visit WebsiteThis is an aggregated rating for this tool including ratings from Crozdesk users and ratings from other sites.4.4 -
Smartsheet
Visit WebsiteThis is an aggregated rating for this tool including ratings from Crozdesk users and ratings from other sites.4.5 -
Accelo
Visit WebsiteThis is an aggregated rating for this tool including ratings from Crozdesk users and ratings from other sites.4.4


Best Drag-and-Drop Report Builders Reviews
This in-depth analysis provides overviews of each drag-and-drop report builder, discussing each tool’s pros and cons, features, and best use cases.

DashThis is a drag-and-drop report builder designed for digital marketers. It offers preset report templates to streamline the reporting process.
Why I picked DashThis: DashThis provides users with a user-friendly interface and extensive preset templates, which make it ideal for digital marketers who need to create reports quickly and efficiently. Unlike other tools, DashThis stands out with its focus on digital marketing metrics and seamless integration with various data sources, making it a top choice for marketers.
Standout features & integrations:
Features include an intuitive drag-and-drop interface, preset report templates, the ability to track high-level metrics or drill down into detailed data, and automatic email sharing of PDF reports.
Integrations include Google Analytics, TikTok Ads, HubSpot, Klaviyo, Facebook Insights, Google Ads, Facebook Ads, Instagram, LinkedIn Pages, and YouTube.
Pros and Cons
Pros:
- Automatic email sharing
- Extensive preset templates
- Easy to use
Cons:
- Occasional lag in data updates
- Limited customization options
New Product Updates from DashThis

DashThis Launches Shopify Integration in Beta
DashThis’s Shopify integration is now available to all users in beta, adding Shopify metrics, dimensions, and preset widgets to report on ecommerce performance alongside other marketing channels. For more information, visit DashThis's official site.
 .
.
AgencyAnalytics is a platform designed for marketing agencies to automate client reporting. It offers customizable dashboards, white-label branding, and over 80 integrations for various marketing tools.
Why I picked AgencyAnalytics: AgencyAnalytics offers advanced features tailored specifically for marketing agencies. The platform stands out due to its ease of use, extensive customization options, and strong integration capabilities. Using AI and automated processes, AgencyAnalytics helps teams significantly reduce the time spent on manual reporting, allowing agencies to focus more on their core activities.
Standout features & integrations:
Features include customizable dashboards, white-label branding, and a drag-and-drop report builder.
Integrations include Google Analytics 4, Google Ads, Facebook, Instagram, Shopify, LinkedIn, Mailchimp, HubSpot, SEMrush, and CallRail.
Pros and Cons
Pros:
- Over 80 integrations
- White label branding
- Customizable dashboards
Cons:
- Occasional delays in data updates
- Limited to marketing agencies

KNIME is a platform for data science that offers a drag-and-drop report builder, allowing users to analyze, upskill, and scale without requiring coding. It provides extensive features for data access, blending, transformation, and visualization, all without users needing coding knowledge.
Why I picked KNIME: KNIME stands out as an advanced, no-code data science platform that is both free and open-source. Its extensive range of connectors and integrations and ease of use make it ideal for users who need powerful analytics without coding. Along with these features, KNIME also provides the ability to handle complex data tasks and a supportive community for continuous learning and upskilling.
Standout features & integrations:
Features include access to over 300 data connectors, blending and transforming data from any source, a wide range of analytic techniques, automating repetitive tasks, creating visualizations, and extending the platform's capabilities through coding.
Integrations include Python, R, JavaScript, TensorFlow, H2O.ai, Apache Spark, Amazon S3, Google BigQuery, Microsoft Azure, and Snowflake.
Pros and Cons
Pros:
- Free and open-source
- No coding required
- Extensive data connectors
Cons:
- Limited real-time capabilities
- Strong community support

Whatagraph is a marketing performance monitoring and reporting platform that integrates cross-channel marketing data. It consolidates data from multiple sources into one platform, making it easier to create advanced reports and dashboards.
Why I picked Whatagraph: Whatagraph is known for its strong ability to integrate data from various marketing channels, which is important for next-level reporting. The software stands out due to its intuitive drag-and-drop interface and pre-built widgets, making it user-friendly for agencies and in-house teams. Additionally, its capability to save time on manual tasks and provide clear insights into marketing performance makes it the best for cross-channel marketing data integration.
Standout features & integrations:
Features include custom metrics creation, automated reporting, and intuitive drag-and-drop visualization tools.
Integrations include Google Analytics 4, Facebook Ads, LinkedIn Ads, Mailchimp, HubSpot, Google Ads, Instagram, TikTok Ads, CallRail, and BigQuery.
Pros and Cons
Pros:
- User-friendly interface
- Automated reporting
- Easy data integration
Cons:
- Some integrations can be unreliable
- Limited customization options
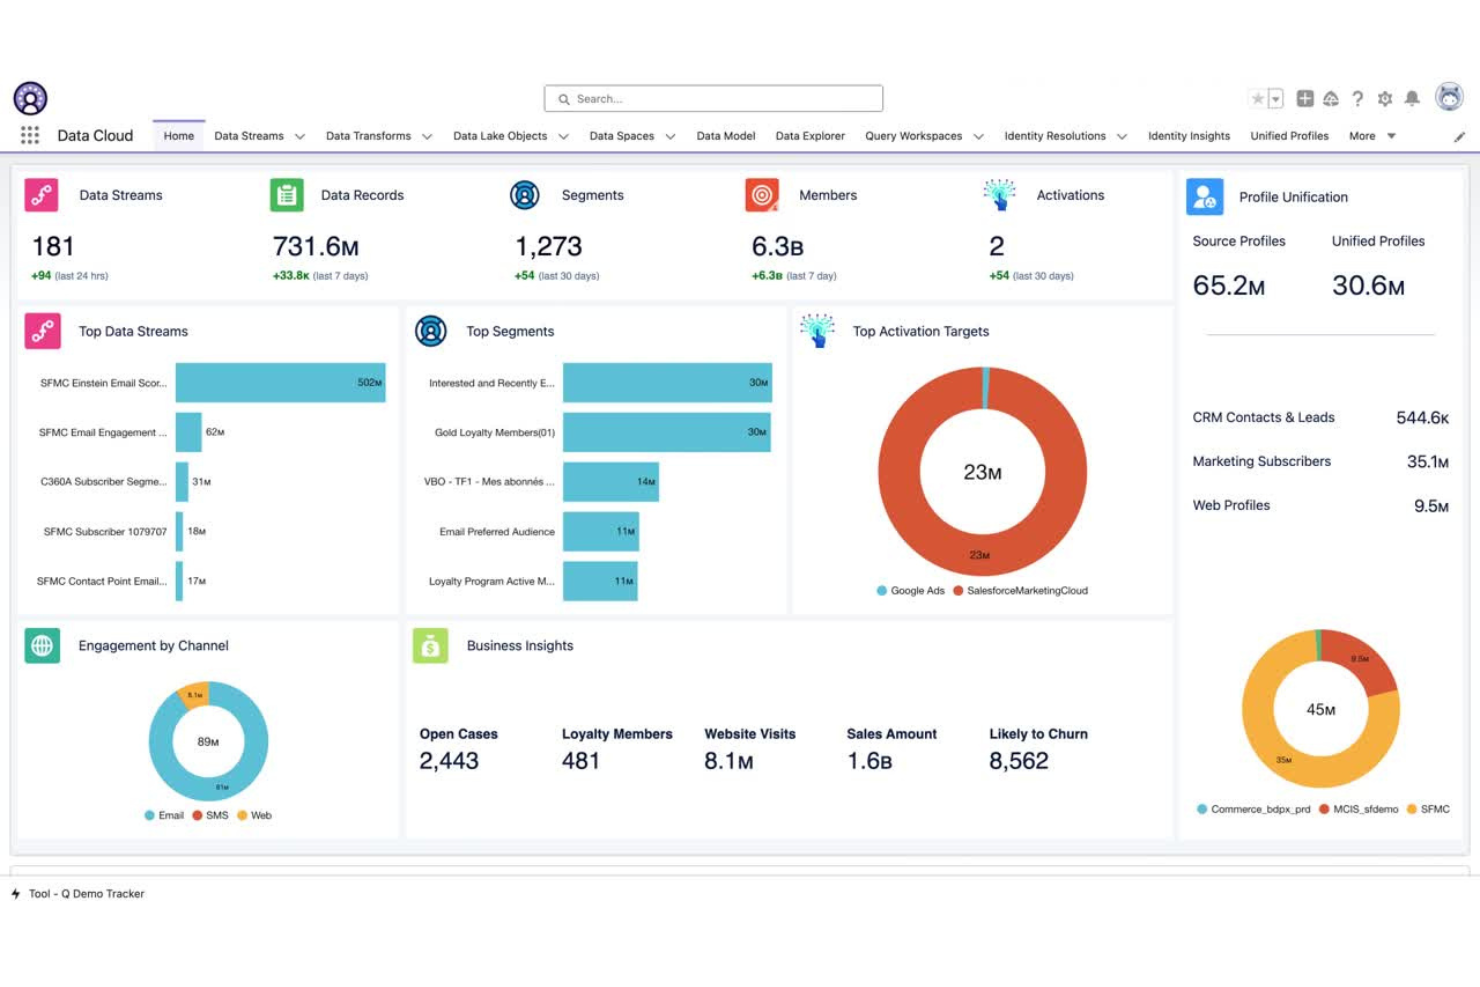
Salesforce Data Cloud is a platform deeply embedded in the Einstein Platform, aiming to bring entire organizations together around the customer to improve experiences and drive growth. It eliminates data silos and integrates structured and unstructured data into Salesforce with a library of connectors and zero-copy integrations.
Why I picked Salesforce Data Cloud: Salesforce Data Cloud provides strong AI-driven customer data unification capabilities. It stands out due to its seamless integration with various data sources and ability to leverage AI for actionable insights, helping businesses drive growth through improved customer experiences.
Standout features & integrations:
Features include the elimination of data silos, integration of structured and unstructured data, and the use of AI to drive better customer experiences.
Integrations include Snowflake, Redshift, BigQuery, Databricks, Google Analytics, Facebook Ads, LinkedIn, Mailchimp, HubSpot, and Google Sheets.
Pros and Cons
Pros:
- Robust customer data unification
- Seamless data integration
- AI-driven insights
Cons:
- Limited offline access capabilities
- Complex setup

Microsoft Power BI is an advanced data visualization tool that enables users to create interactive reports and dashboards. It provides users with strong capabilities in handling large datasets and integrating seamlessly with other Microsoft products.
Why I picked Microsoft Power BI: Microsoft Power BI offers the unparalleled ability to scale across large enterprises, making it a standout among data visualization tools. Its integration with the Microsoft ecosystem, including Azure and Microsoft 365, provides a seamless experience for users. Additionally, the software can handle petabytes of data and offers advanced AI features to uncover insights.
Standout features & integrations:
Features include advanced AI capabilities, a user-friendly drag-and-drop interface, and strong data governance and security.
Integrations include Salesforce, Microsoft Dynamics, Google Analytics, Azure SQL Database, Excel, SharePoint, Power Apps, Microsoft Teams, OneDrive, and GitHub.
Pros and Cons
Pros:
- Advanced AI features
- Integrates with Microsoft products
- Scales to enterprise needs
Cons:
- Complex licensing structure
- Steeper learning curve

Unity Report Builder is a drag-and-drop report builder tool for real-time 3D project management. It allows users to create and customize reports for their 3D projects easily.
Why I picked Unity Report Builder: Unity Report Builder offers a unique focus on real-time 3D project management, which sets it apart from other drag-and-drop report builders. Its integration within the Unity Industry platform provides strong tools for creating and managing 3D data, making it ideal for industries requiring detailed 3D project reports.
Standout features & integrations:
Features include a user-friendly drag-and-drop interface, real-time data integration, and extensive customization options for 3D project reports.
Integrations include Autodesk, Siemens, Dassault Systèmes, PTC, Bentley Systems, Microsoft Azure, AWS, Google Cloud, IBM, and Oracle.
Pros and Cons
Pros:
- Industry-specific support
- Extensive customization options
- Real-time data integration
Cons:
- Limited to 3D project management
- Requires Unity platform

YCharts is a financial research and proposal platform that empowers financial advisors with real-time portfolio monitoring. It offers an advanced suite of tools for portfolio analytics, custom proposals, and client communication.
Why I picked YCharts: YCharts excels in providing real-time portfolio monitoring, which is important for advisors managing client investments. Its extensive library of financial data and charts can be effortlessly incorporated into reports, making it an ideal tool for financial analysts and advisors who need to present complex data in a clear and visually appealing format.
Standout features & integrations:
Features include customizable meeting materials, portfolio construction tools, and market and position monitoring.
Integrations include Salesforce, Morningstar, Black Diamond, Redtail, Orion, eMoney, Riskalyze, MoneyGuidePro, Wealthbox, and Advyzon.
Pros and Cons
Pros:
- Portfolio analytics
- Customizable reports
- Real-time data
Cons:
- Higher learning curve
- Financial focus only

Metabase is a business intelligence platform offering self-service and embedded analytics for various user needs. Its user-friendly interface allows non-technical users to create dashboards and analytics.
Why I picked Metabase: Metabase stands out with its open-source nature and ease of use, making it accessible to technical and non-technical users. Its ability to provide self-service business intelligence without requiring extensive technical knowledge makes it unique compared to other drag-and-drop report builders. Overall, the software empowers users to explore and analyze data independently, reducing the dependency on IT teams.
Standout features & integrations:
Features include a visual query builder, drill-through capabilities to pull threads in data, usage analytics, analytics dashboards, an SQL editor, and sandboxing to set boundaries around data.
Integrations include Amazon Athena, Amazon Redshift, Apache Spark, BigQuery, ClickHouse, Dremio, Druid, DuckDB, Exasol, and Firebolt.
Pros and Cons
Pros:
- Extensive integrations
- Open-source option
- User-friendly interface
Cons:
- Requires setup
- Limited advanced features

Joyfill is a drag-and-drop report builder that offers a customizable and data-rich report builder SDK for businesses. It aims to provide an unparalleled user experience and empower users and developers to create visually appealing and data-rich reports.
Why I picked Joyfill: Joyfill is known for its highly customizable report builder SDK, which stands out for its developer-friendly integration and extensive feature set. Unlike other tools, Joyfill offers deep configurability and native embedding options, making it ideal for developers who need to create tailored reporting solutions. Additionally, the software’s ability to seamlessly integrate with various programming languages and provide real-time data control makes it the best choice for developers needing customizable report builders.
Standout features & integrations:
Features include database field identifiers, pixel-perfect drag-and-drop fields, dynamic form fields, graph and chart elements, and mobile report generation.
Integrations include JavaScript, React, Swift, Kotlin, Angular, Snowflake, Redshift, BigQuery, Databricks, and Salesforce.
Pros and Cons
Pros:
- Real-time data control
- Developer-friendly
- Highly customizable
Cons:
- Limited pre-built templates
- Requires technical knowledge
Other Drag-and-Drop Report Builders
Below is a list of additional drag-and-drop report builders that I shortlisted. While they didn’t make the top 10, they’re still valuable and worth further research.
- QueryTree
For non-technical users needing simple data querying
- Collabaro
For field service professionals
- Domo
For real-time data visualization
- Grow
For business intelligence dashboards
- Astera ReportMiner
For data extraction from unstructured sources
- Formstack
For versatile form-building
- Heyflow
For interactive form creation
- Odoo
For comprehensive business management
- Fivetran
For automated data integration
- FastField
For mobile data collection


Related Project Management Software Reviews
If you still haven't found what you're looking for here, check out these other related tools that we've tested and evaluated:
- Project Management Software
- Resource Management Software
- Workflow Automation Software
- Time Tracking Software
- Task Management Software
- Collaboration Tools
- Gantt Chart Maker
- Productivity Tools
- Project Tracking Software
- Project Scheduling Software
How I Evaluate Drag and Drop Report Builders
Drag and drop report builders are what agencies rely on to send multiple clients a branded, data-connected performance report every Monday without developer support. I look at this category in two layers: the baseline every tool has to meet, and what separates one pick from another.
Core Functionality (Table Stakes for This List)
For drag and drop report builders, the core functionality I test and evaluate is:
- Visual report design: I check whether you can drag charts, tables, and KPI widgets onto a canvas and arrange them freely without touching any code.
- Data source connectivity: Native integrations with platforms like Google Analytics or HubSpot matter more than raw connector counts.
- Visualization library: I look for a range of chart types, scorecards, gauges, and tables that can be configured and data-bound directly in the builder.
- Filtering and calculated fields: Reports need dynamic date-range filters and custom metrics like cost-per-lead derived from raw data fields.
- Report customization: Branding controls for logos, colors, fonts, and layout spacing are essential for client-facing or executive-ready deliverables.
- Export and sharing: I evaluate PDF and CSV export quality, shareable links, and whether recipients can view reports without creating an account.
- Automated scheduling: The ability to send reports on a recurring cadence, like every Monday at 8 AM to a client distribution list, is non-negotiable.
- Templates: Reusable report structures that can be cloned across clients or projects save hours of rebuild work each reporting cycle.
A tool has to deliver most of these capabilities to earn a spot on the list. From there, I consider what sets each tool apart.
Standout Features (What Separates the Picks)
Some platforms provide advanced AI-powered insights and narrative generation to help explain report results to non-technical stakeholders. I consider how white-label branding and custom domains transform the experience for agencies delivering reports to dozens of clients. Integration depth stands out too—tools that fetch granular metrics and keep up with constant API updates across ad and analytics platforms are far more valuable than those with shallow connectors.
What I Weigh Beyond Features
Pricing model architecture matters a lot here. I evaluate whether a tool charges per client, per data source, or per user, because the cheapest starter plan can become the most expensive at 50 or more clients. Support quality is another factor I check closely, since broken API connections require fast resolution. I also consider who each tool is actually built for, whether that's a five-person agency, an in-house marketing team, or an enterprise BI department.
How to Choose Drag-and-Drop Report Builders
As you work through your unique software selection process, keep the following points in mind:
- Ease of Use: A drag-and-drop report builder should be intuitive and user-friendly, allowing users to create reports without extensive technical knowledge. This ease of use is important for organizations that must empower their staff to generate reports quickly and efficiently without relying on IT support.
- Integration Capabilities: An advanced reporting tool must integrate with various data sources. This feature benefits marketing agencies that must consolidate data from different campaigns and present a unified view to their clients.
- Customization and Flexibility: The report builder should offer extensive customization options to tailor reports to specific needs. This flexibility is vital for businesses that require detailed and specific reporting formats to meet diverse stakeholder requirements. Builders like white label dashboards enable can enable branded customization for more professional-looking reporting.
- Automated Reporting: Automation features can save significant time and effort by scheduling reports to run at specific intervals and automatically updating data. It’s beneficial for agencies that need to provide regular updates to clients without manually generating reports each time.
- Support and Resources: Access to strong support and resources can significantly enhance the user experience. These resources ensure that users can quickly resolve issues and make the most of the report builder's features, which is important for maintaining productivity and efficiency.
Trends for Drag-and-Drop Report Builders
Here are some trends I’ve noticed for drag-and-drop report builders, plus what they might mean for the future. I sourced countless product updates, press releases, and release logs to tease out the most important insights.
- AI-Powered Data Insights: The integration of AI-powered insights in drag-and-drop report builders is increasingly helping users identify key trends and patterns without requiring deep expertise in data analysis. This trend is significant because it democratizes data analysis, enabling a broader range of users to make data-driven decisions with ease.
- Real-Time Collaboration: The inclusion of real-time collaboration features in report builders is becoming a standard expectation, allowing multiple users to simultaneously build and edit reports. This trend is important as it enhances teamwork, streamlines the workflow, and accelerates the decision-making process, making it easier for teams to stay aligned.
- Customizable Templates: The rise in popularity of customizable templates in drag-and-drop report builders allows users to tailor reports to meet specific needs and preferences. This trend is valuable as it enables more personalized and relevant reporting, ensuring that the final output aligns closely with the unique requirements of different projects or clients.
- Mobile Accessibility: An increasing focus on mobile-friendly report builders is enabling users to create and edit reports from anywhere, directly from their smartphones or tablets. This trend is especially important for remote and field workers, offering them the flexibility to work on reports while on the move, ensuring that reporting tasks can be completed without delays.
- Enhanced Data Security: Prioritization of data security in report builders is leading to the standardization of advanced encryption and access controls. This trend is vital as it addresses growing concerns over data privacy and compliance, ensuring that sensitive information is protected throughout the reporting process.
What Are Drag-and-Drop Report Builders?
A drag-and-drop report builder is a tool that allows users to create custom reports by dragging and dropping data fields into a report layout. Business analysts, data scientists, and managers commonly use it to generate insightful reports without needing advanced technical skills. This tool helps users visualize data, track performance metrics, and make data-driven decisions.
Key features generally include a user-friendly interface, data fields, and customizable templates. Users can select data fields from a list, drag them into the report area, and arrange them as needed. The tool often includes options for adding charts, tables, and filters to enhance the report's clarity and usefulness.
Features of Drag-and-Drop Report Builders
Here are the most important features to look for in drag-and-drop report builders:
- User-Friendly Interface: A simple and intuitive interface allows users to create reports without extensive technical knowledge.
- Customizable Templates: Pre-built templates that can be customized save time and ensure consistency across reports.
- Real-Time Data Integration: The ability to integrate real-time data ensures that your reports are always up-to-date.
- Interactive Elements: Features like charts, graphs, and tables that users can interact with make reports more engaging and easier to understand.
- Collaboration Tools: Tools that allow multiple users to work on the same report simultaneously improve teamwork and efficiency.
- Data Export Options: The ability to export reports in various formats, such as PDF, Excel, or CSV, makes sharing and further analysis easier.
- Security Features: Ensuring your data is protected with robust security measures is crucial for maintaining confidentiality and integrity.
- Mobile Compatibility: Accessing and editing reports on mobile devices provides flexibility and convenience.
- Drag-and-Drop Functionality: This core feature allows users to add and arrange elements in their reports easily without needing to write code.
- Custom Calculations: The ability to perform custom calculations within the report builder helps create more detailed and specific reports.
Benefits of Drag-and-Drop Report Builders
Here are some benefits associated with drag-and-drop builders.
- Ease of Use: Drag-and-drop report builders are designed with intuitive interfaces that allow users to create reports by simply dragging and dropping elements, making the process accessible even to those with limited technical expertise.
- Time Efficiency: These tools significantly reduce the time required to generate reports by simplifying the report creation process. This allows employees to focus on more strategic tasks and improves overall productivity.
- Customization: Users can easily customize reports to meet specific needs and preferences, ensuring the data presented is relevant and actionable for different organizational stakeholders.
- Real-Time Data Integration: These tools often support real-time data integration, enabling users to pull the latest data from various sources and create up-to-date reports that reflect the current state of the business.
- Collaboration: Drag-and-drop report builders facilitate collaboration by allowing multiple users to work on the same report simultaneously, enhancing teamwork and ensuring that all relevant insights are included.
Costs & Pricing of Drag-and-Drop Report Builders
Selecting the right drag-and-drop report builder requires an understanding of the various pricing models and plans available. These tools can significantly enhance data processes, but costs vary based on features and organization size.
Plan Comparison Table for Drag-and-Drop Report Builders
| Plan Type | Average Price | Common Features |
|---|---|---|
| Free Plan | $0 | Basic reporting, limited customization, and essential integrations |
| Personal Plan | $10 - $20 per month | Enhanced customization, additional integrations, and basic automation |
| Business Plan | $50 - $100 per month | Advanced customization, white labeling, extensive integrations, and automated reports |
| Enterprise Plan | $500+ per month | Complete customization, white labeling, unlimited integrations, and advanced automation |
Drag and Drop Report Builder FAQs
Here are some common questions about drag-and-drop report builders.
How can I customize the layout of my reports?
Most drag-and-drop report builders offer extensive customization options. You can typically adjust the size and position of elements, change fonts and colors, and add images or logos. Some tools also allow for advanced customization through CSS or HTML for those with coding knowledge.
Can I integrate data from multiple sources?
Many advanced drag-and-drop report builders support integration with various data sources, including databases, cloud storage, CRM systems, and other SaaS applications. Check the specific integrations your tool supports to ensure compatibility with your data sources.
How do I share my reports with others?
Sharing options vary by tool but commonly include exporting reports as PDFs, sharing via email, or generating shareable links. Some platforms also offer real-time collaboration features, allowing multiple users to view and edit reports simultaneously.
What kind of support is available if I encounter issues?
Support options typically include online documentation, video tutorials, and community forums. Many providers also offer direct support through email, chat, or phone. Premium plans may consist of dedicated account managers or priority support.
Can I use templates to speed up report creation?
Yes, most drag-and-drop report builders come with a variety of pre-built templates. These templates can be customized to fit your specific needs, allowing you to create professional-looking reports quickly and efficiently.
How secure is my data in a drag-and-drop report builder?
Security features vary by provider but often include data encryption, user authentication, and access controls. It’s essential to review the security measures of your chosen tool to ensure they meet your organization’s requirements.
Are there limitations on the amount of data I can use?
Data limitations depend on the specific tool and your subscribed plan. Some tools may restrict the number of data rows or the size of files you can upload. Always check your plan’s limitations to ensure it meets your needs.
What’s Next?
Want to connect with other digital project managers to share resources and best practices? Join our membership community.