Decision Flowchart: What It Is And How To Create One

![DPM – [Category] Best Practices – document management best practices – featured image](https://thedigitalprojectmanager.com/wp-content/uploads/2025/05/DPM-–-Category-Best-Practices-–-document-management-best-practices-featured-image-792x446.jpg)
If you’ve ever felt stuck at a project crossroads and wished for a clear, visual way to chart your next move, a decision flowchart might be exactly what you need.
Project managers often juggle complex decision-making, multiple stakeholders, and shifting priorities, all while trying to maintain clarity and direction. This article will help you simplify decision-making processes, align team members, and eliminate ambiguity, all through a single, powerful visual: the flowchart.
What Is a Decision Flowchart?
A decision flowchart is a type of flow diagram that visually maps out choices, decision points, and potential outcomes. Built using standard flowchart symbols, like diamonds for decisions and rounded rectangles for start/end points, it differs from a generic process flow diagram by focusing on decisions rather than tasks.
At its core, it uses nodes (representing decisions or actions), branches (yes/no or other logical outcomes), and connectors to lay out paths. Each decision point acts as a fork in the road, and depending on the chosen path, the course of action can shift dramatically.
While workflow and business process diagrams capture sequences and roles, a decision flowchart zeroes in on key choices. For digital project managers, this clarity supports stakeholder alignment, risk analysis, and leaner execution, especially in high-pressure scenarios.
How Does a Decision Flowchart Work?
Think of a decision flowchart as a visual logic tree. At each decision point, it offers a branch based on inputs, conditions, or outcomes. This logic-driven structure helps break down even the most complex decision into manageable steps.
Let’s walk through a simple flowchart example:
Using basic flowchart diagrams, you can answer that question with clarity, helping you avoid delays and finger-pointing. This type of flow diagram can be especially useful for newer PMs or beginners who want to bring structure to their decision-making.

When and Why to Use a Decision Flowchart
You might use a decision flowchart in various project management scenarios. Common use cases include:
- Risk assessment workflows
- Team member escalation protocols
- Client communication planning
- Managing business process changes
Here’s why these flowcharts shine:
- Reduces ambiguity: Everyone sees the logic behind decisions.
- Improves alignment: Keeps your stakeholders and team members on the same page.
- Supports remote decisions: Especially helpful for distributed teams making real-time calls without a shared physical workspace.
- Surfaces bottlenecks: Visually surface gaps or slowdowns in your workflow.
- Improves consistency: Reuse your decision flowchart template to standardize recurring decision trees.
For example, during sprint planning, a flowchart can help determine whether to include a feature based on effort, timeline, and priority, streamlining decision-making across the board.
How to Create a Decision Flowchart
Creating a decision-making flowchart starts with understanding decision mapping: the practice of outlining decision points, actions, and outcomes. You’ll use standard flowchart symbols like:
- Diamond = decision
- Rounded rectangle = start/end
- Rectangle = action
- Flowline or connector = direction/path

- Identify the decision point: Learn what triggers the need for a decision. As you can probably tell, identifying decision points for a decision flowchart is the most important steps.
- Map possible outcomes: Once you've identified the decisions, it's time to answer those questions. List all reasonable choices or results from encountering that decision during your process.
- Create logical branches: Use clear yes/no (or conditional) flows and connectors to join decisions with their outcomes.
- Use flowchart tools: Using flowchart tools can help you quickly create flowcharts—especially AI flowchart generators. More on this later.
Pro Tips:
Project management flowcharts do their job when they communicate clearly how information flows through different stages. Follow these tips to ensure you achieve that.
- Keep it simple: Avoid overwhelming graphs with too many options.
- Validate logic: Walk through it with your stakeholders.
- Review edge cases: Make sure your chart accounts for unexpected inputs.
Once created, use your diagram template as part of a larger documentation or onboarding toolkit.
Best Practices and Common Pitfalls
A great decision flowchart is clear, simple, and actionable. Here are things you should do and avoid to make sure you deliver a quality flowchart.
Practices & Pitfalls
Do:
- Use consistent flowchart symbols
- Provide multiple options at each decision point
- Validate the flow with stakeholders and team members
- Use clear labels and minimize jargon
- Keep all endpoints visible and well-defined
Don't:
- Overcomplicate with unnecessary graphs or branches
- Skip rare but possible edge cases
- Forget to define your input/output at key steps
- Use inconsistent connector styles
Once you are done with your charts, you will see that a well-executed chart has logical flow, clean labels, and minimal crossing lines. On the flip side, a poor chart lacks structure, mixes symbol usage, and leaves decision points vague.
Use tutorials and sample templates to calibrate your first few diagrams—and iterate with your team.
Other Types of Flowcharts and How They Compare
Not every chart is a decision flowchart. Depending on your project needs, you might use one of many types of flowcharts:
| Flowchart Type | Purpose | Best Use Case |
|---|---|---|
| Decision Tree | Maps decisions and outcomes | Risk analysis, yes/no questions |
| Process Flowchart | Visualizes task sequences | SOP documentation |
| Swimlane Diagram | Divides tasks across teams/roles | Cross-functional coordination |
| Data Flow Diagram | Shows how data moves between systems | Systems planning or integrations |
A decision tree is a cousin of the decision flowchart but focuses on probability and predictive logic. A swimlane diagram adds structure by assigning actions to specific team members or departments.
When in doubt, choose the diagram template that aligns best with your goals, whether it's clarity, collaboration, or automation.
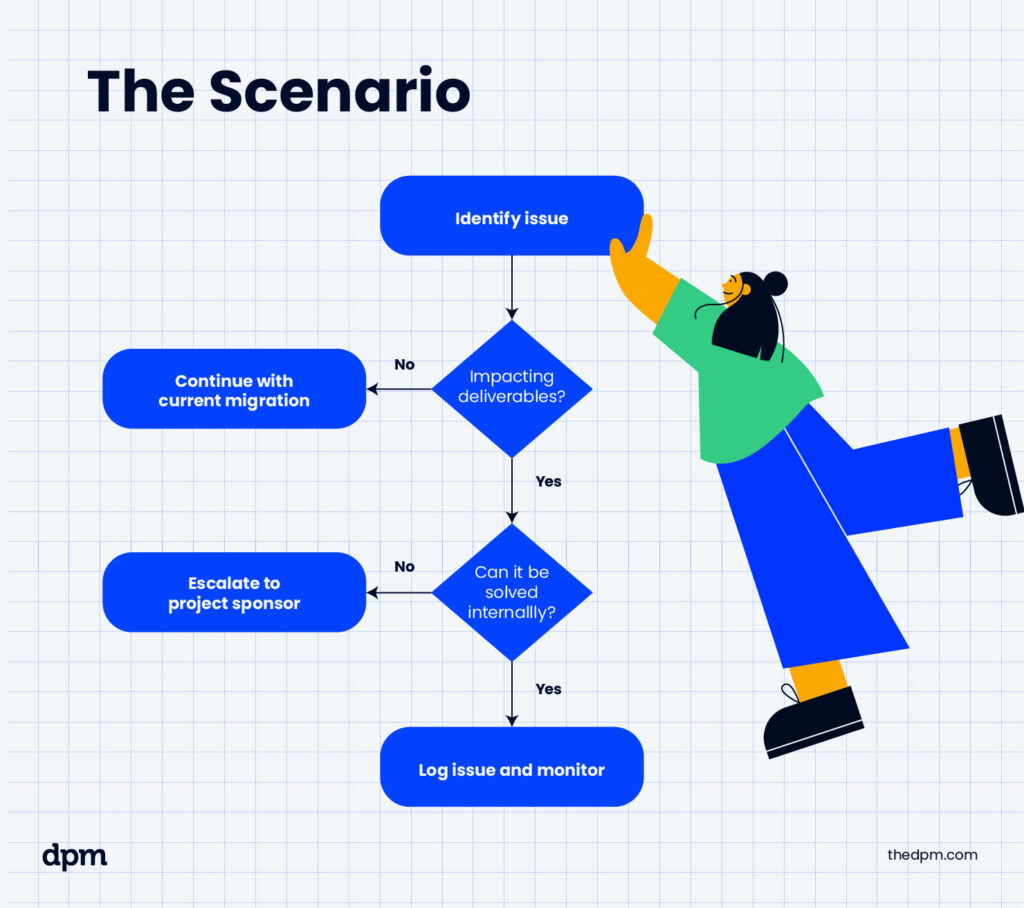
Decision Flowchart (Decision Tree) Example
Now that you’ve learned all about decision flowcharts or decision trees, I thought it would be nice to show you one:

As you can see, the more decisions you have to make, the wider and taller this chart becomes. Learning how to make a flowchart is essential to communicating with accuracy.
Creating Flowcharts Using Tools
In modern teams, collaboration is key. Luckily, flowchart software make co-creation seamless. Here are 3 benefits of using these tools:
- Functionality: Built-in templates, flowline connectors, and export options.
- Real-time collaboration: Update and comment together with stakeholders.
- Integrations: Many tools connect with Microsoft Teams, Asana, and more.
If you want to create this and other types of flowcharts, you can use flowchart software. This software can help you create them faster, collaborate while you are at it, and share the result with multiple stakeholders. Here are a few tools you can consider getting started with:


Explore tool-specific flowchart template libraries to avoid starting from scratch, and customize your decision flowchart template for repeat use.
Join For More Business Process Management Insights
Want to connect with other digital project managers to share resources and best practices? Join our membership community and get access to 100+ templates, samples, and examples and connect with 100s of other digital project managers in Slack.
