


Venngage Review: Pros, Cons, Features and Pricing



Venngage is an AI flowchart generator and design platform that helps project managers turn messy processes and big-picture ideas into clear, professional diagrams fast. If you're tired of clunky diagram tools or wasting a lot of time formatting shapes, Venngage offers an intuitive drag-and-drop interface backed by AI suggestions. You can generate and edit flowcharts with just a prompt, making it easy to capture shifting requirements, explain workflows, and share updates with teams or stakeholders.
In this review, I'll break down Venngage's key features, where it fits best, its pros and cons, and whether its pricing makes sense compared to other AI flowchart solutions.
Venngage Evaluation Summary
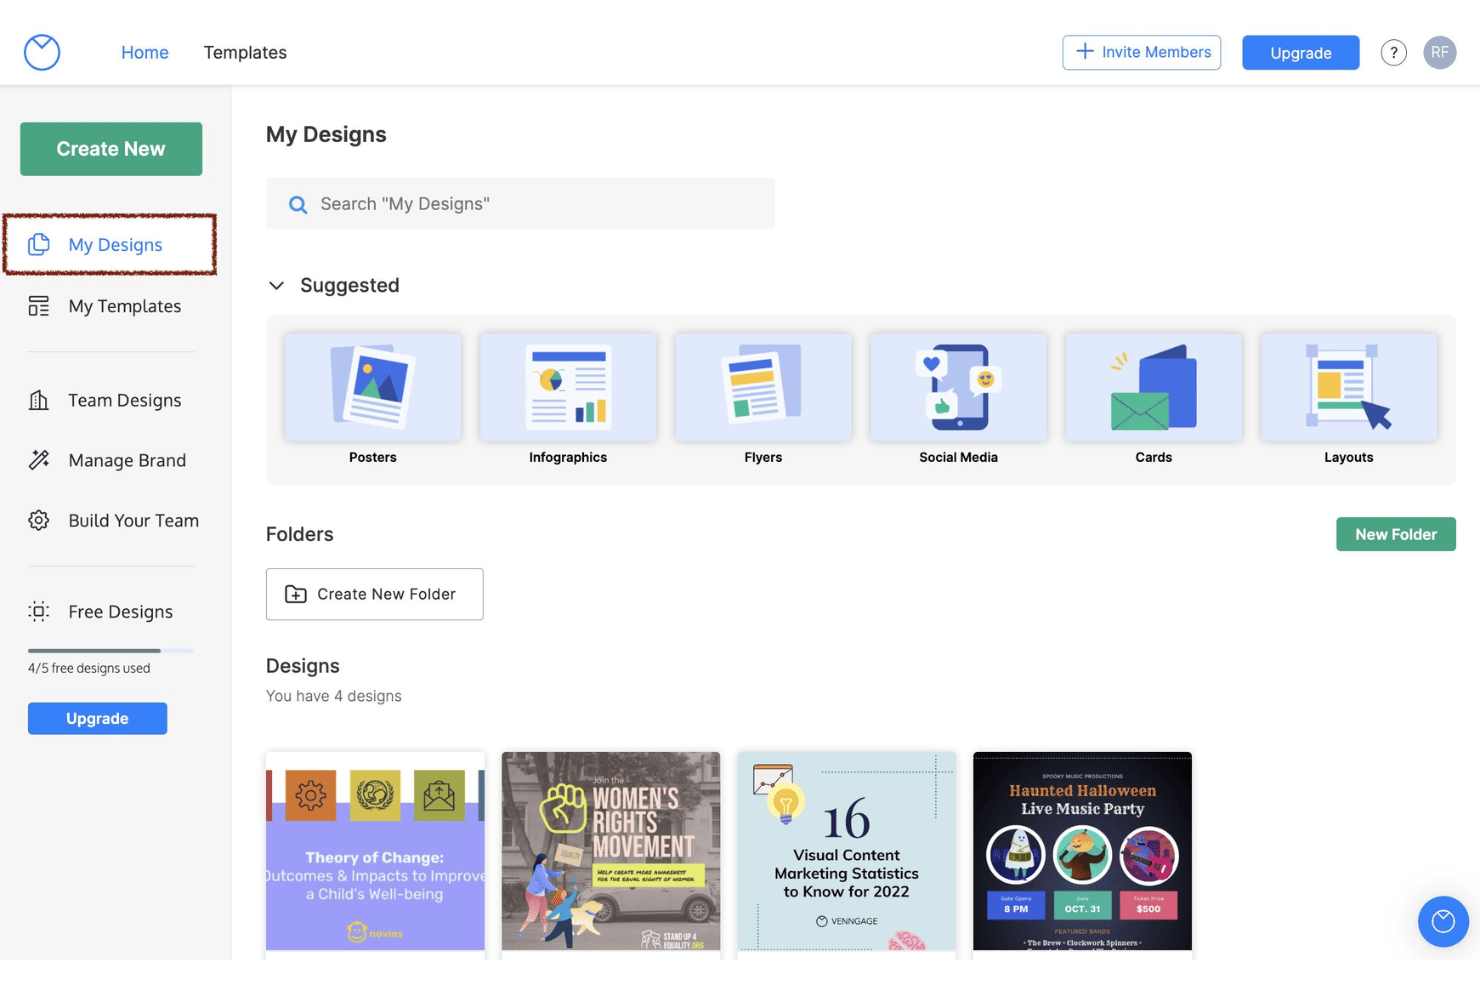
- From $10/month (billed annually)
- Free plan available
Why Trust Our Software Recommendations
Our team has been testing and reviewing software since 2012. As project managers ourselves, we know how difficult—and important—it is to choose the right software.
For this guide, we evaluated tools using hands-on testing and independent research, scoring tools using our selection criteria. We also draw on insights from industry thought leaders and practicing project management experts.
Our reviews reflect our human editorial judgment, not a sales pitch.
Expert reviewers:
Venngage Overview
When judging Venngage as an AI flowchart generator, I think it outperforms competitors with its user-friendly interface, solid onboarding, and surprisingly flexible templates. You'll find the AI prompt feature speeds up diagram creation, while real-time collaboration makes editing with teammates simple. Pricing runs higher than some basic tools, but for project managers who value customization, visual polish, and easy exporting, Venngage stands out. I'd select it for teams that care about presentation quality and need to create shareable, client-ready flowcharts without much training. However, if you're after complex integrations or advanced automations, it may not be the best fit.
pros
-
AI suggestions help build complex flowcharts from text prompts
-
Template library covers many project and workflow scenarios
-
Export options include high-resolution, PDF, and presentation modes
cons
-
Diagram automation is limited for conditional logic or swimlanes
-
Frequent upgrades and feature gates frustrate some free plan users
-
Collaboration features lack fine-grained commenting or approval flows
Is Venngage Right For Your Needs?
Who Would be a Good Fit for Venngage?
Venngage is a strong choice for professionals, teams, and companies who need great-looking, brand-aligned flowcharts without design expertise. Graphics-rich departments and roles—especially those who need to present or share diagrams with a broader audience—will get the most out of its visual customization and template tools. If your projects involve stakeholder presentations, content marketing, or live collaborative editing, Venngage's combination of templates and instant exports really stands out. Teams that need to embed visuals into reports or share assets on social media channels will find the export versatility a great tool for their workflow.
-
Marketing Teams
Venngage offers eye-catching templates and plug-and-play branding for content that's polished and presentation-ready.
-
HR Departments
The onboarding, process, and policy templates make it easy to clarify workflows for employees at any stage.
-
Small Businesses
Smaller companies can access polished diagrams quickly without a designer, speeding up project communication and training.
-
Consultants
Consultants can create professional, branded visuals for client deliverables in minutes using ready-to-share exports.
-
Education Providers
Teachers and trainers can simplify complex topics into shareable diagrams and infographics with drag-and-drop tools.
-
Startups
Startups appreciate the ability to build pitch decks, process maps, or infographics that look great and save time.
Who Would be a Bad Fit for Venngage?
Venngage won't suit companies or teams that need very technical, logic-heavy diagrams, have strict data privacy controls, or are looking for ultra-budget solutions. Teams handling system architecture, needing tight tool integrations, or requiring custom automation may find Venngage limiting compared to more code-friendly or open-source tools. It's also not ideal for anyone who needs deep swimlane or conditional logic support in their diagrams.
-
Enterprise IT Teams
Venngage lacks advanced versioning, access controls, and integration support demanded by large-scale IT departments.
-
Large Engineering Firms
Engineers needing technical diagramming (like UML or circuit diagrams) will find the tool too basic and inflexible.
-
Finance Departments
Financial analysis teams often need data-rich, auto-generated flowcharts that Venngage does not provide.
-
Government Agencies
Venngage has limited compliance and on-premise deployment options required by public-sector environments.
-
Open Source Advocates
Those wanting source code access or self-hosting won't find Venngage a fit, since it's fully cloud-based and proprietary.
-
Security-Focused Organizations
Organizations with strict security requirements will miss features like private cloud or granular admin controls.
Our Review Methodology
How We Test & Score Tools
We’ve spent years building, refining, and improving our software testing and scoring system. The rubric is designed to capture the nuances of software selection and what makes a tool effective, focusing on critical aspects of the decision-making process.
Below, you can see exactly how our testing and scoring works across seven criteria. It allows us to provide an unbiased evaluation of the software based on core functionality, standout features, ease of use, onboarding, customer support, integrations, customer reviews, and value for money.
Core Functionality (25% of final scoring)
The starting point of our evaluation is always the core functionality of the tool. Does it have the basic features and functions that a user would expect to see? Are any of those core features locked to higher-tiered pricing plans? At its core, we expect a tool to stand up against the baseline capabilities of its competitors.
Standout Features (25% of final scoring)
Next, we evaluate uncommon standout features that go above and beyond the core functionality typically found in tools of its kind. A high score reflects specialized or unique features that make the product faster, more efficient, or offer additional value to the user.
We also evaluate how easy it is to integrate with other tools typically found in the tech stack to expand the functionality and utility of the software. Tools offering plentiful native integrations, 3rd party connections, and API access to build custom integrations score best.
Ease of Use (10% of final scoring)
We consider how quick and easy it is to execute the tasks defined in the core functionality using the tool. High scoring software is well designed, intuitive to use, offers mobile apps, provides templates, and makes relatively complex tasks seem simple.
Onboarding (10% of final scoring)
We know how important rapid team adoption is for a new platform, so we evaluate how easy it is to learn and use a tool with minimal training. We evaluate how quickly a team member can get set up and start using the tool with no experience. High scoring solutions indicate little or no support is required.
Customer Support (10% of final scoring)
We review how quick and easy it is to get unstuck and find help by phone, live chat, or knowledge base. Tools and companies that provide real-time support score best, while chatbots score worst.
Customer Reviews (10% of final scoring)
Beyond our own testing and evaluation, we consider the net promoter score from current and past customers. We review their likelihood, given the option, to choose the tool again for the core functionality. A high scoring software reflects a high net promoter score from current or past customers.
Value for Money (10% of final scoring)
Lastly, in consideration of all the other criteria, we review the average price of entry level plans against the core features and consider the value of the other evaluation criteria. Software that delivers more, for less, will score higher.
Core Features
AI Flowchart Generation
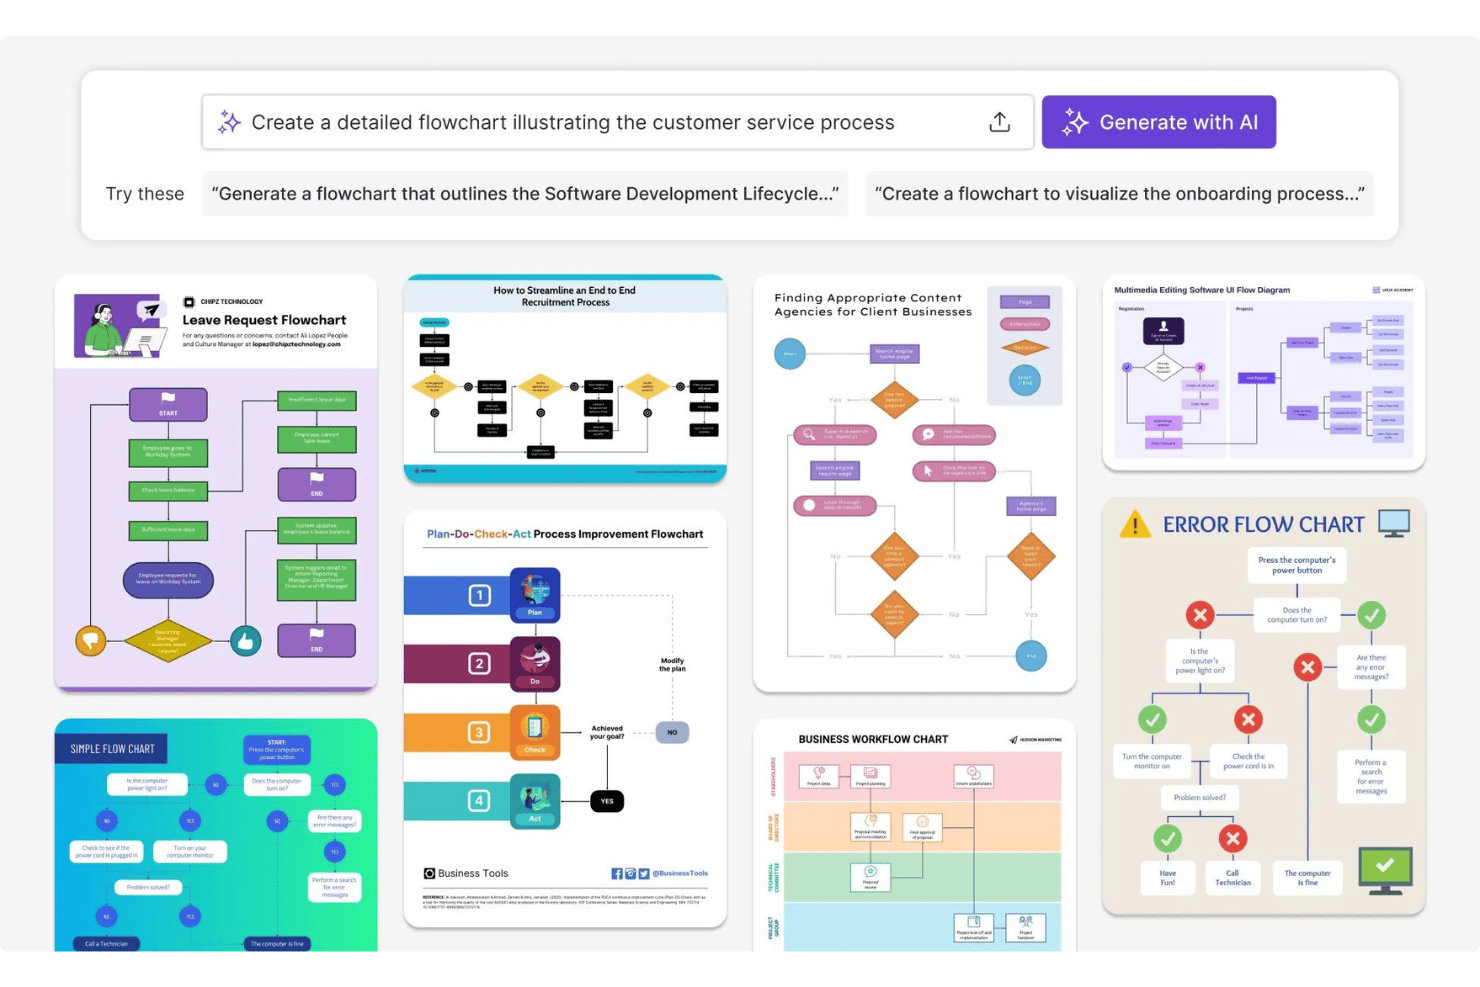
Generate flowcharts instantly from text prompts using built-in AI. The tool interprets descriptions and lays out shapes and connectors automatically.
Customizable Templates
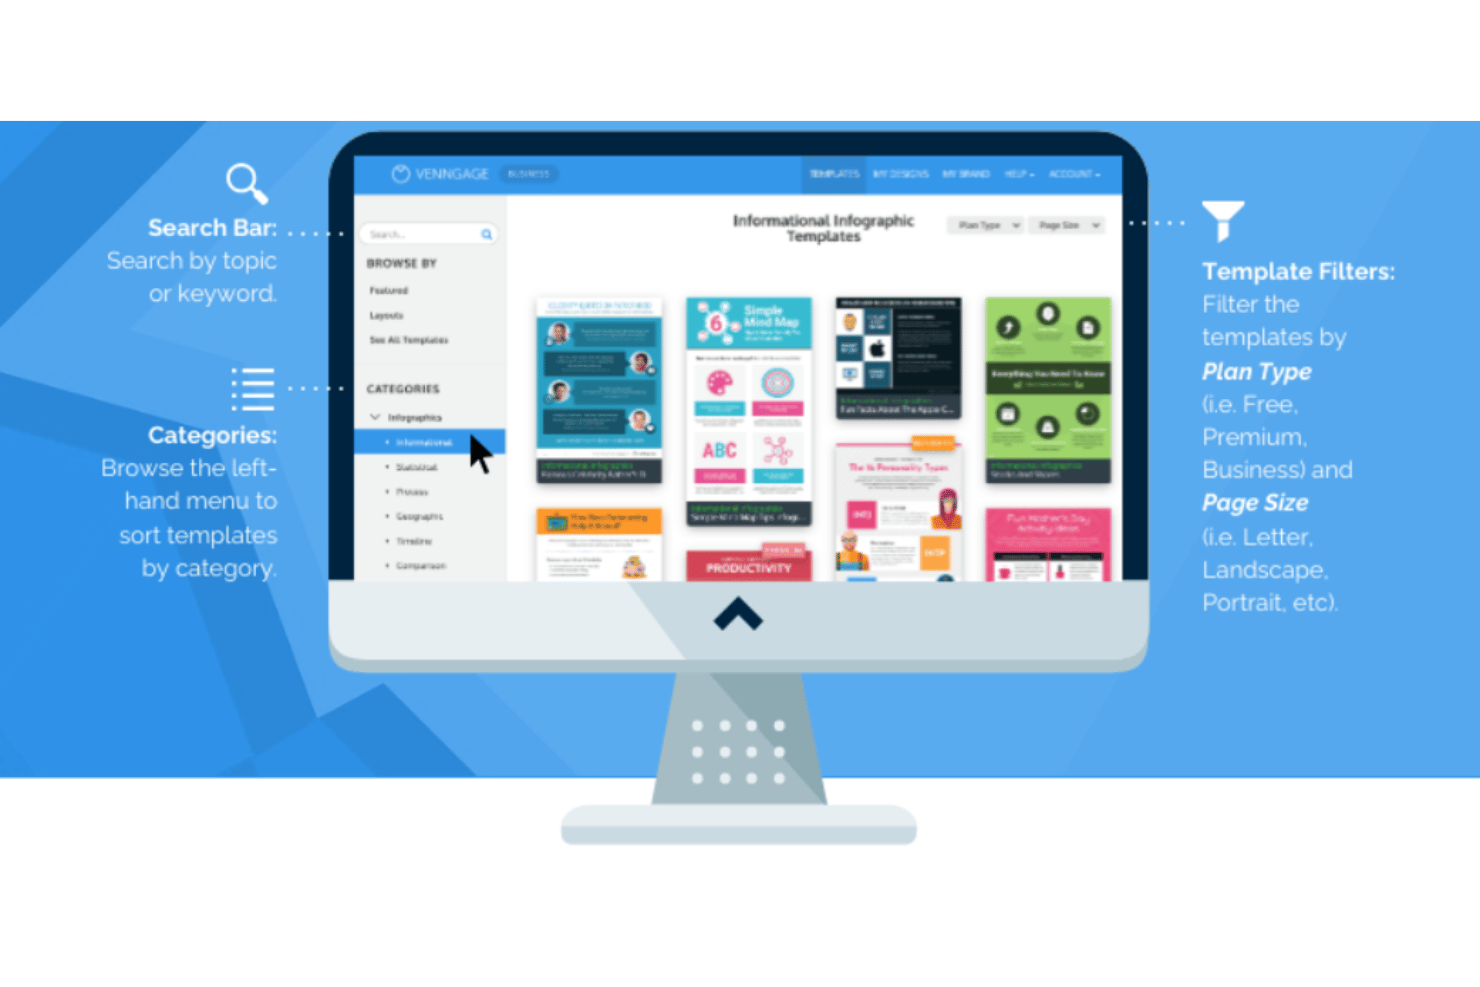
Choose from dozens of pre-built flowchart templates for processes, decisions, or org charts. Templates can be tailored with your own milestones, colors, or branding.
Real-Time Collaboration
Invite teammates to edit, comment, and update diagrams simultaneously online. You can share links for immediate feedback and live discussion.
Drag-and-Drop Editor
Easily move, resize, and connect elements with a user-friendly visual editor. Arrange complex workflows without coding or manual line-drawing.
Export and Sharing Options
Download flowcharts as high-resolution images, PDFs, or interactive links. Exporting simplifies sharing diagrams in status decks or project documentation.
Smart Styling Tools
Apply consistent shapes, connectors, and color schemes with automatic styling recommendations. Style updates apply across the whole diagram to keep visuals polished.
Standout Features
Brand Kit Integration
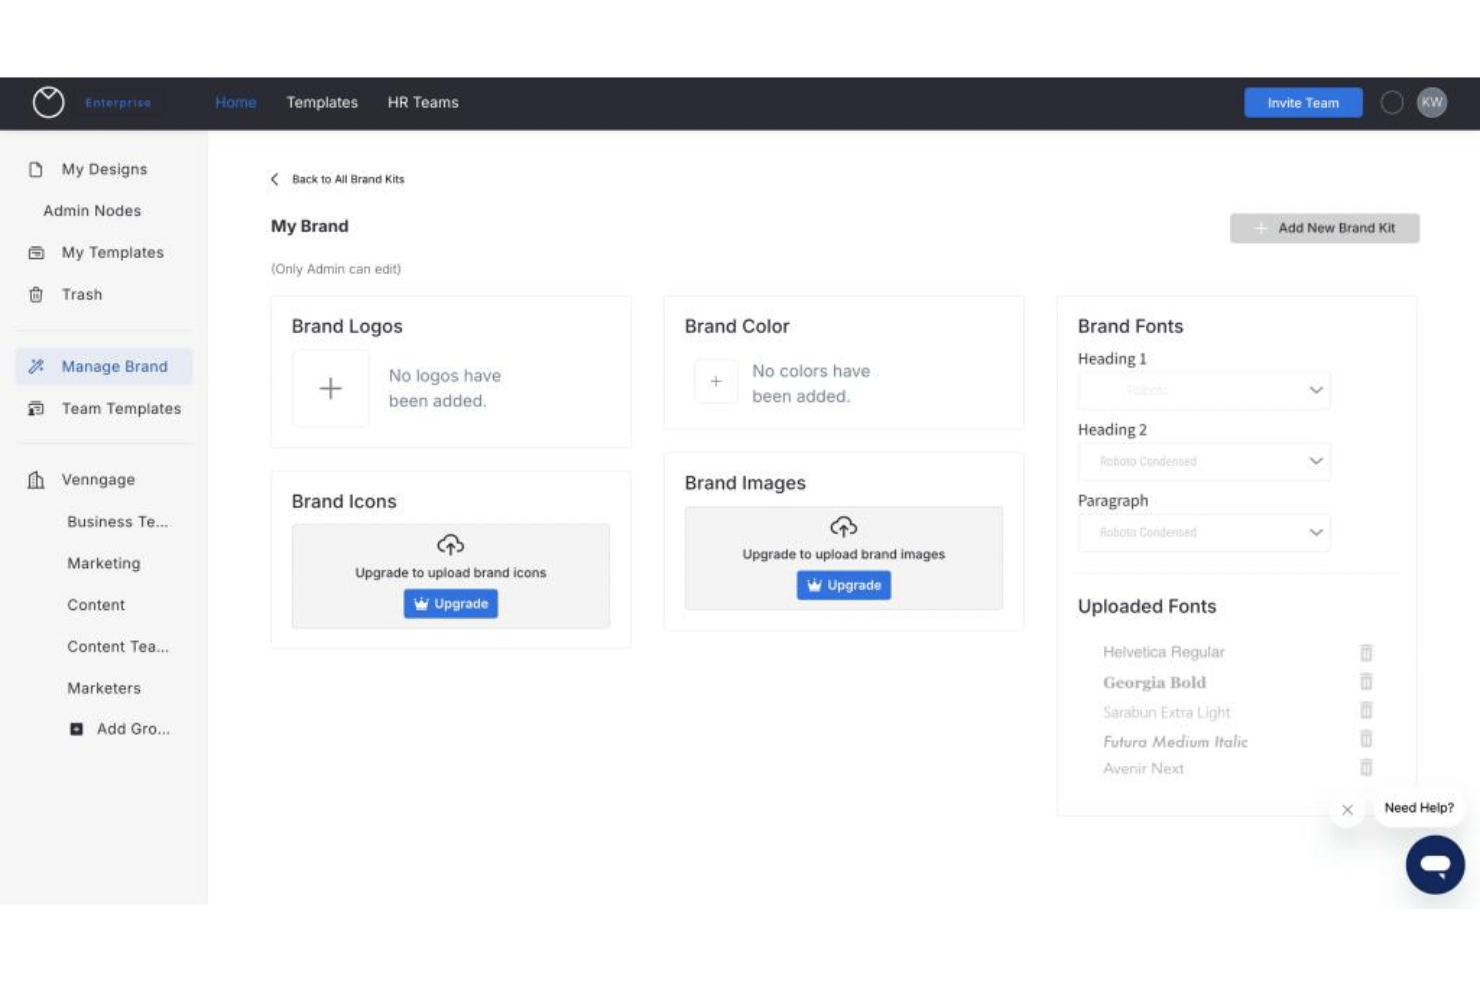
Automatically pull your company's fonts, colors, and logos into any flowchart. This makes every diagram brand-consistent without extra manual editing.
Infographic and Visual Asset Library
Access thousands of icons, illustrations, and stock photos directly within the editor. You can enhance diagrams with visuals that fit any industry or purpose.
Ease of Use
Venngage feels genuinely user-friendly, even for first-time project managers or beginners with no design background. The drag-and-drop interface, AI prompt input, and polished templates mean you can create diagrams without hunting for hidden features or advanced training. The learning curve is notably shallow—many reviewers highlight how little time it takes to build something shareable, and I agree: navigation is intuitive, and visual editing feels immediate and satisfying.
Onboarding
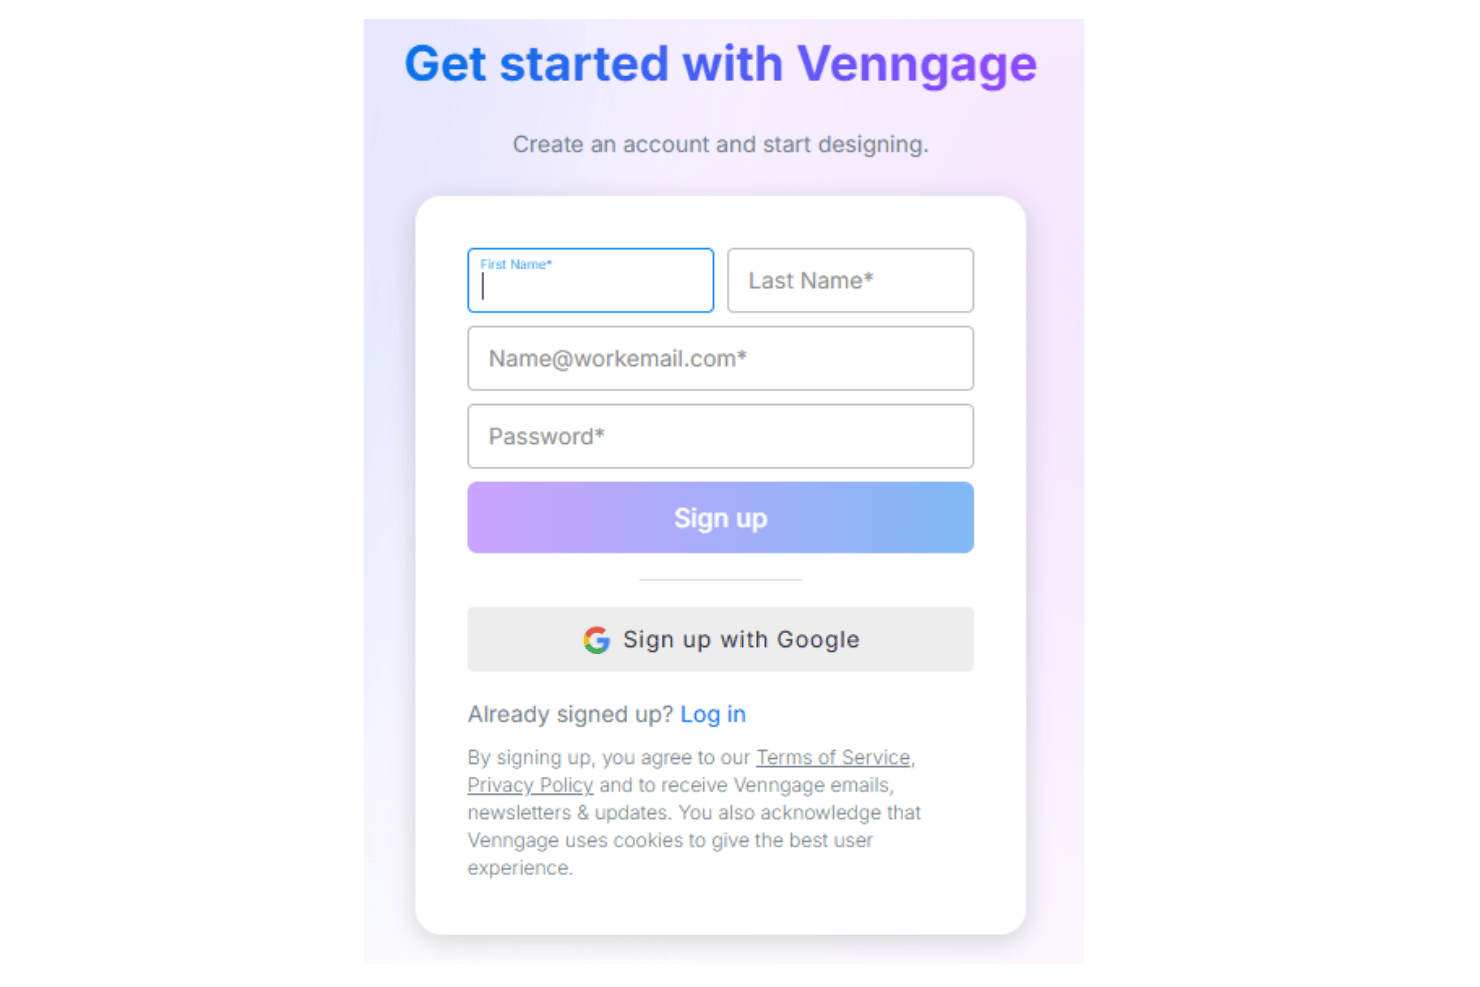
Venngage's onboarding is quick, with tooltips, walkthroughs, and sample templates guiding you from the start. Most users mention getting started in minutes thanks to a no-fuss sign-up and clear in-app help. The resource library, chat support, and detailed guides make it easy to solve questions fast, helping newcomers achieve value early.
Customer Support
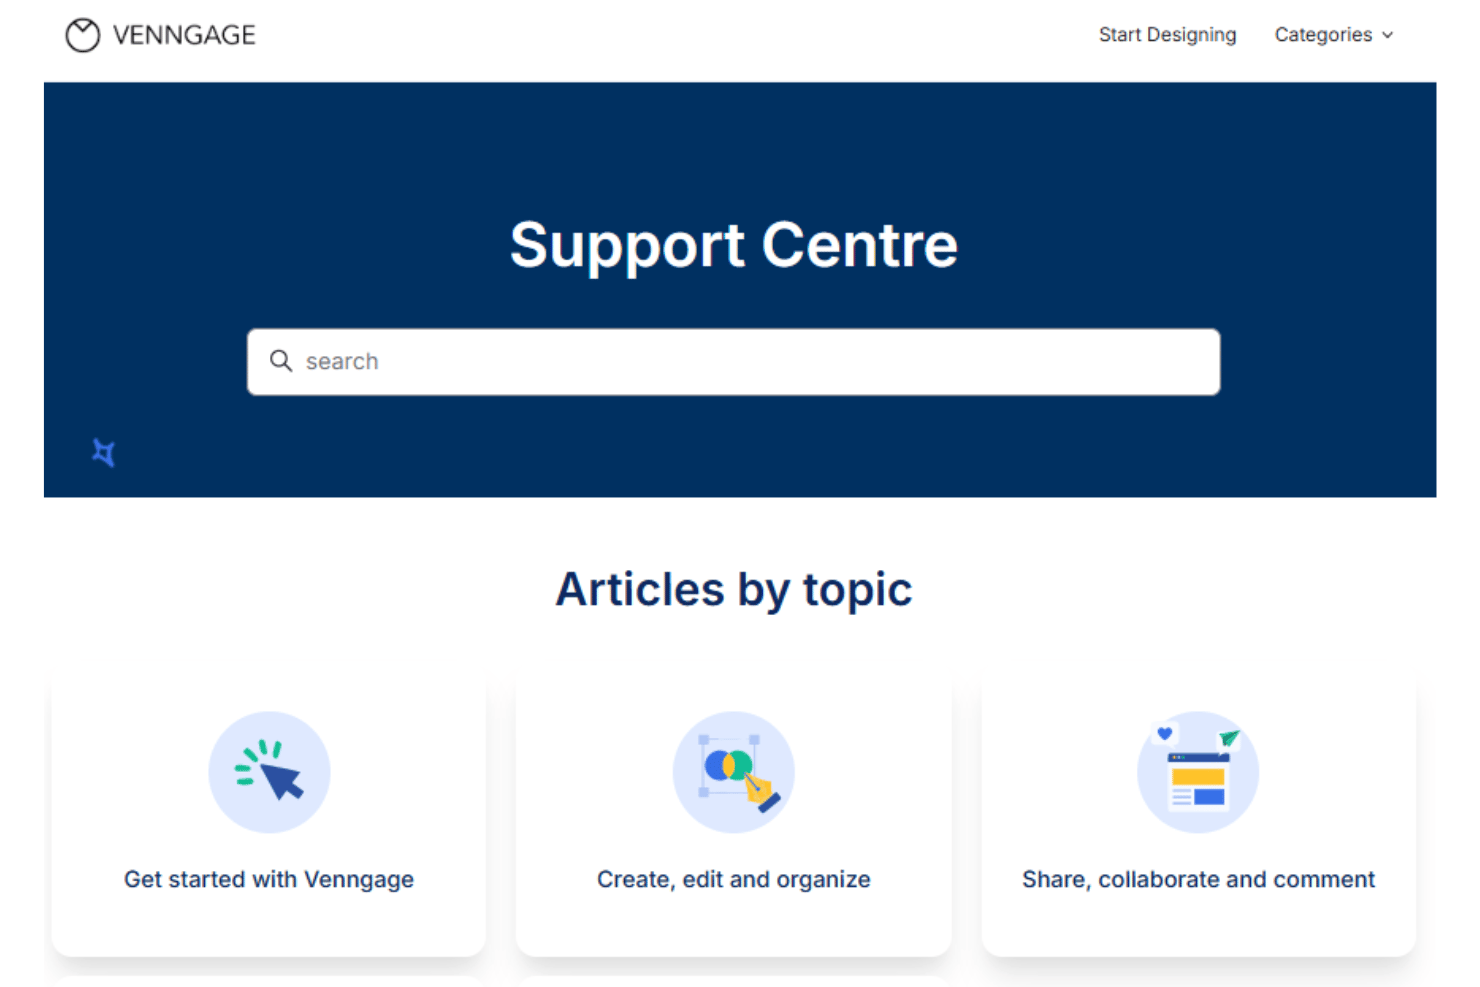
Venngage's customer support stands out for its responsive chat and thorough knowledge base. Users often mention quick resolutions through live chat and appreciate the clear help docs and email response times. Dedicated customer success reps are available on business plans, making it straightforward to get tailored, helpful assistance when needed.
Integrations
Venngage doesn’t currently offer any native integrations, but an API for Enterprise users is available.
Value for Money
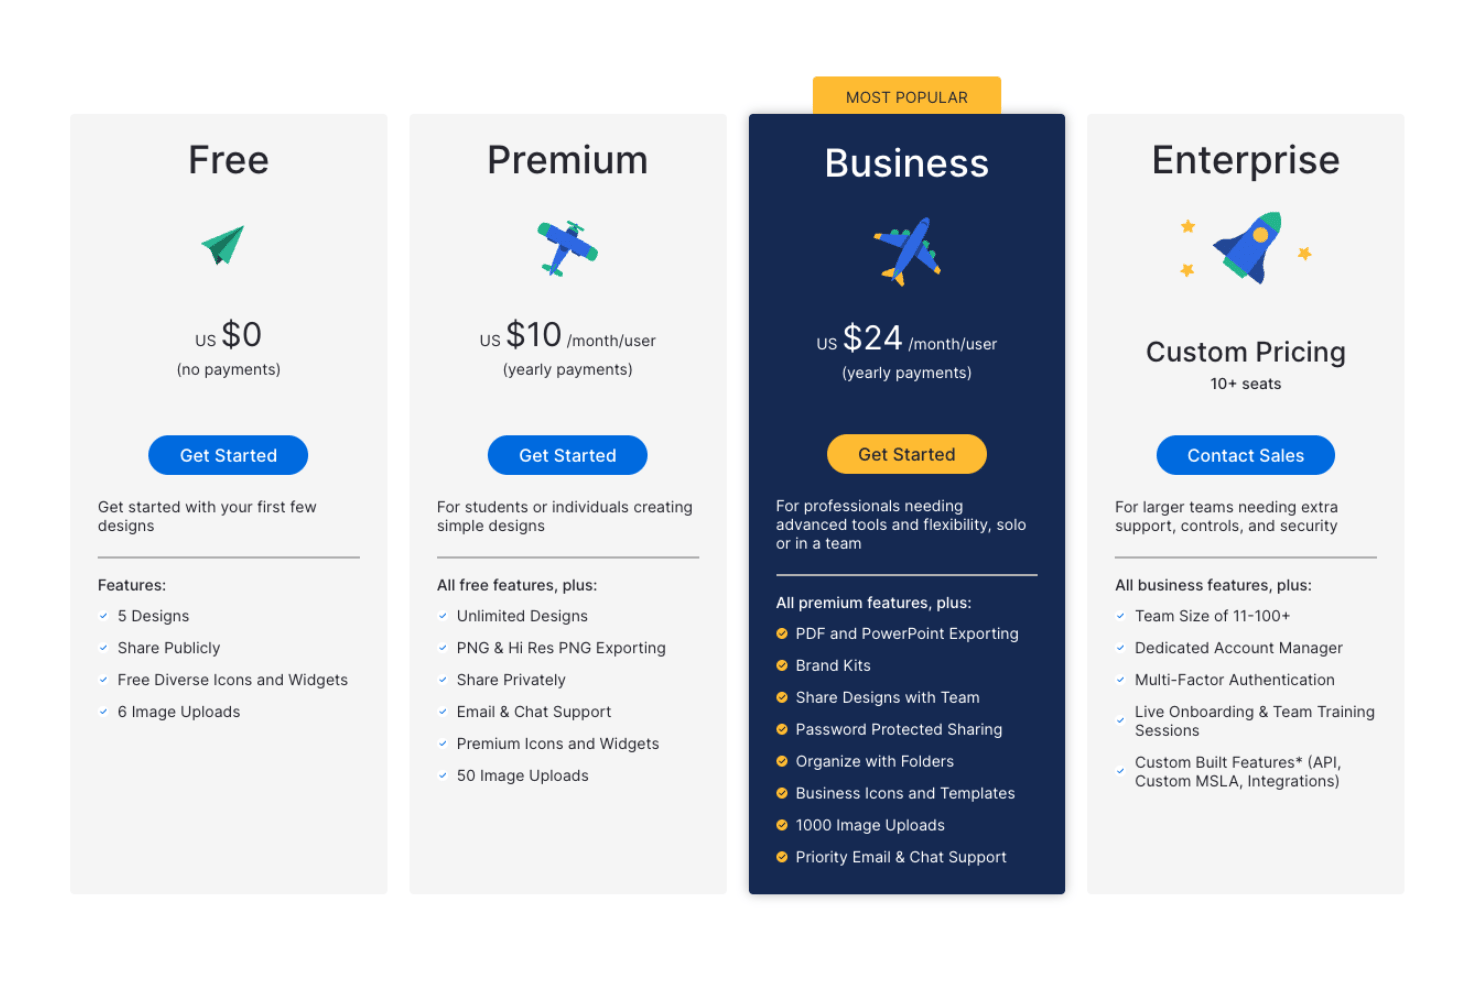
Venngage costs more than basic diagramming tools, but most users feel its templates, export options, and brand customization justify the price for business use. Venngage's depth in data visualization, infographic templates, and generative AI flowchart features gives it an edge for teams with more specialized visual communication needs. The free version is very limited, so paid tiers unlock the functionality needed for serious projects and collaboration.
- Free: Includes basic templates, limited downloads, and branding on exports.
- Premium: Adds unlimited designs, hi-res image exports, and premium icons and widgets.
- Business: Provides PDF exports, brand kits, password protected sharing, and priority support.
- Enterprise: Offers MFA, personalized training, personalized onboarding, and API access.
Venngage Specs
- A/B Testing
- API
- Automated Testing
- Browser Compatibility Testing
- Bug Tracking
- Calendar Management
- CI/CD Integration
- Dashboard
- Data Export
- Data Import
- Data Visualization
- Developer Tools
- External Integrations
- History/Version Control
- Manual Testing
- Multi-User
- Notifications
- Performance Testing
- Regression Testing
- Scheduling
- Status Notifications
- Third-Party Plugins/Add-Ons
Venngage FAQs
How quickly can my team start building and sharing flowcharts with Venngage?
Can I customize flowcharts with my own branding elements?
Is it possible to collaborate with my team in real time on a flowchart?
What export options does Venngage offer for sharing diagrams?
How does Venngage help with data security and compliance?
Does Venngage offer offline desktop editing or on-premise deployment?
What kind of customer support can my team expect?
Can I import data or diagrams from other software into Venngage?
Venngage Company Overview & History
Venngage is a Toronto-based company founded in 2015 and specializes in online graphic design tools for visual communication, including infographics and flowcharts. The company employs a globally distributed team and is independently operated. Venngage is not known to own other products or have affiliations with external parent companies. Its client base includes notable organizations across tech, media, higher education, and non-profit sectors, reflecting broad appeal across diverse industries.
Venngage Major Milestones
- 2015: Venngage is founded in Toronto, Canada.
- 2016: Launch of the flagship online infographic maker tool.
- 2019: Major platform redesign enables broader capabilities for charts, reports, and flowcharts.
- 2020: Achieves over 1 million users; featured in major business and technology publications.
- 2021: Introduction of real-time document collaboration and advanced Brand Kit features.