Le 10 migliori piattaforme online per creare diagrammi di flusso – Recensione 2026

10 Migliori Software per Diagrammi di Flusso: Shortlist


Il software online per diagrammi di flusso ti aiuta a visualizzare processi, sistemi e flussi di lavoro utilizzando forme, connettori e testo. Senza una rappresentazione visiva chiara, i team spesso comunicano male, duplicano attività o saltano passaggi cruciali in un processo. Il software per diagrammi di flusso risolve questi problemi offrendo ai team un diagramma condiviso e di facile comprensione che migliora allineamento e comunicazione.
Con oltre 20 anni di esperienza nella gestione di progetti, ho testato una vasta gamma di strumenti per diagrammi di flusso, dai semplici builder di diagrammi alle piattaforme avanzate con collaborazione in tempo reale e integrazione dei dati. Mi sono concentrato su quanto siano intuitivi, su quanto supportino efficacemente il lavoro di squadra e su quanto bene si integrino negli ambienti di progetto esistenti.
Ecco i migliori strumenti online per creare diagrammi di flusso che ho recensito. Ognuno offre funzionalità distintive per aiutarti a diagrammare con chiarezza, collaborare facilmente e semplificare il tuo flusso di lavoro.
Perché puoi fidarti di noi
Testiamo e recensiamo software di project management dal 2012. Come project manager, sappiamo quanto sia fondamentale (e difficile) fare la scelta giusta quando si seleziona un software. Investiamo molte risorse nella ricerca per aiutare la nostra audience a scegliere meglio. Abbiamo testato più di 2.000 strumenti per diversi casi d’uso e scritto oltre 1.000 recensioni dettagliate. Scopri come restiamo trasparenti & la nostra metodologia di recensione del software.
Tabella Comparativa dei Migliori Software per Diagrammi di Flusso
Qui trovi una tabella per confrontare gli strumenti appena descritti nelle panoramiche.
| Tool | Best For | Trial Info | Price | ||
|---|---|---|---|---|---|
| 1 | Ideale per l'importazione di dati | Prova gratuita | Da $4,95/utente/mese | Website | |
| 2 | Ideale per strumenti di comunicazione integrati | Versione freemium disponibile | A partire da $8/utente/mese | Website | |
| 3 | Ideale per template di diagrammi di flusso | Piano gratuito disponibile | Da $16/mese (fatturazione annuale) | Website | |
| 4 | Ideale per Windows | Prova gratuita | Da $6.40/utente/mese | Website | |
| 5 | Ideale per team aziendali | Prova gratuita | A partire da $5,95/utente/mese | Website | |
| 6 | Il miglior freeware per flowchart facile da usare | Gratuito da usare online | Gratuito | Website | |
| 7 | Ideale per team agili | Not available | Da $4/mese | Website | |
| 8 | Il miglior software di diagrammazione tuttofare | Prova gratuita di 30 giorni | Da $8.25/utente/mese | Website | |
| 9 | Ideale per integrazioni con Confluence e Jira | 14 giorni di prova gratuita | Da $4,99/utente/mese | Website | |
| 10 | Ideale per la collaborazione in tempo reale | 14 giorni di prova gratuita | Da $5/utente/mese | Website |

-

Celoxis
Visit WebsiteThis is an aggregated rating for this tool including ratings from Crozdesk users and ratings from other sites.4.4 -
Accelo
Visit WebsiteThis is an aggregated rating for this tool including ratings from Crozdesk users and ratings from other sites.4.4 -
Wrike
Visit WebsiteThis is an aggregated rating for this tool including ratings from Crozdesk users and ratings from other sites.4.3


Panoramica dei Migliori Software per Diagrammi di Flusso
Ecco una breve descrizione di ciascuno dei software per diagrammi di flusso presenti in questa top 10.
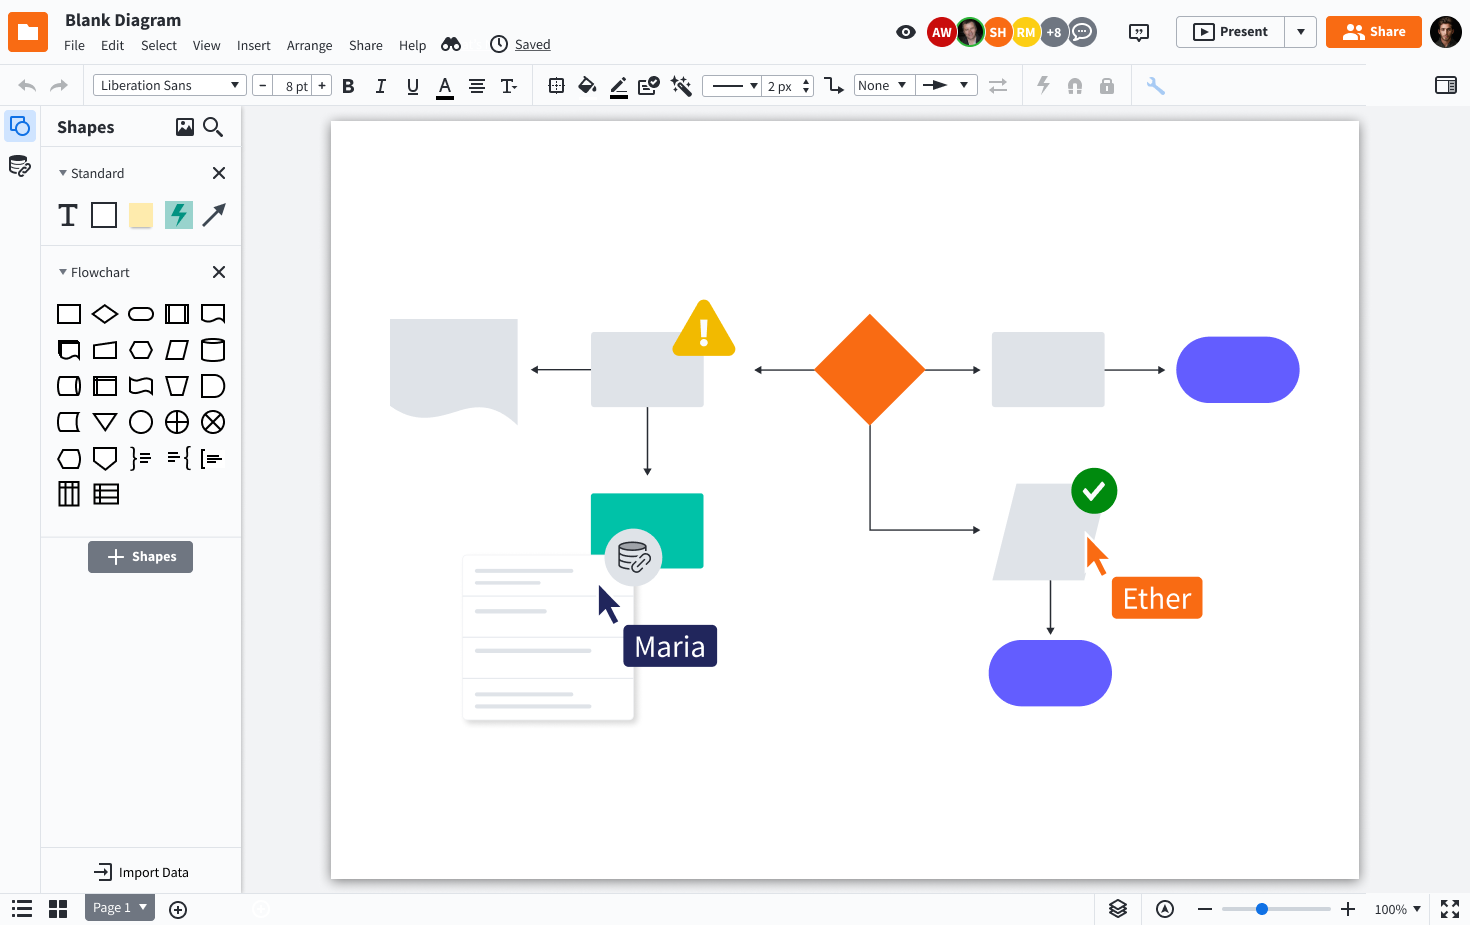
Lucidchart è una piattaforma di diagrammazione online progettata per team nei settori tecnologici, aziendali ed educativi che hanno bisogno di creare, condividere e collaborare su diagrammi di flusso e mappe di processo per chiarire workflow complessi e favorire decisioni migliori.
Per chi è ideale Lucidchart?
Lucidchart è perfetto per team trasversali in aziende di medie e grandi dimensioni che necessitano di uno spazio di lavoro visivo condiviso per mappare processi, sistemi e strutture organizzative.
Perché ho scelto Lucidchart
Ho scelto Lucidchart tra i migliori perché le sue capacità di importazione dati lo distinguono davvero dagli altri strumenti di diagrammi di flusso. È possibile importare dati direttamente da fogli di calcolo o da fonti dati collegate per generare automaticamente i diagrammi, il che significa che il mio team può mappare architetture di sistema complesse o strutture organizzative senza doverle costruire manualmente da zero. Mi piace anche il livello di formattazione condizionale presente: una volta collegati i dati, forme ed etichette si aggiornano automaticamente quando cambiano i dati sottostanti. Questo tipo di connessione in tempo reale tra dati e diagrammi è qualcosa che raramente vedo implementato così bene in altri strumenti.
Funzionalità principali di Lucidchart
- Collaborazione in tempo reale: Più membri del team possono modificare lo stesso diagramma contemporaneamente, con cursori live e commenti direttamente nell'editor.
- Libreria di template: Scegli tra centinaia di modelli predefiniti di diagrammi di flusso e schemi per iniziare rapidamente con il minimo sforzo di configurazione.
- Contenitori intelligenti: Raggruppa e organizza le forme in corsie di nuoto o contenitori strutturati che si adattano automaticamente man mano che aggiungi o sposti elementi.
- Cronologia delle revisioni: Accedi a una cronologia completa delle versioni di ogni diagramma per rivedere, confrontare o ripristinare versioni precedenti.
Integrazioni di Lucidchart
Le integrazioni includono Google Workspace, Microsoft 365, Slack, Jira, Confluence, Dropbox, Box, Zoom, Notion e Smartsheet.
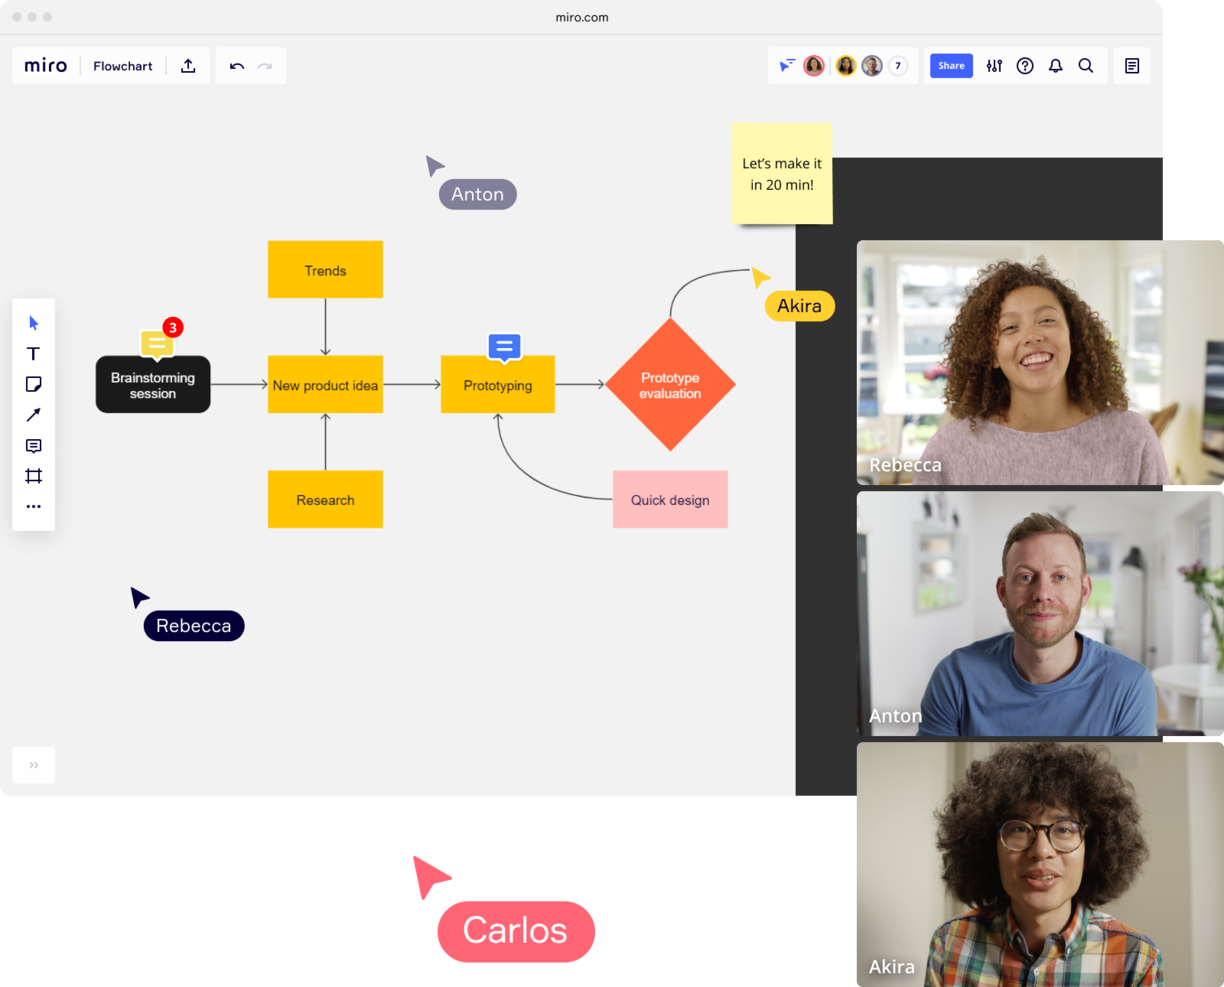
Miro è una piattaforma di lavagna online progettata per team nei settori tecnologico, di prodotto e di design che hanno bisogno di creare, condividere e collaborare su diagrammi di flusso e schemi in tempo reale.
Per Chi è Ideale Miro?
Miro è perfetto per i team trasversali nei reparti prodotto, ingegneria e design che necessitano di uno spazio di lavoro visivo condiviso per mappare flussi e processi.
Perché Ho Scelto Miro
Miro è una delle mie scelte migliori perché adoro come mantiene la comunicazione integrata direttamente nell'area di lavoro dei diagrammi di flusso. Invece di passare a Slack o all'email per discutere un diagramma, il mio team può lasciare commenti in thread direttamente su forme o connettori specifici, menzionare colleghi con @-mention e risolvere i feedback senza mai uscire dalla lavagna. La funzione Talktrack è particolarmente utile—ho registrato walkthrough video di flussi di processo complessi e li ho condivisi in modo asincrono, così i colleghi in diversi fusi orari possono guardare, mettere in pausa e commentare punti precisi del diagramma. Per le sessioni dal vivo, il Timer integrato e gli strumenti di votazione anonima permettono al mio team di condurre workshop strutturati attorno a un diagramma senza dover utilizzare uno strumento di facilitazione separato.
Caratteristiche Principali di Miro
- Modelli di diagrammi di flusso: Scegli tra una libreria di modelli predefiniti di diagrammi di flusso e di processo per iniziare a mappare i flussi di lavoro.
- Diagrammazione intelligente: Usa strumenti di collegamento automatico e allineamento alla griglia per disegnare e disporre forme, connettori e corsie con precisione.
- Canvas infinito: Costruisci diagrammi di flusso di qualsiasi dimensione o complessità su una lavagna espandibile senza limiti di spazio.
- Modalità presentazione: Guida gli stakeholder attraverso un diagramma completato con una presentazione strutturata, frame per frame, direttamente all'interno di Miro.
Integrazioni di Miro
Le integrazioni includono Microsoft Teams, Google Workspace, Jira, Confluence, ServiceNow, GitHub Copilot, OpenAI Codex, Replit, Gemini CLI e Claude Code.
Pros and Cons
Pros:
- Funzionalità di comunicazione integrate per una collaborazione efficiente
- Configurazione intuitiva e semplice
- Piano gratuito per sempre disponibile
Cons:
- La versione gratuita non permette l'esportazione in PDF di alta qualità
- Lo zoom può essere scattoso su progetti molto grandi
- Account visitatore/ospite disponibili solo nei piani a pagamento
New Product Updates from Miro
Miro Adds Japan Data Residency for Enterprise Customers
Miro has introduced Japan data residency for enterprise customers, offering in-region storage for production data, backups, and metadata, plus in-region compute infrastructure. For more information, visit Miro's official site.
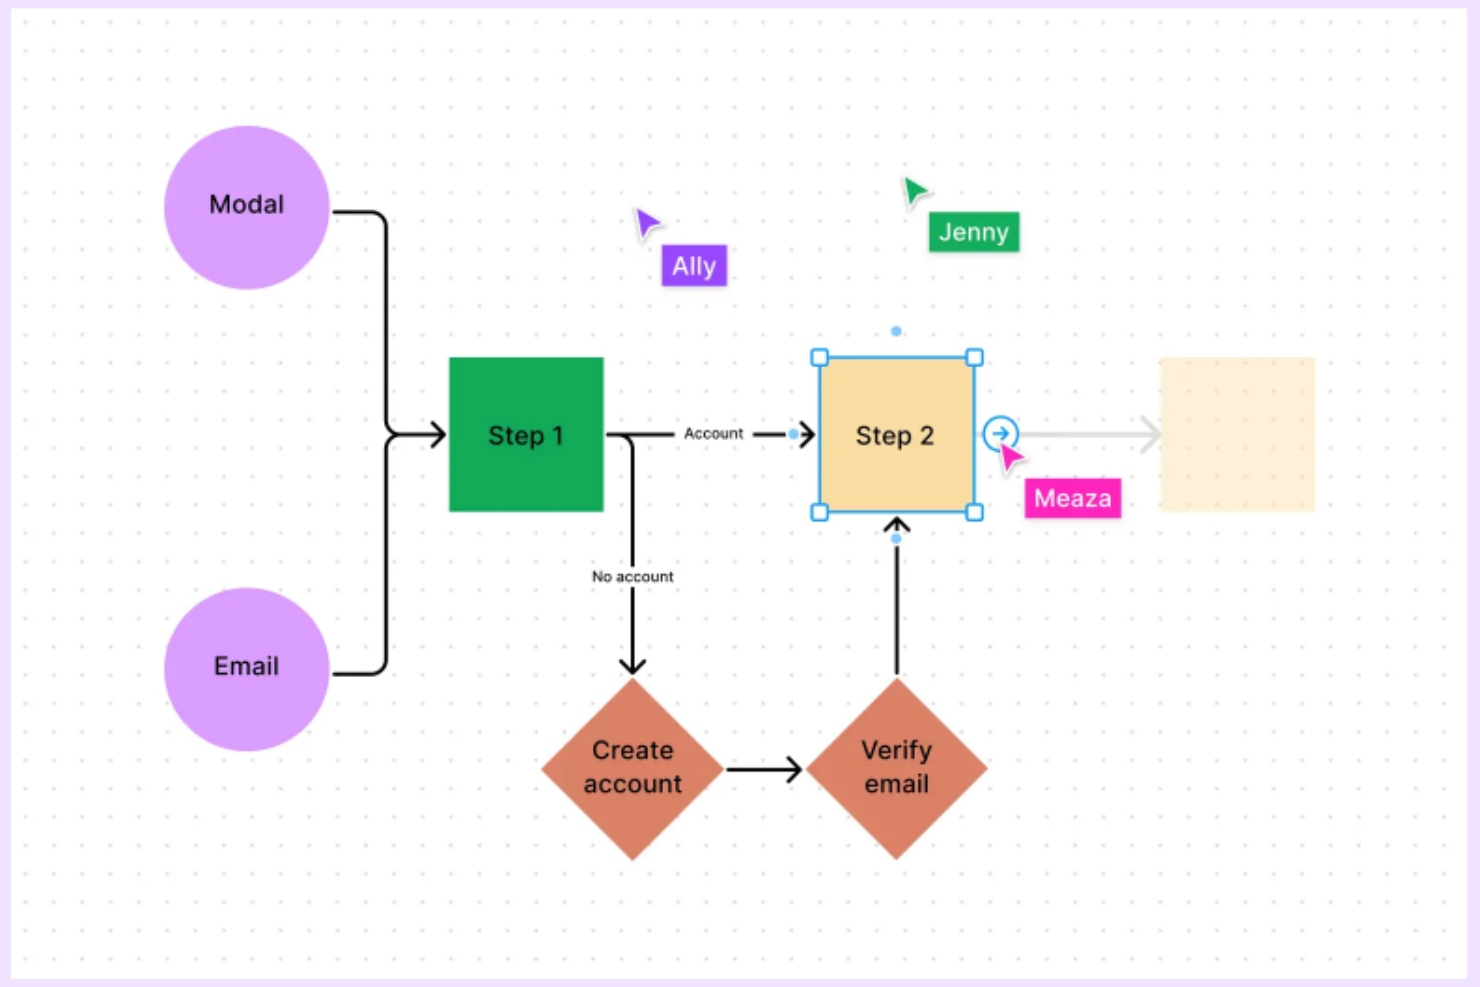
FigJam è una lavagna online pensata per i team che devono creare, modificare e condividere diagrammi di flusso, diventando così la scelta ideale per product manager, designer e team trasversali che vogliono mappare insieme processi e idee.
Per chi è ideale FigJam?
FigJam è perfetto per i team di prodotto e design in aziende tecnologiche che cercano uno spazio condiviso per la collaborazione visiva e la mappatura dei processi.
Perché ho scelto FigJam
FigJam merita un posto nella mia shortlist per l’efficacia della sua libreria di modelli, che permette di creare diagrammi di flusso già pronti all’uso. Mi piace che sia possibile partire subito da un template dedicato e lavorare immediatamente con forme preimpostate, connettori e un sistema di snap alla griglia che mantiene i diagrammi ordinati e allineati. Oltre al template base per diagrammi di flusso, l’intelligenza artificiale di FigJam consente di generare modelli personalizzati a partire da un semplice comando testuale, una funzione che ho trovato utile per mappare processi fuori dagli schemi che non rientrano in un layout generico. La libreria della community offre inoltre altri template, integrando le diverse opzioni già disponibili.
Funzionalità principali di FigJam
- Audio in tempo reale e chat live: Comunica con i colleghi direttamente all’interno della lavagna FigJam tramite audio integrato e chat dal vivo senza dover passare ad altri strumenti.
- Modalità spotlight: Guida i partecipanti di una riunione a concentrarsi su un’area specifica della lavagna durante sessioni live o workshop.
- Ordinamento dei post-it con AI: Raggruppa automaticamente i post-it in temi con un solo clic per organizzare lo spunto creativo di una sessione di brainstorming.
- Accesso ospite: Invita collaboratori esterni a contribuire a un file FigJam per 24 ore senza necessità di creare un account.
Integrazioni FigJam
Le integrazioni includono Asana, Jira e ChatGPT.

Visio è una piattaforma di diagrammazione progettata per professionisti e team che necessitano di creare diagrammi di flusso dettagliati, mappe di processo e organigrammi, diventando così la scelta ideale per le aziende che utilizzano Microsoft 365 e desiderano funzionalità avanzate di diagrammazione online.
Per chi è Visio?
Visio è particolarmente indicato per team aziendali ed esperti IT che già lavorano nell’ecosistema Microsoft 365 e necessitano di uno strumento dedicato alla creazione di diagrammi per flussi di lavoro complessi e documentazione tecnica.
Perché ho scelto Visio
Visio si è guadagnato un posto nella mia lista perché è lo strumento di diagrammazione più maturo creato appositamente per ambienti Windows e l’ecosistema Microsoft 365. Apprezzo il fatto che Visio Plan 2 includa un’app desktop completa con supporto offline, consentendo al mio team di continuare a lavorare su diagrammi di flusso complessi anche senza connessione. La funzione Data Visualizer consente di convertire i dati delle mappe di processo di Excel direttamente in diagrammi Visio, riducendo ricostruzioni manuali. Il supporto a BPMN 2.0 e l’accesso a oltre 250.000 forme lo rendono una soluzione seria per i team che devono documentare processi tecnici su larga scala.
Funzionalità principali di Visio
- Co-autore in tempo reale: Più membri del team possono modificare lo stesso diagramma simultaneamente utilizzando Visio per il web.
- Integrazione con Microsoft Teams: Incorpora e condividi i diagrammi Visio direttamente nei canali Teams per una collaborazione contestuale.
- Modelli di diagramma predefiniti: Scegli tra una libreria di modelli che coprono diagrammi di flusso, di rete, organigrammi e planimetrie.
- Collegamento dati alle forme: Collega metadati alle singole forme per documentare dettagli di processo, proprietà o stato direttamente all’interno di un diagramma.
Integrazioni di Visio
Le integrazioni includono Microsoft Teams, Power BI, Power Automate, Microsoft Excel, Microsoft Word, Microsoft PowerPoint, OneDrive for Business, Microsoft Azure, Microsoft Access e Microsoft SharePoint.

SmartDraw è una piattaforma di diagrammazione online progettata per team e organizzazioni che hanno bisogno di creare, condividere e gestire diagrammi di flusso e di processo su larga scala.
Per chi è SmartDraw?
SmartDraw è particolarmente indicato per team aziendali che necessitano di una gestione centralizzata dei diagrammi, controlli amministrativi e collaborazione trasversale tra diverse funzioni in organizzazioni di grandi dimensioni.
Perché ho scelto SmartDraw
SmartDraw si guadagna un posto tra i migliori nella mia lista per la sua capacità di gestire le esigenze operative delle grandi organizzazioni. Apprezzo la possibilità per gli amministratori IT di fornire utenti tramite SSO e salvare file direttamente su OneDrive, SharePoint o Google Drive, senza la necessità di configurare un sistema di archiviazione separato. Questo tipo di controllo dei dati è fondamentale quando si gestisce la conformità tra decine di team. Trovo anche molto utile il referente dedicato per il supporto enterprise, soprattutto nella fase di onboarding, quando stai migrando file da strumenti come Visio o Lucidchart su larga scala.
Funzionalità principali di SmartDraw
- Generazione di diagrammi di flusso tramite IA: Descrivi un processo in linguaggio naturale e SmartDraw genera automaticamente un diagramma di flusso completamente modificabile come punto di partenza.
- Diagrammi basati su dati: Importa dati da Google Sheets o da un file CSV per popolare i diagrammi di flusso con dettagli reali del processo, come responsabilità e costi.
- Template personalizzati per il team: Crea e salva template standardizzati di diagrammi di flusso che tutto il team può riutilizzare per mantenere coerenza nei progetti.
- Supporto ai diagrammi swimlane: Aggiungi swimlane a qualsiasi diagramma di flusso con un solo clic per mappare processi trasversali tra reparti o ruoli diversi.
Integrazioni SmartDraw
Le integrazioni includono Microsoft OneDrive, Microsoft SharePoint, Google Drive, Dropbox, Box, Google Workspace, Microsoft Teams, Confluence, Jira e Trello.
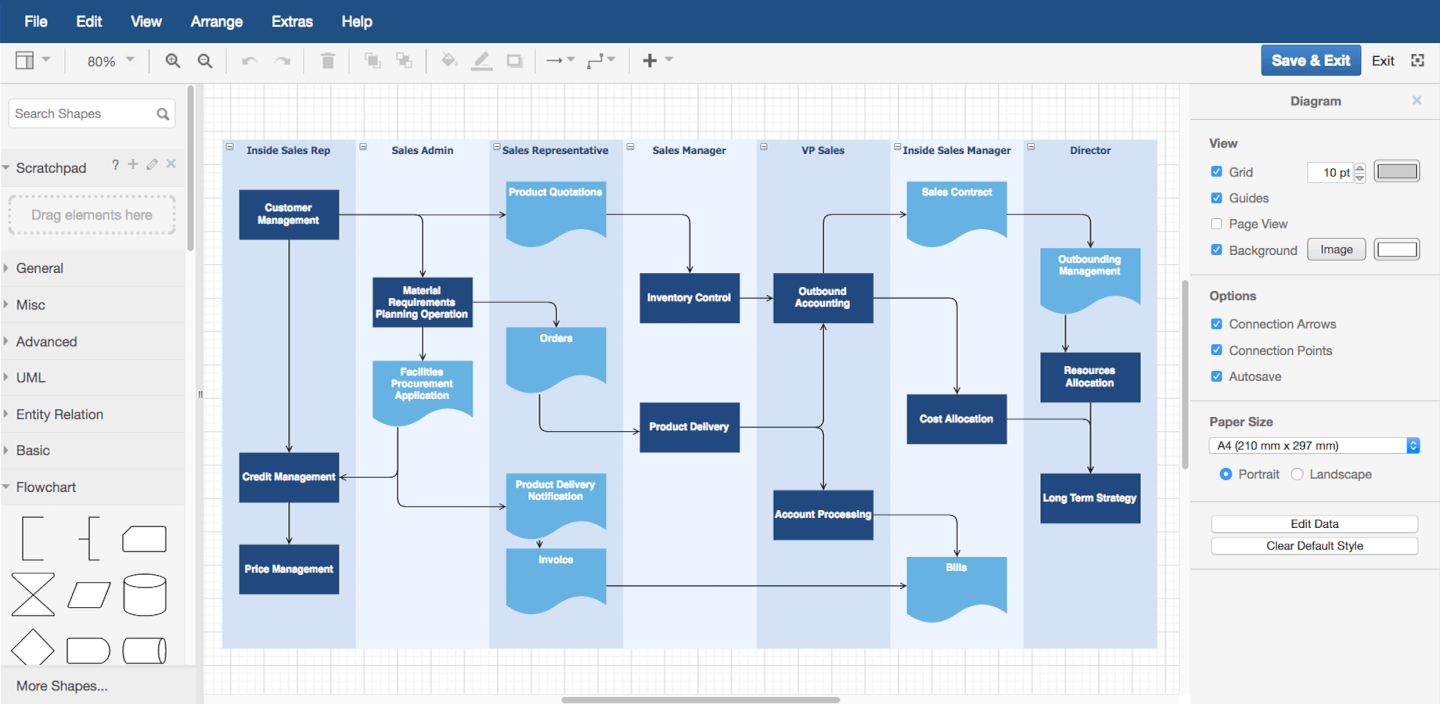
draw.io è uno strumento di diagrammazione basato su browser progettato per team e professionisti che hanno bisogno di creare, modificare e condividere flowchart e diagrammi di processo senza installare software o pagare anticipatamente.
Per chi è più adatto draw.io?
draw.io è una scelta eccellente per collaboratori individuali, piccoli team e organizzazioni attente al budget che necessitano di uno strumento di diagrammazione gratuito senza rinunciare alle funzionalità principali.
Perché ho scelto draw.io
draw.io si guadagna il suo posto tra i migliori della mia lista perché è uno dei pochi strumenti di diagrammazione completamente gratuiti che non lesina sulle funzionalità. Mi piace poter aprire un browser, iniziare a costruire un flowchart con una libreria di forme dedicata e condividerlo con i collaboratori—tutto senza dover creare un account. La generazione di diagrammi alimentata dall’IA è una funzionalità che uso regolarmente: si descrive un processo in testo semplice e draw.io costruisce la struttura iniziale del flowchart, il che fa risparmiare davvero tempo quando si mappano flussi di lavoro complessi da zero. La collaborazione in tempo reale con cursori condivisi consente anche al mio team di modificare insieme lo stesso diagramma contemporaneamente, con le modifiche che si sincronizzano istantaneamente su Google Drive o OneDrive.
Funzionalità principali di draw.io
- Esportazione in più formati: Esporta i diagrammi come file PNG, SVG, PDF, HTML o XML direttamente dal browser.
- Modelli di diagramma: Parti da un modello predefinito per flowchart, organigrammi, diagrammi di rete, UML e altro ancora.
- Strumento di disegno a mano libera: Disegna forme e annotazioni a mano direttamente sulla tela utilizzando la modalità a mano libera integrata.
- Formato file basato su XML: Salva e modifica i diagrammi come file XML aperti, rendendoli portabili e adatti al controllo di versione.
Integrazioni di draw.io
Le integrazioni includono Google Drive, Microsoft OneDrive, Dropbox, GitHub, GitLab, Confluence, Jira, Trello, Notion e SharePoint.
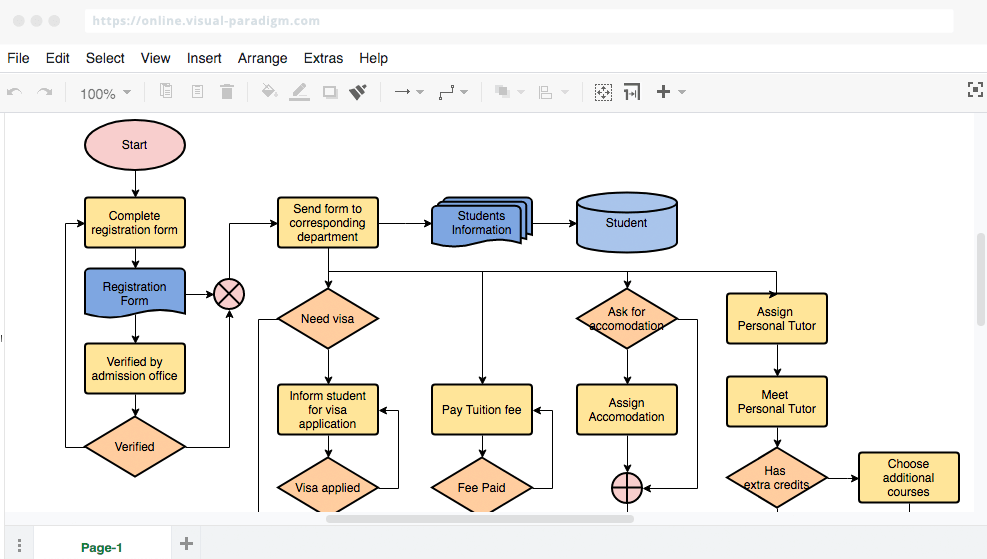
VisualParadigm Online è una piattaforma cloud per la creazione di diagrammi, pensata per team e professionisti che desiderano creare, condividere e collaborare su flowchart e diagrammi di processo per supportare la pianificazione di progetti, la mappatura dei flussi di lavoro e l'analisi aziendale.
Per chi è più indicato VisualParadigm Online?
VisualParadigm Online è adatto a team interfunzionali in ambito tecnologico e sviluppo software che necessitano di uno spazio condiviso per la creazione di diagrammi durante sprint, cicli di pianificazione e revisioni di progetto.
Perché ho scelto VisualParadigm Online
Ho scelto VisualParadigm Online tra i migliori perché supporta in modo eccellente il tipo di lavoro iterativo e visuale che i team agili svolgono durante gli sprint. L’ambiente di lavoro multi-progetto e multi-team consente al mio gruppo di organizzare i diagrammi per progetto, evitando che tutto si confonda in una singola cartella condivisa. Apprezzo anche la possibilità che più membri del team possano modificare contemporaneamente lo stesso diagramma, con sincronizzazione in tempo reale, molto utile quando si sta mappando un user flow a sprint in corso e ci sono opinioni diverse. L’estensione Agilien si collega direttamente a Jira per generare un backlog iniziale del prodotto partendo dai diagrammi, offrendo un collegamento pratico tra pianificazione visiva ed esecuzione dello sprint.
Funzionalità principali di VisualParadigm Online
- Editor di diagrammi drag-and-drop: Costruisci flowchart utilizzando una tela visiva con forme, connettori e strumenti di formattazione predefiniti.
- Libreria di modelli: Parti da una selezione curata di modelli di flowchart e diagrammi di processo per ridurre i tempi di impostazione.
- Opzioni di esportazione e condivisione: Esporta i diagrammi come PNG, SVG o PDF, oppure condividili tramite un link diretto per la revisione degli stakeholder.
- Cronologia delle versioni: Accedi e ripristina versioni precedenti di un diagramma per tracciare le modifiche nel tempo.
Integrazioni di VisualParadigm Online
Le integrazioni includono Jira, Google Drive, Microsoft Word, Microsoft Excel, Microsoft PowerPoint ed è disponibile un’API per integrazioni personalizzate.
Edraw Max offre a team, educatori e professionisti aziendali una piattaforma flessibile per creare diagrammi di flusso e schemi per il mapping dei processi, brainstorming e comunicazione visiva in una vasta gamma di settori.
Per chi è ideale Edraw Max?
Edraw Max si adatta a team nei settori dell'ingegneria, dell'informatica, dell'istruzione e del business che hanno bisogno di un unico strumento per gestire una grande varietà di tipi di diagrammi.
Perché ho scelto Edraw Max
Edraw Max merita un posto nella mia lista ristretta perché copre più tipi di diagrammi rispetto a quasi qualsiasi altro strumento che abbia utilizzato, inclusi diagrammi di flusso, diagrammi UML, disegni P&ID, diagrammi di rete e planimetrie. Mi piace che il mio team possa passare da un diagramma di flusso per una consegna ingegneristica a un organigramma per una presentazione agli stakeholder senza uscire dalla piattaforma. La libreria di oltre 26.000 simboli fa sì che raramente debba cercare la forma giusta, e i più di 1.500 modelli integrati riducono il tempo necessario per passare da una tela bianca a una bozza condivisibile.
Caratteristiche principali di Edraw Max
- Collaborazione in tempo reale: Più membri del team possono modificare e commentare i diagrammi simultaneamente all'interno di uno spazio di lavoro condiviso.
- Supporto multipiattaforma: Edraw Max funziona su Windows, Mac, Linux e browser, così il team può lavorare da qualsiasi dispositivo.
- Opzioni di esportazione e importazione: Esporta i diagrammi in Visio, PDF, PNG, SVG e altro, oppure importa direttamente file Visio esistenti.
- Modalità presentazione: Mostra i diagrammi come una presentazione direttamente all'interno dello strumento senza esportare in un'app di presentazione separata.
Integrazioni di Edraw Max
Non sono elencate integrazioni native.

Gliffy è uno strumento di diagrammazione online progettato per team di tecnologia, prodotto e project management che devono creare, condividere e collaborare su flowchart e diagrammi di processo direttamente all'interno dei loro flussi di lavoro.
Per chi è ideale Gliffy?
Gliffy è perfetto per i team di sviluppo software e prodotto che lavorano dentro strumenti Atlassian come Confluence e Jira.
Perché ho scelto Gliffy
Gliffy merita il suo posto nella mia shortlist grazie all'integrazione profonda con l'ambiente Confluence. Mi piace che i diagrammi creati in Gliffy siano completamente ricercabili tramite la funzione di ricerca di Confluence—così, quando il mio team cerca un processo o sistema specifico, il testo all'interno del diagramma appare insieme ai contenuti delle pagine. Questa è una funzionalità che la maggior parte degli strumenti di diagrammazione semplicemente non offre. Trovo inoltre molto utile l'aggiornamento automatico: basta modificare un diagramma una volta perché tutte le sue copie in tutto lo spazio Confluence vengano aggiornate automaticamente, mantenendo la documentazione sempre coerente senza alcuna correzione manuale. È proprio il tipo di integrazione nativa Atlassian che rende Gliffy una scelta naturale per i team che già vivono in Confluence.
Funzionalità chiave di Gliffy
- Supporto per diagrammi Mermaid: Genera diagrammi entità-relazione, diagrammi UML e altri diagrammi tecnici utilizzando il codice, senza dover posizionare manualmente alcuna forma.
- Livelli interattivi collegati: Costruisci diagrammi con più livelli che gli utenti possono attivare o disattivare direttamente su una pagina Confluence.
- Caricamento dati da CSV: Importa file CSV in Gliffy e trascina i dati direttamente nei tuoi diagrammi senza cambiare strumento.
- Collaborazione in tempo reale: Modifica i diagrammi simultaneamente insieme ai colleghi all'interno di Confluence.
Integrazioni di Gliffy
Le integrazioni includono Confluence, Jira ed è disponibile un'API per integrazioni personalizzate.

Cacoo è uno strumento di diagrammazione basato su cloud progettato per i team di tecnologia, prodotto e design che hanno bisogno di creare, modificare e condividere insieme online diagrammi e flowchart.
Per chi è Cacoo?
Cacoo è adatto a team interfunzionali di tecnologia e prodotto che necessitano di uno spazio condiviso per costruire e iterare diagrammi insieme.
Perché ho scelto Cacoo
Cacoo è una delle mie scelte preferite perché adoro il modo in cui gestisce la modifica dal vivo multiutente su una tela condivisa. Quando il mio team lavora su un flusso di processo, tutti possono modificare contemporaneamente e tenere traccia delle modifiche attraverso la cronologia delle versioni: nessuno deve aspettare il proprio 'turno' per contribuire. Trovo inoltre la modalità di follow davvero utile durante le revisioni dei diagrammi, dove una persona può guidare il resto del team cursore per cursore attraverso un flowchart complesso. Le videochiamate e la chat integrate ci permettono di rimanere sempre all'interno del diagramma, senza dover passare da Cacoo a un altro strumento di meeting.
Caratteristiche principali di Cacoo
- Template e libreria di forme: Scegli da una libreria predefinita di forme e modelli per costruire flowchart, wireframe, diagrammi di rete e altro ancora.
- Canvas infinito: Espandi lo spazio di lavoro in qualsiasi direzione man mano che il diagramma cresce, senza limiti prestabiliti sulla lavagna.
- Modalità presentazione: Trasforma qualsiasi diagramma in una presentazione e mostrala direttamente da Cacoo senza passare a un altro strumento.
- Opzioni di esportazione e incorporamento: Esporta diagrammi come PNG, PDF o SVG, oppure incorporali direttamente in siti web e wiki.
Integrazioni di Cacoo
Le integrazioni includono Backlog, Google Drive, Google Docs, Atlassian Confluence, AWS, Adobe Creative Cloud, Slack, Dropbox, Box e Microsoft OneDrive.
Altre Opzioni di Software per Diagrammi di Flusso
Ecco alcune alternative che non hanno raggiunto la top list. Se cerchi altri suggerimenti su software per diagrammi di processo, dai un’occhiata qui.
- ConceptDraw Diagram
Ideale per l’acquisto con licenza una tantum
- Terrastruct
Ideale per lo sviluppo software
- Creately
Miglior software gratuito per diagrammi di flusso


Come Valuto i Software per Diagrammi di Flusso
Divido la mia valutazione in requisiti di base—come la capacità effettiva di uno strumento di costruire diagrammi swimlane o mappare alberi decisionali—e i fattori distintivi che differenziano un'opzione dall'altra.
Funzionalità Principali (Requisiti Indispensabili per Questa Lista)
Quando seleziono gli strumenti per la mia lista, assegno a ciascuno un punteggio da 0 (funzionalità non presente) a 5 (eccellenza in quest'area) per ogni funzionalità principale elencata di seguito. Poi calcolo il punteggio totale dello strumento in percentuale. Ogni strumento deve ottenere un punteggio totale minimo del 65% per essere preso in considerazione.
- Canvas per la Realizzazione di Diagrammi con Drag-and-Drop: Valuto quanto sia fluido costruire e riorganizzare i nodi—come ristrutturare un flusso di lavoro sprint—con connettori intelligenti e allineamento automatico.
- Libreria di Forme per Diagrammi di Flusso: Verifico la presenza dei simboli standard per i diagrammi di flusso, inclusi diamanti decisionali e swimlane, dato che la mappatura dei passaggi tra funzioni richiede una corretta notazione.
- Template e Preimpostazioni: Un buon assortimento di modelli rilevanti per il project management è importante—come workflow di approvazione, alberi decisionali e mappe dei processi di rilascio che fanno risparmiare tempo nella configurazione.
- Collaborazione in Tempo Reale: Controllo se i membri del team distribuiti possono co-modificare un diagramma dal vivo, lasciare commenti su nodi specifici e vedere i cursori degli altri.
- Opzioni di Esportazione e Condivisione: La possibilità di esportare in PNG, PDF o SVG e condividere tramite link è essenziale per integrare diagrammi in briefing di progetto o presentazioni di revisione sprint.
- Integrazioni con Strumenti PM: Valuto le integrazioni nativamente offerte con piattaforme come Jira, Confluence, Asana e Microsoft Teams affinché i diagrammi di flusso vivano dove il lavoro di progetto si svolge già.
Una volta che ho una lista di strumenti che rispondono ai criteri, considero ciò che differenzia ogni piattaforma.
Fattori Distintivi (Cosa Distingue i Fornitori)
Ecco come confronto i diversi fornitori:
Funzionalità di Spicco
Il diagramming basato su intelligenza artificiale è un grande elemento distintivo. Cerco strumenti che possano generare un diagramma di flusso partendo da un prompt testuale, accelerando la mappatura dei processi nelle prime fasi del progetto. Il controllo delle versioni è altrettanto importante, soprattutto quando più PM lavorano su uno stesso diagramma durante vari cicli sprint. Valuto anche se uno strumento supporta diagrammi collegati ai dati, in cui le forme si aggiornano sulla base di dati di progetto in tempo reale. In questo modo una mappa di processo statica diventa qualcosa che gli stakeholder consultano effettivamente tra una revisione e l'altra.
Oltre le Funzionalità
La struttura dei prezzi è una delle prime cose che valuto. Alcuni strumenti offrono generosi piani gratuiti adatti ai PM individuali, mentre altri limitano la collaborazione ai soli piani enterprise—quindi verifico dove effettivamente inizia l'accesso a livello di team. Anche la velocità di onboarding è importante. Se un business analyst non riesce a costruire una mappa di processo utilizzabile già dalla prima sessione, l'adozione su larga scala nei team di progetto si blocca. Per i PMO che gestiscono più squadre, valuto i controlli di amministrazione come librerie centralizzate di template e permessi basati sui ruoli, così da mantenere i diagrammi coerenti e l'accesso sicuro anche su larga scala.
Come Scegliere un Software per Diagrammi di Flusso
È facile perdersi tra lunghe liste di funzionalità e strutture di prezzo complesse. Per aiutarti a restare focalizzato durante il tuo percorso di selezione del software, ecco un elenco di fattori da considerare:
| Fattore | Cosa Considerare |
|---|---|
| Scalabilità | Assicurati che il software possa crescere insieme al tuo team. Cerca soluzioni che supportino un numero crescente di utenti e diagrammi più complessi man mano che i tuoi progetti si espandono. |
| Integrazioni | Verifica se il software si integra con gli strumenti già in uso dal tuo team, come Slack, Google Drive o Trello, per aumentare l'efficienza dei flussi di lavoro. |
| Personalizzazione | Valuta quanto puoi adattare il software alle tue esigenze. Scegli modelli personalizzabili e opzioni di diagrammazione flessibili adatte a diversi progetti. |
| Facilità d'Uso | Valuta quanto l'interfaccia sia intuitiva. Il tuo team dovrebbe poter utilizzare lo strumento velocemente senza formazione estesa o una curva di apprendimento ripida. |
| Budget | Confronta i piani tariffari e assicurati che il costo sia in linea con il tuo budget. Considera quali funzionalità sono incluse nei diversi livelli di prezzo per evitare costi imprevisti. |
| Sicurezza | Assicurati che il software offra solide misure di sicurezza come la crittografia dei dati e controlli di accesso sicuri per proteggere le tue informazioni sensibili. |
| Collaborazione | Prediligi funzionalità che supportano la collaborazione in tempo reale, così che il tuo team possa lavorare insieme efficacemente, ovunque si trovi. |
| Assistenza | Valuta la disponibilità e la qualità del supporto clienti. Cerca risorse come chat live, tutorial e un centro assistenza ben fornito. |
Tendenze nei Software per Diagrammi di Flusso
Nelle mie ricerche, ho raccolto innumerevoli aggiornamenti di prodotto, comunicati stampa e log delle versioni da diversi fornitori di software per diagrammi di flusso. Ecco alcune delle tendenze emergenti che sto seguendo con attenzione:
- Miglioramenti nella collaborazione in tempo reale: Sempre più strumenti si concentrano sul miglioramento delle funzionalità di collaborazione in tempo reale, permettendo ai team di lavorare insieme in modo più efficace. Funzionalità come la chat integrata e gli aggiornamenti live aiutano i team a rimanere allineati, e fornitori come Lucidchart e Miro sono in prima linea in questo settore.
- Creazione di diagrammi assistita dall'IA: Alcuni strumenti stanno iniziando a integrare l'intelligenza artificiale per assistere nella creazione dei diagrammi. Questo velocizza il processo di progettazione suggerendo layout e collegamenti. Le funzionalità di IA stanno diventando un elemento fondamentale nei moderni strumenti di diagrammazione per aumentare la produttività.
- Diagrammi interattivi e dinamici: C'è una tendenza crescente verso diagrammi interattivi che rispondono all'input degli utenti. Questo include funzionalità come elementi cliccabili e formattazione condizionale, che rendono i diagrammi più coinvolgenti e informativi.
- Attenzione alla privacy dei dati degli utenti: Con l'aumento delle preoccupazioni legate alla sicurezza dei dati, i fornitori stanno rafforzando le misure di privacy. Questo include una migliore crittografia e la conformità a regolamenti come il GDPR, assicurando la protezione dei dati degli utenti.
- Maggiori opzioni di personalizzazione: Gli utenti richiedono un maggiore controllo su aspetto e funzionalità dei loro diagrammi. I fornitori stanno rispondendo offrendo più opzioni di personalizzazione, come modelli regolabili e stili personalizzati, per soddisfare le diverse esigenze degli utenti.
Che cos'è un software per diagrammi di flusso online?
Il software per diagrammi di flusso online è uno strumento basato su cloud che ti permette di creare e condividere diagrammi di flusso direttamente dal browser. Puoi utilizzarlo per mappare processi, visualizzare sistemi e collaborare con altri in tempo reale, senza bisogno di download o installazioni.
È molto utilizzato da project manager, analisti e team remoti che hanno bisogno di un modo semplice per creare diagrammi e mantenere tutti allineati ovunque si trovino.
Funzionalità del software per diagrammi di flusso
Quando scegli un software per diagrammi di flusso, presta attenzione alle seguenti funzionalità chiave:
- Collaborazione in tempo reale: Consente a più utenti di lavorare contemporaneamente sullo stesso diagramma, migliorando la comunicazione e l'efficienza del team.
- Creazione di diagrammi assistita dall'IA: Utilizza l'intelligenza artificiale per suggerire layout e connessioni, accelerando il processo di progettazione e riducendo il lavoro manuale.
- Diagrammi interattivi: Permette agli utenti di creare diagrammi che rispondono agli input, rendendoli più coinvolgenti e informativi.
- Controllo delle versioni: Fornisce un modo per tracciare le modifiche e tornare a versioni precedenti, garantendo accuratezza e coerenza nei diagrammi.
- Modelli personalizzabili: Offre modelli preconfigurati che possono essere adattati alle esigenze specifiche dei progetti, risparmiando tempo e fatica.
- Gestione dei livelli nei diagrammi: Permette agli utenti di aggiungere più livelli ai diagrammi, facilitando la gestione e la comprensione di sistemi complessi.
- Crittografia dei dati: Garantisce che tutti i dati all'interno del software siano crittografati in modo sicuro, proteggendo le informazioni sensibili da accessi non autorizzati.
- Opzioni di esportazione: Fornisce diversi formati per esportare i diagrammi, consentendo agli utenti di condividere facilmente il proprio lavoro su diverse piattaforme.
- Chat integrata: Facilita la comunicazione diretta tra i membri del team all'interno dello strumento di diagrammazione, migliorando la collaborazione.
- Simulazione di scenari: Permette agli utenti di simulare diversi scenari all'interno dei diagrammi, aiutando i team ad anticipare e affrontare eventuali problemi.
Vantaggi del software per diagrammi di flusso
L'implementazione di un software per diagrammi di flusso offre numerosi vantaggi per il tuo team e la tua azienda. Ecco alcuni aspetti positivi a cui puoi guardare:
- Comunicazione migliorata: Le funzionalità di collaborazione in tempo reale e la chat integrata aiutano il team a rimanere connesso e allineato sui progetti.
- Maggiore efficienza: La creazione di diagrammi assistita dall'intelligenza artificiale velocizza il processo, riducendo il tempo dedicato a compiti manuali e permettendo di concentrarsi su attività più importanti.
- Miglior capacità di problem solving: La simulazione di scenari e i diagrammi interattivi offrono insight su eventuali problematiche, aiutando il team ad affrontarle in modo proattivo.
- Maggiore flessibilità: Modelli personalizzabili e diagrammi a livelli permettono di adattare le soluzioni alle diverse esigenze progettuali, facilitando l'adattamento ai cambiamenti.
- Maggiore sicurezza: La crittografia dei dati garantisce che le informazioni sensibili restino protette, offrendo serenità sulla privacy dei dati.
- Condivisione facilitata: Le opzioni di esportazione in vari formati rendono semplice la distribuzione dei diagrammi su diverse piattaforme e presso diversi stakeholder.
- Tracciabilità accurata: Il controllo delle versioni ti permette di monitorare le modifiche e mantenere la coerenza, assicurando che tutti siano aggiornati.
Costi e prezzi per i software di creazione di diagrammi di flusso
I prezzi generalmente aumentano con l'aggiunta di più funzionalità, opzioni di scalabilità e assistenza al tuo piano. Ecco le fasce di prezzo più comuni e cosa includono, così puoi farti un'idea di quanto potrebbe costarti un software per diagrammi di flusso.
Tabella di confronto per i software di creazione di diagrammi di flusso
| Tipo di piano | Prezzo medio | Funzionalità comuni incluse | Migliore per |
|---|---|---|---|
| Opzione gratuita | $0 | Strumenti base per la creazione di diagrammi e la mappatura dei flussi di lavoro, modelli limitati, una piccola quantità di spazio di archiviazione cloud, opzioni limitate per l'esportazione dei diagrammi di flusso | Startup più piccole, singoli utenti, studenti |
| Base | $5 - $10/mese | Funzionalità più avanzate per i diagrammi di flusso, accesso a una libreria di modelli, spazio cloud aggiuntivo, integrazioni di base con altri strumenti software | Piccole imprese, o piccoli team all'interno di una grande azienda |
| Standard | $10 - $25/mese | Tutte le opzioni sopra, più un numero maggiore di membri del team, più spazio cloud, maggiori opzioni per l'esportazione dei diagrammi di flusso, più possibilità di integrazione | Aziende di medie dimensioni, o reparti all'interno di una grande azienda |
| Premium | $25 - $75/mese | Tutte le opzioni sopra, più la possibilità di aggiungere più (o illimitati) membri del team, spazio cloud aggiuntivo | Grandi aziende in cui tutti hanno bisogno di accesso |
| Enterprise | Prezzo personalizzato | Tutte le opzioni sopra, più funzioni di personalizzazione aggiuntive per integrazione, sicurezza e modalità di distribuzione (ad es. on-premise) | Grandi aziende e/o imprese con requisiti rigidi in materia di sicurezza e conformità |