10 Meilleurs Outils de BI Pour de Meilleures Décisions en 2026

10 Meilleure sélection d’outils BI


Les outils de business intelligence aident les équipes à transformer des données brutes en informations décisionnelles, en consolidant l’information, en visualisant les tendances et en favorisant une prise de décision plus intelligente. Que vous suiviez des KPIs, analysiez le comportement client ou réalisiez des prévisions de revenus, le bon outil BI peut révéler des tendances favorisant la croissance et améliorer la performance dans l’ensemble de votre organisation.
Pour vous aider à choisir la bonne plateforme, j’ai testé et passé en revue les principaux outils de business intelligence selon leurs capacités d’intégration des données, leurs fonctionnalités de tableaux de bord, leur facilité d’utilisation et leur évolutivité. Ce guide présente les meilleurs outils BI disponibles en 2026 afin que vous puissiez trouver celui qui correspond aux besoins de votre équipe et favorise la prise de décisions stratégiques.
Qu’est-ce qu’un outil de business intelligence ?
Les outils de business intelligence sont des applications logicielles qui collectent, analysent et visualisent les données pour aider les organisations à prendre des décisions éclairées, basées sur les données.
Ils consolident l’information provenant de sources comme les bases de données, tableurs et services cloud dans des tableaux de bord et rapports interactifs. Avec des fonctionnalités comme l’analyse en temps réel, la visualisation de données et le reporting, les outils BI transforment les données brutes en informations décisionnelles pour les équipes de tous les départements.
Pourquoi vous pouvez nous faire confiance
Nous testons et évaluons des logiciels de gestion de projet depuis 2012. En tant que chefs de projet, nous savons à quel point il est difficile et pourtant essentiel de faire le bon choix lors de la sélection d’un outil. Nous investissons dans la recherche approfondie pour aider notre audience à faire de meilleurs achats logiciels. Nous avons testé plus de 2 000 outils pour différents cas d’utilisation en gestion de projet et rédigé plus de 1 000 analyses complètes. Découvrez comment nous restons transparents & notre méthodologie d’évaluation des logiciels.
Tableau comparatif des meilleurs outils de business intelligence
Vous pouvez utiliser le tableau suivant pour trouver l’outil BI qui correspond à vos besoins :
| Tool | Best For | Trial Info | Price | ||
|---|---|---|---|---|---|
| 1 | Idéal pour la cartographie des parcours multi-canaux en temps réel | Offre gratuite + démo gratuite disponible | Tarification sur demande | Website | |
| 2 | Meilleur outil d’informatique décisionnelle pour les petites entreprises | Essai gratuit de 15 jours | À partir de 24 $/mois pour 2 utilisateurs | Website | |
| 3 | Idéal pour intégrer plus de 150 sources de données | Essai gratuit de 14 jours + démo gratuite disponible | À partir de $44/mois (facturé annuellement) | Website | |
| 4 | Idéal pour l'intégration des données dans les feuilles de calcul | Plan gratuit + démo gratuite disponible | À partir de 49$/mois (facturé annuellement) | Website | |
| 5 | Meilleur outil de business intelligence pour les entreprises | Essai gratuit de 14 jours | À partir de 70 $/utilisateur/mois | Website | |
| 6 | Meilleur outil de reporting BI pour bases de données | Démo gratuite | Tarification personnalisée | Website | |
| 7 | Idéal pour partager des analyses avec des portails fournisseurs externes | Essai gratuit de 30 jours + démo gratuite disponible | Tarification disponible sur demande | Website | |
| 8 | Meilleure API d’intelligence décisionnelle pour intégrer de l’analytique dans vos produits et outils | Essai gratuit | Tarification sur mesure | Website | |
| 9 | Idéal pour créer et intégrer des tableaux de bord dans vos applications | 5 jours d'essai gratuit | À partir de $79/utilisateur/mois | Website | |
| 10 | Idéal pour l'intégration Jira et les vues personnalisées | Plan gratuit disponible | À partir de 18 $/utilisateur/mois | Website |
-

Smartsheet
Visit WebsiteThis is an aggregated rating for this tool including ratings from Crozdesk users and ratings from other sites.4.5 -
Accelo
Visit WebsiteThis is an aggregated rating for this tool including ratings from Crozdesk users and ratings from other sites.4.4 -
Celoxis
Visit WebsiteThis is an aggregated rating for this tool including ratings from Crozdesk users and ratings from other sites.4.4


Aperçus des meilleurs outils de business intelligence
Voici un aperçu des meilleurs outils BI disponibles actuellement sur le marché :
Idéal pour la cartographie des parcours multi-canaux en temps réel
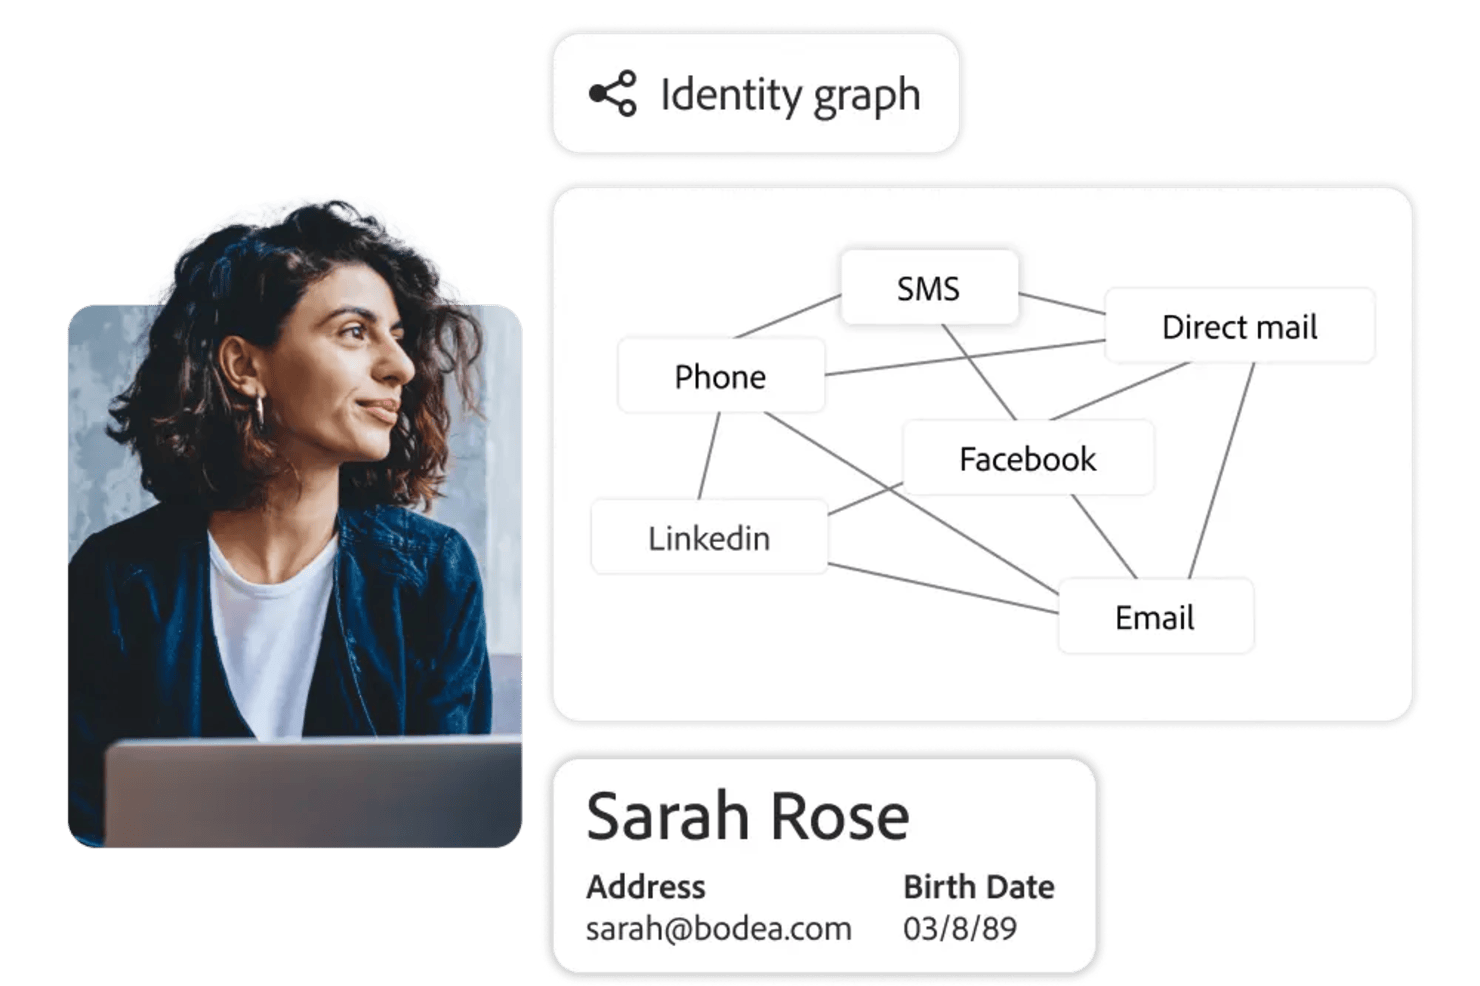
Adobe Customer Journey Analytics est un outil d’intelligence d’affaires qui vous permet d’analyser et de visualiser les parcours clients sur plusieurs canaux à l’aide de données en temps réel, de tableaux de bord personnalisables et de fonctionnalités analytiques avancées.
Pour qui Adobe Customer Journey Analytics est-il le mieux adapté ?
Les équipes marketing et analytiques des grandes entreprises qui doivent analyser des parcours clients complexes et multi-canaux.
Pourquoi j’ai choisi Adobe Customer Journey Analytics
J’ai choisi Adobe Customer Journey Analytics parmi les meilleurs, car je peux modéliser les parcours clients à travers les canaux web, mobile et hors ligne en temps réel. J’utilise son analyse visuelle des flux pour voir comment les utilisateurs naviguent entre les différents points de contact et pour identifier instantanément les zones d’abandon. Mon équipe s’appuie sur son modèle de données unifié pour fusionner des données issues de multiples sources, de sorte que nous ayons toujours une vue globale de l’expérience client.
Principales fonctionnalités d’Adobe Customer Journey Analytics
- Tableaux de bord personnalisables : Créez des tableaux de bord interactifs pour visualiser et partager les indicateurs clés avec votre équipe.
- Segmentation avancée : Constituez des segments d’audiences granulaires selon le comportement, les données démographiques ou des critères personnalisés.
- Rapports programmés : Automatisez la livraison des rapports aux parties prenantes à une périodicité définie.
- Connecteurs de données : Importez et unifiez les données provenant de CRM, du commerce en ligne et d’autres systèmes externes.
Intégrations d’Adobe Customer Journey Analytics
Adobe Customer Journey Analytics propose des intégrations natives avec Adobe Experience Platform, Adobe Analytics, Adobe Target, Adobe Audience Manager et Adobe Campaign. Il offre aussi une API pour des intégrations personnalisées et prend en charge les connexions à des sources de données externes via les connecteurs d’Adobe Experience Platform.
Pros and Cons
Pros:
- Détection d’anomalies et analyse des causes racines grâce à l’IA
- Intégration poussée avec Adobe Experience Platform
- Métriques calculées flexibles et vues personnalisées des données
Cons:
- Peu d’intégrations natives en dehors des produits Adobe
- Certaines fonctionnalités avancées peuvent nécessiter une expertise technique
Meilleur outil d’informatique décisionnelle pour les petites entreprises
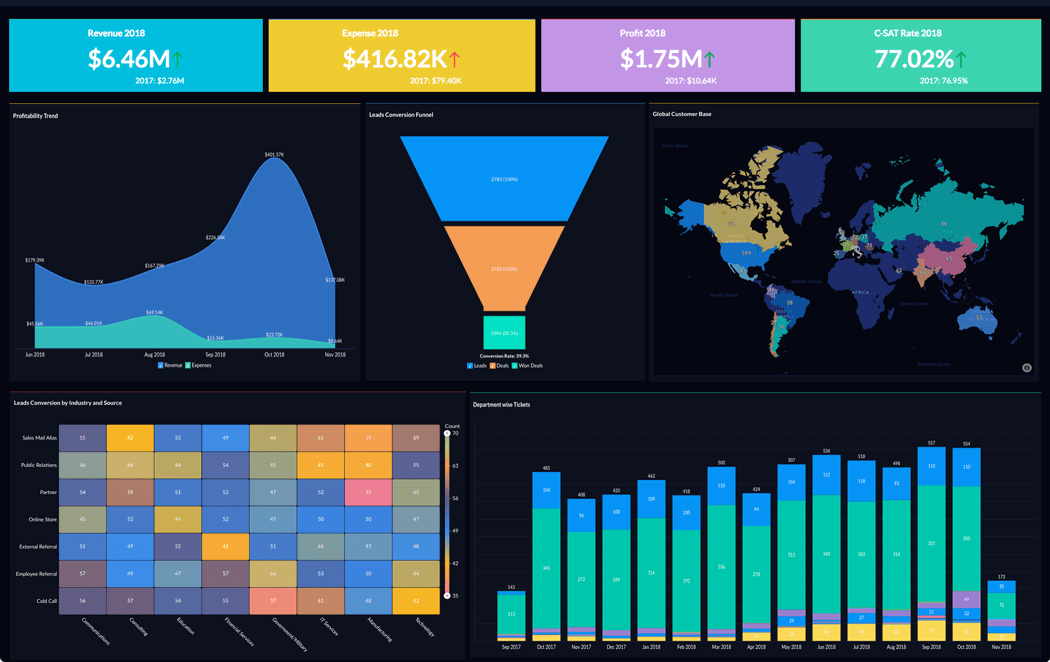
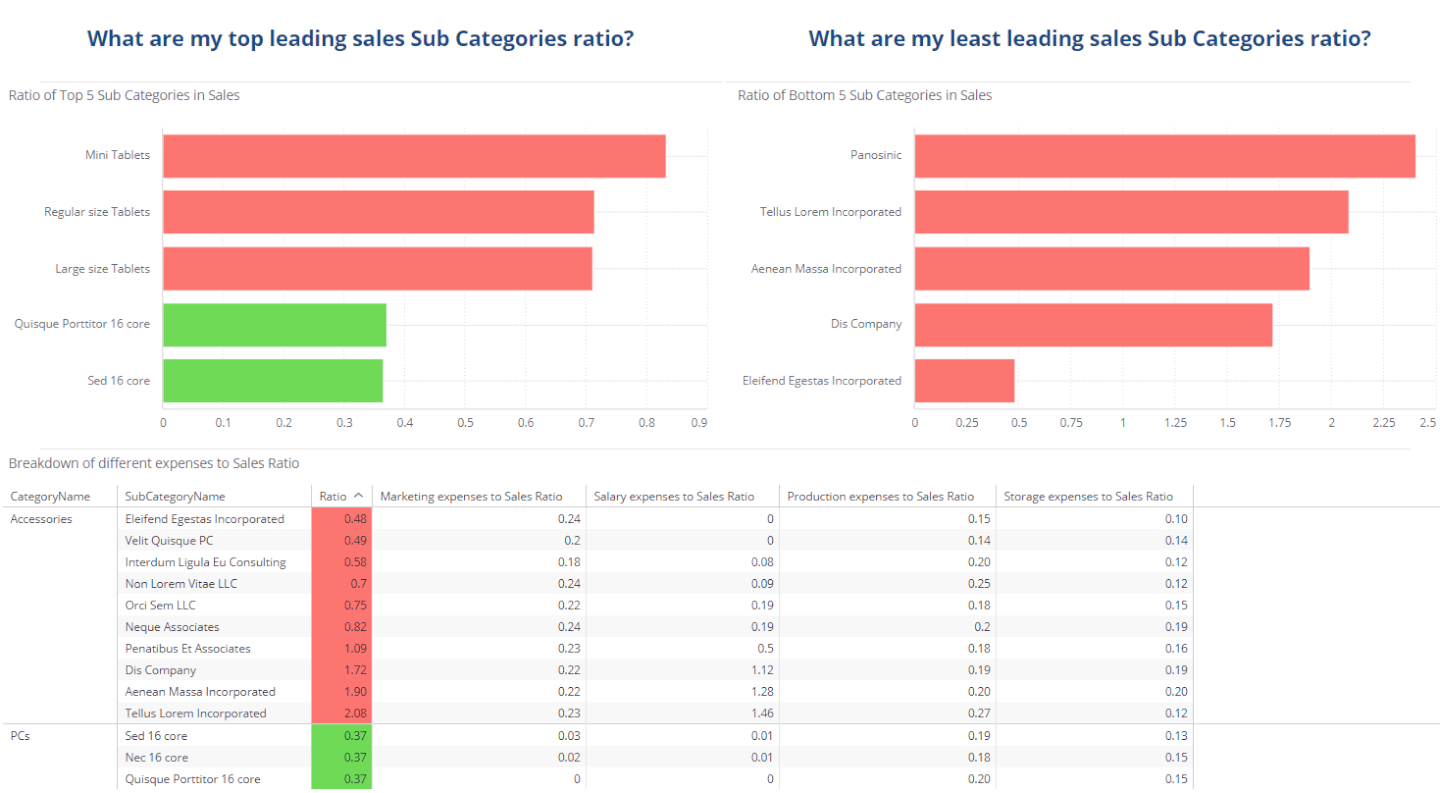
Zoho Analytics est un excellent outil d’informatique décisionnelle pour les petites entreprises, grâce à son large éventail de fonctionnalités, son interface simple et ses tarifs abordables pour un petit nombre d’utilisateurs. Pour un voyagiste gérant 17 circuits de plusieurs jours, Zoho Analytics s’est révélé inestimable : « J’ai utilisé Zoho Analytics pour suivre les performances des guides, les évaluations des clients et la logistique des voyages sur nos 17 circuits de plusieurs jours. Zoho Analytics m’a aidé à révéler les tendances du comportement des clients et le déroulement des voyages dans les zones rurales. Cela nous a permis de réduire les heures supplémentaires en surveillant les inefficacités que nous ne pouvions pas repérer sur des feuilles de calcul. »
Cet outil vous permet d’extraire des données à partir d’une large gamme de sources et de créer des rapports intuitifs et fonctionnels pour analyser les données visualisées. L’assistant IA « Zia » répondra aux questions saisies dans une boîte de requête en utilisant les données collectées, combinées aux technologies d’apprentissage automatique et de traitement du langage naturel.
Zoho Analytics remporte la palme de mon favori en matière de fonctionnalités et de convivialité. Bien que la plupart des logiciels examinés ici bénéficient d’un système d’informatique décisionnelle solide, Zoho va plus loin avec des fonctionnalités comme leur assistant IA, l’accent mis sur la facilité de collaboration, de nombreuses options d’intégration tierces, ainsi que des applications mobiles Android et iOS.
Quelques inconvénients mineurs pour Zoho : les tutoriels SQL pourraient être un peu mieux développés. De plus, les vues ou synthèses de tableaux croisés dynamiques bénéficieraient de l’ajout d’une commande « OU » ou « CONTIENT » afin de mieux extraire les données dont vous avez besoin.
Ils proposent des intégrations avec Zoho Analytics, Salesforce CRM, Microsoft Dynamics CRM, Hubspot CRM, Mailchimp, Google Analytics, Bing Ads, Zoho Surveys, Survey Monkey, Facebook, Twitter, YouTube, QuickBooks, Xero, Shopify, Zendesk, et bien plus encore.
Zoho Analytics commence à partir de 24 $/mois pour 2 utilisateurs et propose un essai gratuit de 15 jours.

Supermetrics est un puissant outil d’intégration de données qui simplifie la collecte et l’analyse des données marketing, ce qui en fait une ressource essentielle pour l’intelligence d’affaires (BI). En permettant aux utilisateurs d’agréger des données provenant de plus de 150 sources différentes, y compris des plateformes majeures telles que Google Ads, Facebook Ads et LinkedIn Ads, Supermetrics garantit aux entreprises la possibilité de rassembler des ensembles de données complets afin de prendre des décisions plus éclairées. Par exemple, Baris Zeren, PDG de Bookyourdata, a expliqué à quel point la plateforme a été déterminante pour son équipe : « Supermetrics a facilité la création de rapports car il regroupe automatiquement les données marketing et de ventes dans un seul tableau de bord. Sa particularité réside dans le fait qu’il a permis à l'équipe d’économiser plusieurs heures par semaine et nous a fourni une vision cohérente et régulière de l’efficacité des campagnes. »
L’une des caractéristiques marquantes de Supermetrics en tant qu’outil de BI réside dans ses capacités d’automatisation. Les utilisateurs peuvent configurer des transferts de données automatisés, garantissant que leurs rapports soient toujours alimentés avec les dernières données sans intervention manuelle. Cette automatisation s’étend à la planification des importations régulières de données,
Supermetrics propose également des options robustes de transformation de données. Les utilisateurs peuvent filtrer, combiner et modifier les données avant qu’elles n’atteignent leur destination finale, ce qui permet la création de rapports personnalisés répondant à des besoins spécifiques de l’entreprise. Ces capacités de transformation sont essentielles pour la BI, car elles permettent aux entreprises d’adapter leurs données afin de révéler des informations et des tendances précises. La compatibilité de l’outil avec les principales plateformes de BI telles que Google Data Studio et Power BI renforce encore son utilité, permettant des visualisations et analyses de données avancées.
De plus, Supermetrics prend en charge un large éventail d’intégrations avec diverses plateformes marketing et commerciales telles que Google Analytics, HubSpot, Shopify et Salesforce, garantissant que toutes les données pertinentes puissent être réunies dans une source unique de référence.
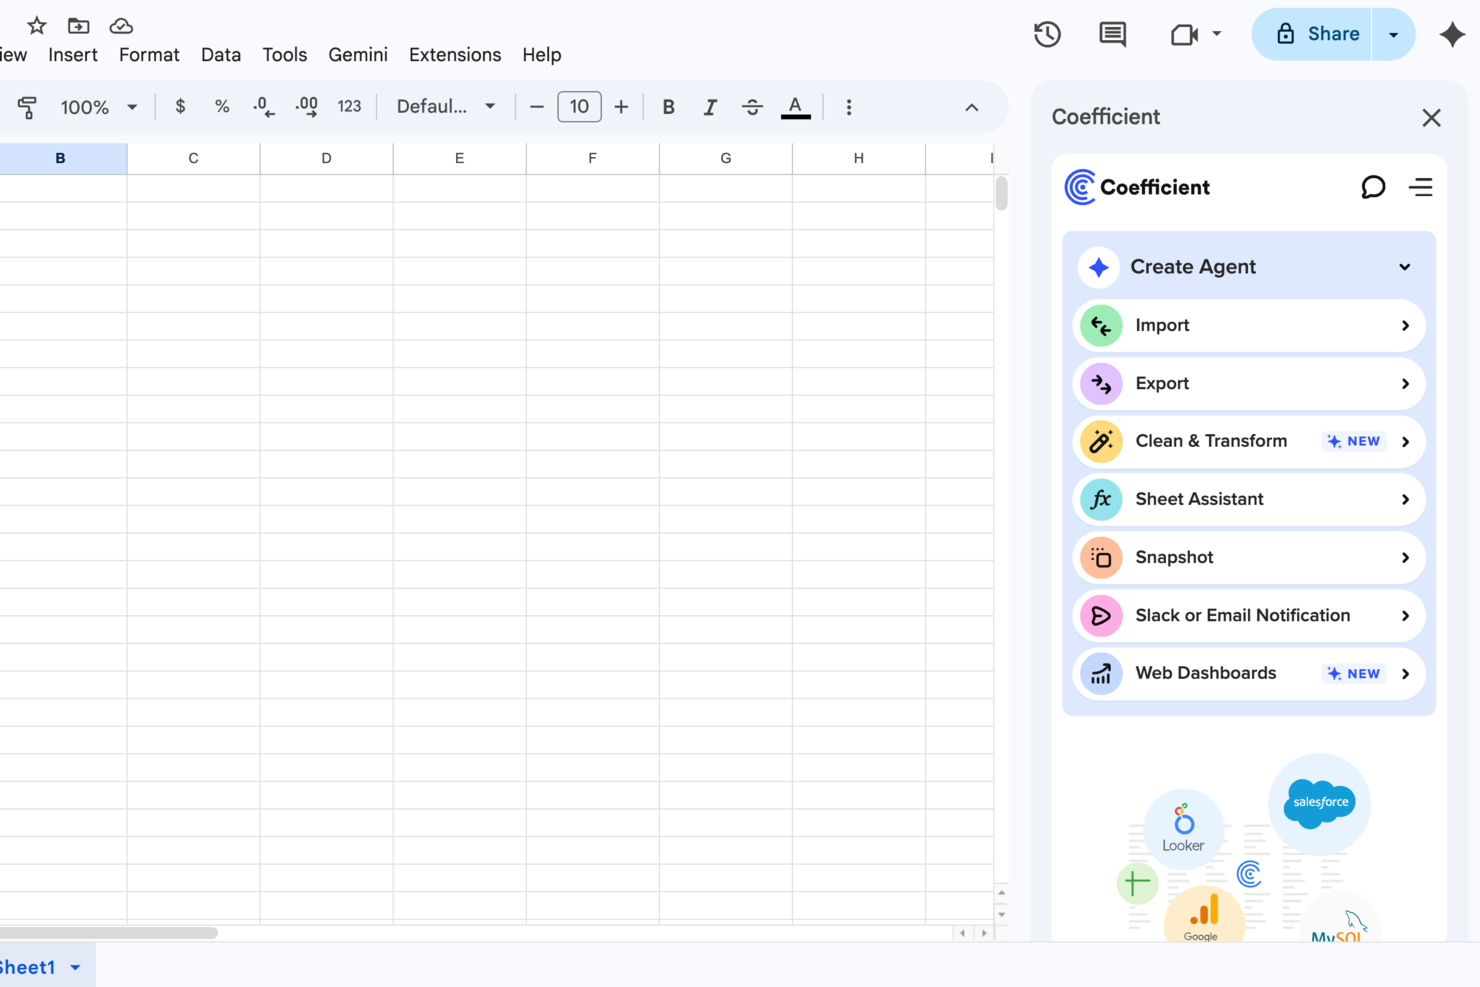
Pour les entreprises désireuses de tirer parti de la puissance des données sans la complexité des outils de BI traditionnels, Coefficient offre une alternative rafraîchissante. Conçu pour s'intégrer facilement aux plateformes comme Google Sheets et Excel, il séduit les professionnels des opérations commerciales, du marketing, de la finance et de l'analyse. En simplifiant la collecte des données et la création de rapports grâce à des fonctionnalités alimentées par l'IA, Coefficient relève le défi de rendre la prise de décisions basée sur les données accessible à tous, quel que soit le niveau de compétence technique.
Pourquoi j'ai choisi Coefficient
J'ai choisi Coefficient parce qu'il transforme votre manière d'interagir avec les données en intégrant plus de 100 sources de données directement dans les feuilles de calcul. Cette capacité unique vous permet de créer des tableaux de bord en direct et de générer des analyses sans compétences techniques avancées. De plus, des fonctionnalités comme le générateur de requêtes SQL et les tableaux de bord pré-construits permettent à votre équipe de visualiser les données en temps réel, facilitant ainsi la prise de décisions éclairées. En automatisant l'enrichissement des données et la création de rapports, Coefficient réduit efficacement le temps consacré aux tâches manuelles, vous permettant de vous concentrer sur des initiatives stratégiques.
Principales fonctionnalités de Coefficient
En plus de ses intégrations impressionnantes, j'ai également relevé plusieurs autres caractéristiques qui distinguent Coefficient :
- Agent d'importation : Cette fonctionnalité vous permet de connecter diverses sources de données et d'intégrer des données en direct dans vos feuilles de calcul sans saisie manuelle.
- Agent API : Vous pouvez créer des connecteurs personnalisés pour vous intégrer à des sources de données uniques, afin de répondre à vos besoins métier spécifiques.
- Agent navigateur : Cet outil permet le web scraping directement depuis votre navigateur, vous permettant de collecter et d'analyser facilement des données issues du web.
- Alertes automatisées : Restez informé grâce à des mises à jour en temps réel via Slack ou e-mail afin de garantir que votre équipe soit toujours au courant des changements de données critiques.
Intégrations Coefficient
Les intégrations incluent Salesforce, QuickBooks, Snowflake, HubSpot, MySQL, Redshift, NetSuite, et bien d'autres. Une API est également disponible pour des intégrations personnalisées.
Pros and Cons
Pros:
- Synchronisation des données en temps réel
- Interface sans code pour les utilisateurs non techniques
- Environnement natif de feuille de calcul
Cons:
- Visualisation limitée aux feuilles de calcul
- Fonctionnalités hors ligne limitées

Tableau est une plateforme d'analytique puissante et évolutive disponible en version bureau, cloud ou sur site. Elle se distingue par son style d’analyse visuelle et interactive et permet de consulter vos données en toute sécurité via un navigateur, un ordinateur de bureau, un mobile ou intégrée dans n’importe quelle application. Plus de 900 ressources d’apprentissage sont proposées, dont plus de 100 vidéos de formation. Pour Gianluca Ferruggia, Directeur Général chez DesignRush, l’impact de Tableau a été immédiat : « Tableau a transformé nos données brutes en récits graphiques ; ses tableaux de bord par glisser-déposer ont révolutionné notre façon de travailler en nous dévoilant des tendances que nos feuilles de calcul dissimulaient. »
Tableau excelle particulièrement dans un domaine des critères d’évaluation des fonctionnalités : la flexibilité. Il est aisément évolutif ; proposé sur serveur, sur poste de travail et/ou dans le cloud ; disponible sur tous types d’appareils, que ce soit PC ou smartphone ; et propose des ressources analytiques gratuites pour les étudiants, les enseignants et les petites organisations à but non lucratif. Quel que soit votre secteur, vous trouverez forcément une solution adaptée.
Tableau peut se connecter à des systèmes de collecte de données comme ServiceNow, Splunk et Google Analytics. D’autres intégrations, ou « Partenaires Technologiques » comme ils les appellent, incluent 0xdata, AIMMS, Aircloak, AllSight, Amazon Web Services, Astera, Axiomatics, Birst, Datawatch,
Element Analytics, Google Cloud Platform, IBM, Microsoft et bien d’autres encore.
La tarification est plutôt élevée au départ et les coûts augmentent à la fin du contrat annuel. Les contrats pluriannuels ne sont pas proposés, ce qui justifie la moins bonne note dans notre section du rapport qualité/prix à cause d’une politique tarifaire élevée et variable, parfois perçue comme agressive.
Tableau commence à partir de 70 $/utilisateur/mois et propose un essai gratuit de 14 jours.

Créez des rapports faciles à lire et des tableaux de bord interactifs axés sur la visualisation qui affichent des informations riches en données, exploitables pour définir des indicateurs métiers, localiser la valeur et découvrir les interconnexions entre les tables. Les ressources et fonctionnalités incluent des applications personnalisées, des visualisations intégrées, des workflows de science des données, la possibilité d'héberger sur des Clouds publics (comme AWS et GCP), et plus encore. Pour Amit Chandak, Chief Analytics Officer chez Kanerika Inc, Looker s’est révélé être une solution puissante face aux défis de données des clients : « Nous avons utilisé Looker pour fournir des informations fiables et en temps réel à un client qui luttait avec des données fragmentées — une fois mis en œuvre, la vitesse de création de rapports a augmenté de 50 % et la prise de décisions a été considérablement accélérée grâce à des tableaux de bord clairs et exploitables. »
Ils proposent une formation interactive gratuite ainsi que de nombreuses autres ressources de type tutoriel, ce qui explique pourquoi j’ai pu leur attribuer une note aussi élevée dans la section convivialité des critères d’évaluation. Sous l’onglet « Pour commencer », vous remarquerez qu’ils disposent de nombreuses ressources d’auto-assistance pour consulter les données brutes, construire des outils et développer des modèles.
Le point faible de ce logiciel est que la rédaction des requêtes n’est pas d’une grande convivialité. De plus, les tâches d’analyse de données prennent un temps non négligeable pour s’exécuter et rendre les requêtes. Lorsqu’il s’agit de Big Data, il peut devenir lent.
Ils se connectent à des bases de données comme Redshift, Snowflake, BigQuery ainsi qu'à plus de 50 dialectes SQL pris en charge comme Amazon Redshift, Google BigQuery, Snowflake, MySQL, Oracle, Amazon Athena, Amazon Aurora, et bien d’autres.
Looker commence à 3 000 $/mois pour 10 utilisateurs (50 $/utilisateur supplémentaire) et propose une démo gratuite.
Domo
Idéal pour partager des analyses avec des portails fournisseurs externes
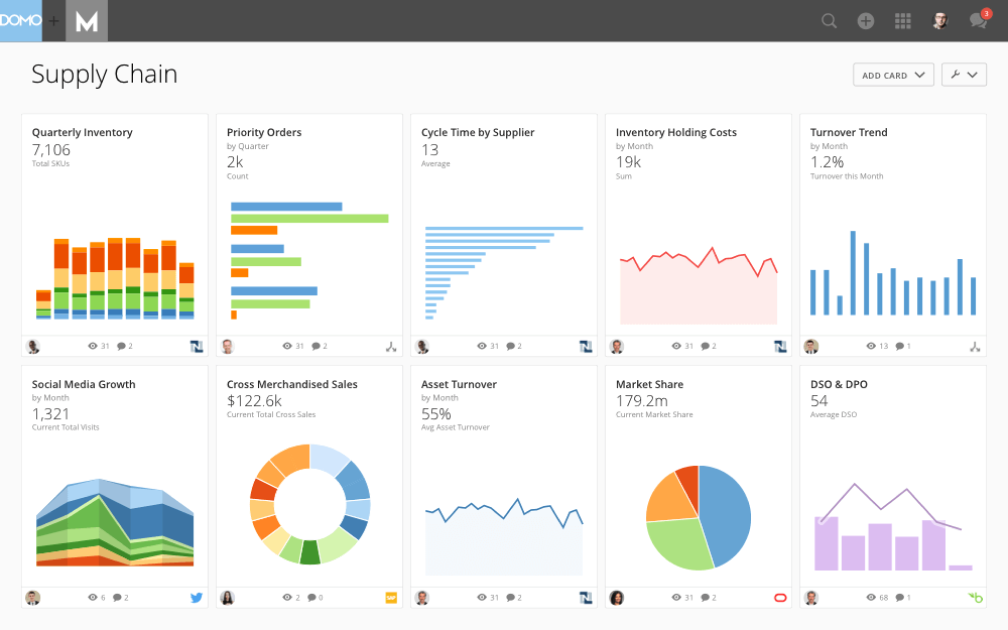
Le Domo Business Cloud est une plateforme qui vous permet d’agréger des données provenant de plusieurs sources et de créer des applications de workflow personnalisées. Ses fonctionnalités incluent des tableaux de bord et des rapports, l’apprentissage automatique, l’analytique prédictive et le reporting en libre-service externe. Pour de nombreuses organisations, la capacité de Domo à intervenir là où d’autres outils sont insuffisants représente un avantage majeur. Nicola Leiper, directrice et responsable de la gestion de projet chez Espresso Translations, a partagé son expérience : « Excel a planté et Domo a sauvé notre relation client la plus importante. Domo n’a pas seulement organisé nos données mais a également sauvé notre réputation et mis en évidence certaines parties de nos opérations qui étaient sous-performantes et nous coûtaient des milliers. »
J’apprécie l’attention que porte Domo à vos relations externes avec les fournisseurs et autres parties prenantes. Cette fonctionnalité s’appelle Domo Everywhere, et elle vous permet de créer des portails pour vos partenaires externes. Ainsi, ils peuvent analyser eux-mêmes les données que vous choisissez de partager avec eux et en tirer leurs propres conclusions.
De plus, les tableaux de visualisation de données sont des widgets indépendants qui peuvent être modifiés, filtrés et redimensionnés en quelques clics. Enfin, la plateforme permet de définir des autorisations aussi bien pour les utilisateurs internes qu’externes, quel que soit le compte (Domo ou non Domo).
Domo s’intègre à des sources de données externes par le biais de plus de 1 000 connecteurs pré-construits, incluant Shopify, Salesforce, Amazon S3, Adobe Analytics, Sharepoint et Survey Monkey.
Domo propose un essai gratuit, et les tarifs peuvent être communiqués sur demande.
Sisense
Meilleure API d’intelligence décisionnelle pour intégrer de l’analytique dans vos produits et outils
Une plateforme hybride cloud conçue pour exploiter l’ensemble de vos données et les rendre accessibles via des tableaux de bord interactifs, des analyses en libre-service et/ou des applications BI en marque blanche. Elle propose assistance, analyses et rapports pour des domaines tels que le suivi du service client, le marketing digital, les finances, les ressources humaines, le commerce de détail et l’e-commerce, l’analyse informatique, et bien d’autres encore.
Concernant nos attentes en matière de convivialité et de critères d’évaluation de l’interface utilisateur, j’ai trouvé que Sisense est facile à utiliser, à installer et à configurer, avec une interface intuitive et une expérience utilisateur fluide. L’équipe du service client est réactive et sait s’adapter, ce qui en fait un choix pertinent pour les entreprises ayant un niveau technologique moindre et qui pourraient nécessiter une assistance supplémentaire.
Quelques inconvénients : le connecteur marketing pourrait être plus complet. De plus, certaines fonctions sont tellement simplifiées qu’elles compliquent la tâche, par exemple, le fait de ne pas avoir à écrire de requête semble un gain de temps, jusqu’à ce que vos besoins ne correspondent plus aux données préexistantes et qu’il faille alors user d’ingéniosité pour trouver une solution adaptée.
Utilisez ODBC pour vous connecter directement au puissant back-end de Sisense depuis n’importe quelle application tierce de votre choix, d’Excel aux outils populaires de visualisation et de reporting. Ils proposent également une place de marché d’extensions et de plug-ins, fournis par eux-mêmes ou leurs partenaires. Certains sont gratuits, d’autres accessibles uniquement via un compte premium.
Sisense propose des tarifs sur mesure et offre une démo gratuite ainsi qu’un essai gratuit.
ClicData
Idéal pour créer et intégrer des tableaux de bord dans vos applications

ClicData est une plateforme d'agrégation de données avec plus de 250 connecteurs. Cela vous permet de réunir des données provenant de toute l'entreprise. Ensuite, un entrepôt de données stocke ces informations et les rend disponibles pour que vous puissiez concevoir des tableaux de bord en temps réel.
La dernière étape consiste à concevoir votre tableau de bord. Le concepteur de tableaux de bord de ClicData propose une fonctionnalité de glisser-déposer qui facilite la création de vos visualisations de données. Ajoutez des éléments tels que des annotations, des jauges, des cartes, de l'audio, des tableaux et tout type de graphique que vous souhaitez. Après cela, vous pouvez intégrer vos graphiques sur un site web, un portail ou un ERP en utilisant son API.
Bien que la plateforme ne propose aucune intégration préconçue prête à l'emploi, son API est disponible pour que votre équipe informatique puisse le faire. L'API permet aux logiciels intégrés d'envoyer des informations à ClicData dès leur réception, afin que vous puissiez toujours voir des informations actualisées en temps réel.
Les formules payantes de ClicData commencent à $75/mois et proposent un essai gratuit de 15 jours.
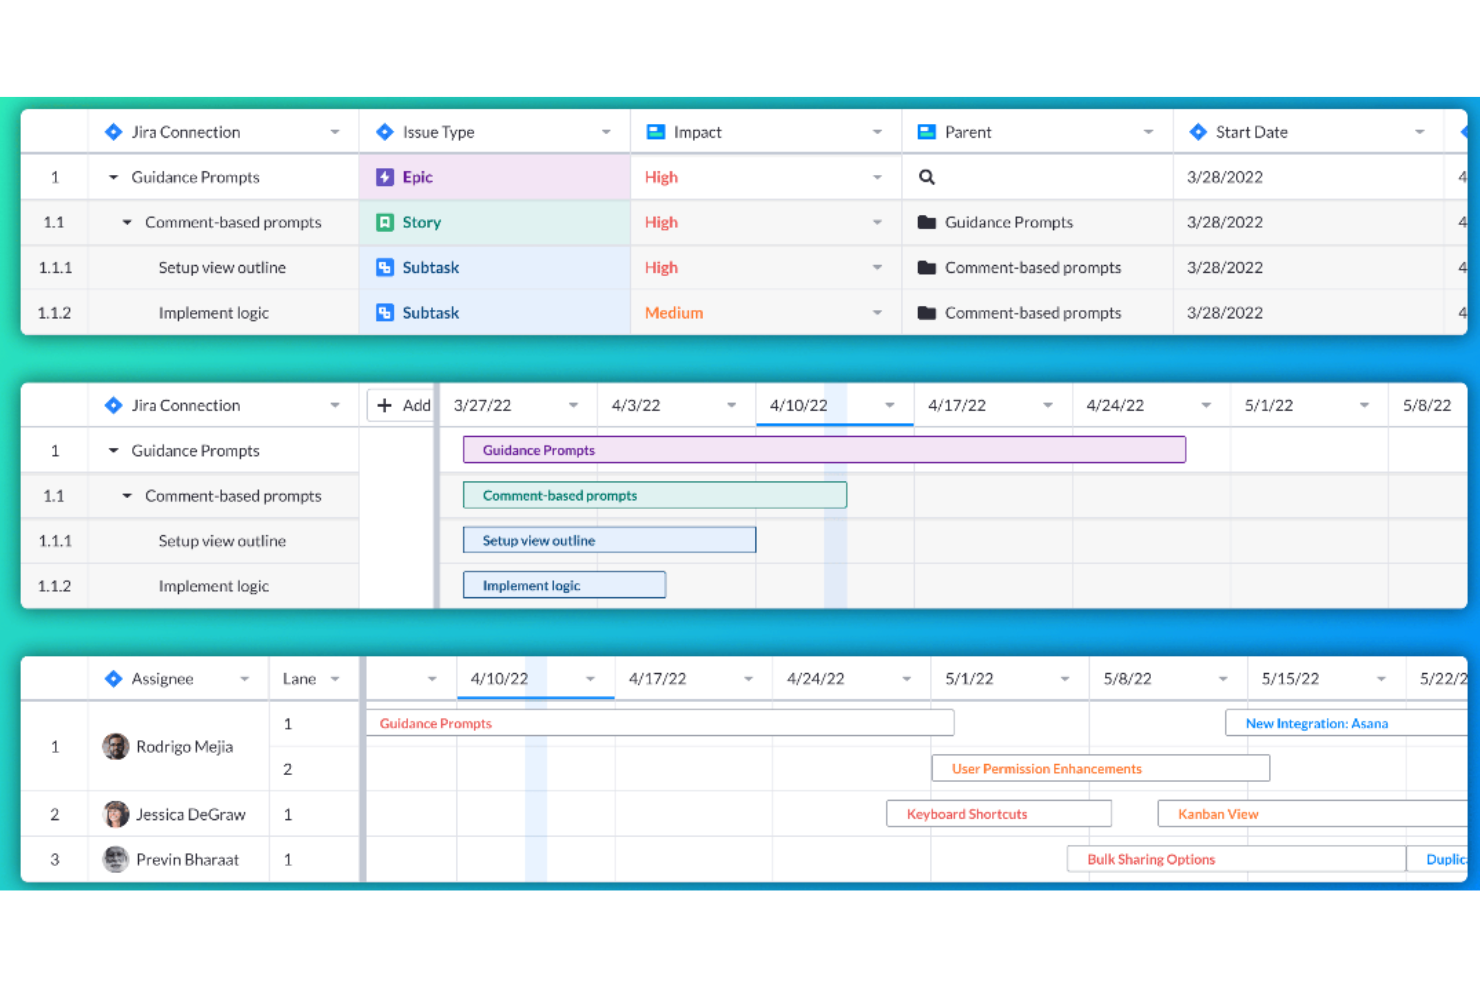
Visor est un outil de travail qui se connecte à diverses applications SaaS, visant à rassembler les personnes avec les données pour un environnement de travail plus collaboratif. Il permet aux utilisateurs de créer des vues et des visualisations personnalisées de leurs données Jira imbriquées, offrant une intégration bidirectionnelle avec Jira pour un partage précis et personnalisable.
Visor fonctionne comme un outil de travail qui améliore la fonctionnalité des applications SaaS en fournissant aux utilisateurs une vue unifiée de leurs données. Visor met également l'accent sur le partage sécurisé, avec une interface simple de glisser-déposer pour plus de facilité d'utilisation. Il comprend également un importateur JQL avancé et prend en charge plus de 75 types de champs Jira, répondant ainsi à une large gamme de besoins de gestion des données.
De plus, Visor facilite la collaboration et la communication entre les membres de l'équipe, grâce à des fonctionnalités telles que les diagrammes de Gantt, les feuilles de route, et la possibilité de personnaliser les vues avec des couleurs et un formatage conditionnel. Cela permet de gagner du temps et d'améliorer l'efficacité des processus de planification et de reporting des projets.
Visor s'intègre avec Salesforce, Jira et HubSpot.
Les tarifs de Visor commencent à partir de 9 $/utilisateur/mois.
Autres options
Au cours de ma recherche, j’ai trouvé quelques outils qui n’ont pas tout à fait réussi à intégrer le classement, mais qui méritent toutefois d’être mentionnés.
- Power BI
Meilleure solution d'intelligence d'affaires pour les utilisateurs Microsoft
- Logi Analytics
Mejor función de panel de análisis empresarial
- InetSoft
Meilleur outil d’intelligence des données pour une architecture évolutive et une modélisation avancée
- Metric Insights
Meilleur portail d'entreprise BI sur mesure
- Exago BI
Meilleur outil de reporting de business intelligence pour débutants et personnes non techniques
- Izenda
Meilleur logiciel de business intelligence pour l'intégration dans des applications web
- ClickUp
Idéal pour les intégrations d’outils BI


Comment j'évalue les outils d'intelligence d'affaires
Qu'il s'agisse d'aider une équipe financière à abandonner son rituel hebdomadaire d'Excel à PowerPoint ou de donner à une équipe produit une visibilité en temps réel sur l'adoption des fonctionnalités dans les segments clients, les outils d'intelligence d'affaires sont là où les données brutes deviennent enfin exploitables. Lorsque je les évalue, je réfléchis en deux niveaux : ce que chaque outil doit absolument faire pour figurer dans cette liste, et ce qui distingue ceux que je recommande véritablement de ceux qui fonctionnent techniquement mais irritent tous leurs utilisateurs.
Fonctionnalités de base (Critères essentiels pour cette liste)
Pour les outils d'intelligence d'affaires, les fonctionnalités de base que je teste et évalue sont :
- Connectivité aux données : Je vérifie si l'outil se connecte nativement aux sources vraiment utilisées par les équipes. Si un chef de produit ne peut pas combiner les données d'utilisation produit de son entrepôt avec celles du CRM sans avoir recours à une solution alternative, c'est un problème.
- Tableaux de bord interactifs : Chaque outil doit permettre l'exploration descendante, le filtrage croisé et des contrôles dynamiques des dates qui permettent aux utilisateurs d'explorer les données eux-mêmes. Je teste cela en construisant un tableau de bord multi-pages et en évaluant si un intervenant pourrait répondre lui-même aux questions de suivi sans que j'aie à tout reconstruire.
- Couche de modélisation des données : Je vérifie si l'outil permet de définir des métriques, des relations et des hiérarchies en un lieu unique afin que la notion de « revenu » soit la même sur chaque tableau de bord. Sans cela, j'ai vu des équipes passer plus de temps à débattre des chiffres qu'à les exploiter.
- Rapports et diffusion : Je recherche la possibilité d'envoyer des rapports programmés par email ou Slack, ainsi que des alertes déclenchées sur des seuils. Un responsable financier doit pouvoir recevoir chaque lundi matin un aperçu hebdomadaire du P&L dans sa boîte mail, sans effort manuel.
- Sécurité au niveau des lignes : Je m'assure que l'outil peut restreindre la visibilité des données par rôle ou identité utilisateur au niveau de la ligne. Cela devient essentiel dès que l'on a, par exemple, des directeurs régionaux des ventes qui ne doivent accéder qu'au pipeline de leur propre territoire.
- Scalabilité et performance des requêtes : Je mène des tests avec de grands volumes de données et des utilisateurs simultanés pour vérifier si les tableaux de bord se chargent toujours en quelques secondes. Un outil impressionnant en démo mais qui sature dès que 50 personnes ouvrent le même tableau de bord directionnel lundi matin n'est pas prêt pour la production.
- Analytique assistée par IA : J'évalue les fonctionnalités natives telles que les requêtes en langage naturel, la détection automatique d'anomalies et la prévision. Je veux m'assurer que l'IA propose de réelles informations pratiques — par exemple en signalant une hausse inattendue du taux d'attrition — et ne se contente pas d'ajouter un chatbot superficiel à une simple barre de recherche.
Si un outil ne parvient pas à remplir ces critères de manière fiable, il n'a pas été retenu, quelle que soit la qualité de ses autres fonctionnalités.
Fonctionnalités distinctives (Ce qui distingue les meilleurs choix)
Au-delà des bases, je m'intéresse à des options comme le déploiement multi-cloud ou sur site, l'intégration en marque blanche complète pour les SaaS, le contrôle de version basé sur Git pour les flux analytiques, les intégrations profondes avec d'autres solutions (dbt, Slack, MS Teams), et des outils de gouvernance avancés réellement évolutifs. Je teste aussi la capacité de chaque outil à faire ressortir automatiquement les informations pertinentes, à favoriser la data storytelling et à s'adapter à des secteurs très réglementés.
Ce que je prends en compte au-delà des fonctionnalités
J'analyse le coût total de possession — pas uniquement les licences, mais aussi le prix des connecteurs, la formation nécessaire, et l'administration à grande échelle. L'intégration dans l'écosystème compte aussi : une organisation « Microsoft first » tirera davantage parti de Power BI que d'un outil nécessitant des intégrations personnalisées à chaque étape. Enfin, j'évalue le temps nécessaire pour générer de la valeur car un outil qui nécessite six mois de déploiement risque de voir les parties prenantes se désengager avant même la sortie du premier tableau de bord.
Comment j’ai sélectionné les meilleurs outils BI
J’ai d’abord établi une grande liste d’outils populaires basée sur les avis et les notes des utilisateurs. Ensuite, j’ai affiné cette liste en examinant les caractéristiques clés qu’un outil BI doit, selon mon expérience, absolument offrir. Enfin, j’ai choisi les critères ci-dessous comme base de mon évaluation.
Interface utilisateur (UI)
Votre plateforme BI est l’endroit où vous analysez les données de l’entreprise et, grâce à la modélisation des données, les consommez sous forme de graphiques et autres visualisations facilitant la prise de décision. Par conséquent, l’interface doit être épurée, intuitive et tirer profit des espaces blancs.
Utilisabilité
L’outil doit être facile à apprendre et à prendre en main. Des outils comme Microsoft Power BI, par exemple, proposent une interface de glisser-déposer que vous pouvez utiliser sur les éléments graphiques pour modifier les informations analysées. L’outil BI doit offrir ce type de fonctionnalités ainsi qu’une documentation d’aide, des formations et des tutoriels vidéo pour faciliter sa prise en main.
Fonctionnalités et performances
Combien de fonctionnalités clés de reporting et de gestion propose-t-il, et quelle est leur puissance ? J’ai notamment recherché :
- Tableaux de bord personnalisables : Les meilleures solutions BI offrent un affichage sur un seul écran avec de multiples visualisations, ainsi que la possibilité d'interconnecter les visualisations (de sorte que tout filtre ou sélection affectera toutes les visualisations) ou de garder chacune indépendante. Il doit refléter les changements en temps réel et permettre de créer des présentations personnalisées des données clés.
- Exploration approfondie et filtres de données : Disposer d'informations détaillées est essentiel. Cela inclut des fonctions telles que les menus déroulants, les filtres de recherche et les segments, ainsi que la capacité d'approfondir les détails ou de revenir aux synthèses des données.
- Interface web pour les clients : Il est plus simple que les solutions de reporting à destination des clients offrent des interfaces web, car elles sont plus efficaces et plus faciles à administrer que les interfaces client installées sur poste de travail.
- Rapports planifiés et automatisés : L'outil doit vous aider à surveiller facilement les progrès. Cela inclut la possibilité de planifier l'envoi d'actualisations automatiques aux équipes, d'automatiser l'envoi de rapports aux clients, et de configurer des notifications automatiques pour être informé des dates clés ou des seuils atteints.
- Diagrammes de haute qualité : Les outils de base incluent les types de graphiques barres, lignes, secteurs, aires ou radar, tandis que les diagrammes avancés proposent des cartes thermiques, des nuages de points, des graphiques à bulles, des histogrammes et des cartes géospatiales. Les meilleurs outils de reporting permettent de combiner ces visualisations pour créer des diagrammes mixtes.
Intégrations
Les connecteurs de données aident à tirer le meilleur parti d'une plateforme BI. L'une des façons d'y parvenir est l'intégration de données avec d'autres logiciels cloud tels que SAP ou SAS. Ainsi, je recherche des intégrations préconstruites, des agrégateurs de logiciels tiers comme Zapier et des intégrations personnalisées à l'aide d'API.
Tarification
L'un des plus grands facteurs influençant les décisions d'achat d'outils est la tarification. Ainsi, je recherche des informations sur les cas d'usage, les plans tarifaires mensuels et tout autre renseignement utile. Par exemple, s'il existe une version gratuite à essayer, un essai gratuit, ou si la solution est disponible en version sur site.
FAQ sur les outils BI
Trouvez des réponses aux questions courantes que d’autres personnes posent sur ce sujet.
Comment les outils de business intelligence aident-ils les responsables analytiques à piloter la prise de décision stratégique ?
Les outils de business intelligence aident les responsables analytiques en automatisant la collecte de données et en fournissant des informations en temps réel via des tableaux de bord et des visualisations. Vous pouvez rapidement comparer les ventes par région, suivre les budgets et repérer les problèmes opérationnels sans reporting manuel. De nombreuses plateformes proposent des modèles prédictifs et des plans de scénarios pour anticiper les résultats et guider la stratégie. Avec le data storytelling—qui combine visuels et récit—vous pouvez influencer les décisions exécutives et aligner les équipes autour d’objectifs guidés par les données.
Quels sont les défis d'intégration courants lors de la mise en place d'outils BI dans des environnements d'affaires établis ?
Les défis d’intégration résultent souvent de systèmes informatiques obsolètes, de silos de données et de formats incohérents. Les ERP anciens ou les bases de données développées en interne peuvent avoir du mal à se connecter aux outils BI cloud, entraînant des erreurs de synchronisation ou des pertes de données. Une mauvaise qualité des données peut fausser les rapports, tandis que des protocoles de sécurité stricts peuvent ralentir l’accès. Pour y remédier, auditez vos données, impliquez l’informatique dès le départ, standardisez les formats, et choisissez des plateformes BI dotées d’une forte interopérabilité, telles que des connecteurs natifs, une prise en charge des API et des capacités de transformation des données.
Comment les outils BI soutiennent-ils la collaboration interservices pour les managers ?
Les outils BI facilitent la collaboration entre équipes en proposant une source de données unique accessible à tous. Plutôt que de jongler avec plusieurs versions de fichiers Excel, les managers peuvent créer des tableaux de bord interactifs qui se mettent à jour automatiquement avec les dernières données. Finance et ventes peuvent examiner ensemble les prévisions de revenus, tandis qu’opérations et RH surveillent les besoins en personnel. Des fonctionnalités comme les annotations de graphiques, l’attribution de tâches et les alertes KPI réduisent les malentendus, rendent les réunions plus efficaces et aident les services à rester alignés sur des objectifs communs.
Quels indicateurs de performance les managers doivent-ils suivre à l’aide d’un logiciel BI ?
Le choix des indicateurs dépend de vos objectifs, mais les plus courants sont la croissance du chiffre d’affaires, la marge nette, le coût d’acquisition client, la valeur vie client, le taux de désabonnement et les dépenses opérationnelles. Pour une équipe projet, on pourra aussi suivre les taux de livraison dans les délais ou l’utilisation des ressources. Les outils BI facilitent la création de tableaux de bord automatisés afin de surveiller ces indicateurs en temps réel. Vous pouvez définir des seuils personnalisés pour déclencher des notifications si une valeur sort de la plage souhaitée. À terme, le suivi de ces KPI permet de cibler rapidement les axes d’amélioration et de mesurer l’efficacité des nouvelles initiatives.
Comment mesurer le ROI d’une plateforme de business intelligence dans une organisation de taille moyenne à grande ?
Commencez par mesurer les économies directes, comme la réduction des heures de reporting manuel. Par exemple, si le service financier économise 20 heures par mois, cela réduit clairement les coûts de structure. Estimez ensuite les gains de chiffre d’affaires liés à des décisions plus rapides et fiables—comme gagner de nouveaux clients ou réduire les dépenses grâce à de meilleures prévisions. Suivez des indicateurs comme la diminution des erreurs de reporting, la rapidité d’accès aux informations et l’adoption des données. Comparez ces bénéfices au coût total—abonnements, intégration, formation et support—pour calculer le ROI et justifier l’investissement futur.
Et maintenant ?
Si vous êtes en train de rechercher des outils de business intelligence, contactez gratuitement un conseiller SoftwareSelect pour des recommandations personnalisées.
Vous remplissez un formulaire puis discutez brièvement avec un conseiller pour clarifier vos besoins. Vous recevez ensuite une liste restreinte de solutions logicielles à examiner. Ils vous accompagnent même tout au long de l’achat, y compris dans la négociation des prix.