Les 10 meilleurs créateurs de diagrammes de Gantt pour la planification de projet en 2026

10 Liste des meilleurs créateurs de diagrammes de Gantt


Les meilleurs créateurs de diagrammes de Gantt vous permettent de planifier et de gérer vos projets avec un calendrier visuel clair, facilitant la répartition des tâches, la gestion des dépendances, et le suivi des jalons. Sans diagramme de Gantt, vous risquez de manquer des échéances, de mal suivre l'avancement réél et de subir des malentendus qui retardent la livraison et nuisent à la responsabilité de chacun.
Fort de mes plus de 15 ans d’expérience en gestion de projet, j’ai minutieusement testé et évalué plus de 30 outils de création de diagrammes de Gantt. J’ai étudié les principales fonctionnalités et cas d’usage pour chaque solution afin de vous aider à choisir celle qui correspond à vos modes de travail, soutient la coordination d’équipes pluridisciplinaires, la planification de lancements produits, et la gestion simultanée de multiples échéances en toute maîtrise et clarté.
La fiabilité de nos avis sur les créateurs de diagrammes de Gantt
Nous testons et comparons des logiciels de création de diagrammes de Gantt depuis 2012. En tant que chefs de projet, nous savons combien il est critique et difficile de choisir le bon outil.
Nous effectuons des recherches approfondies pour aider notre audience à prendre de meilleures décisions d’achat. Nous avons testé plus de 2 000 solutions pour divers cas d’usage et rédigé plus de 1 000 avis complets sur ces logiciels. Découvrez comment nous restons transparents et consultez notre méthodologie d’évaluation des créateurs de diagrammes de Gantt.
Tableau comparatif des meilleurs créateurs de diagrammes de Gantt
Servez-vous de ce tableau pour comparer côte à côte les caractéristiques de mes choix de logiciels de Gantt.
| Tool | Best For | Trial Info | Price | ||
|---|---|---|---|---|---|
| 1 | Idéal pour les vues de tâches personnalisées | Plan gratuit + démo gratuite disponible | Gratuit pour toujours avec des forfaits payants à partir de 5 $/mois | Website | |
| 2 | Idéal pour le suivi visuel de l'avancement | Essai gratuit de 14 jours | À partir de $6/utilisateur/mois | Website | |
| 3 | Idéal pour les tableaux blancs interactifs | Offre gratuite disponible | À partir de $8/utilisateur/mois | Website | |
| 4 | Idéal pour les modèles faciles à utiliser | Essai gratuit de 30 jours | À partir de $9.95/mois | Website | |
| 5 | Idéal pour la collaboration en design | Offre gratuite disponible | À partir de 3$/utilisateur/mois (facturé annuellement) | Website | |
| 6 | Idéal pour visualiser les dépendances entre tâches | Offre gratuite disponible | À partir de 10,99 $/utilisateur/mois (facturé annuellement) | Website | |
| 7 | Idéal pour l'automatisation intelligente du travail | Essai gratuit de 14 jours | À partir de 9,80 $/utilisateur/mois | Website | |
| 8 | Idéal pour une planification de projet détaillée | Essai gratuit | À partir de $7/utilisateur/mois | Website | |
| 9 | Idéal pour les présentations orientées données | Essai gratuit de 30 jours | À partir de $21/utilisateur/mois | Website | |
| 10 | Idéal pour une interface conviviale | Offre gratuite disponible | À partir de $18/utilisateur/mois | Website |


-

Celoxis
Visit WebsiteThis is an aggregated rating for this tool including ratings from Crozdesk users and ratings from other sites.4.4 -
Accelo
Visit WebsiteThis is an aggregated rating for this tool including ratings from Crozdesk users and ratings from other sites.4.4 -
Wrike
Visit WebsiteThis is an aggregated rating for this tool including ratings from Crozdesk users and ratings from other sites.4.3


Avis sur les meilleurs créateurs de diagrammes de Gantt
Voici mon résumé de chaque outil de création de diagrammes de Gantt de ma sélection :

ClickUp est une solution complète de gestion du travail qui propose un créateur de diagrammes de Gantt parmi de nombreuses autres fonctionnalités telles que le tableau blanc, la définition d'objectifs, la gestion de documents, et bien plus encore.
J'ai récemment discuté avec Jeff Cypher, un ancien consultant ClickUp qui travaille désormais pour l'entreprise. Il a évoqué la flexibilité de ClickUp en matière de modifications de projet. 'Je recommande la vue Gantt de ClickUp aux chefs de projet qui ont besoin d'ajustements dynamiques à leurs projets', dit-il.
Pourquoi j'ai choisi ClickUp
J'ai choisi ClickUp pour ses vues de tâches personnalisables et ses diagrammes de Gantt. L'interface glisser-déposer de la plateforme permet d'ajuster facilement les tâches et leurs dépendances, tout en offrant une vue claire des échéanciers et des éventuels obstacles du projet. Avec des fonctionnalités telles que le chemin critique et le temps de flottement, vous pouvez rapidement identifier et résoudre les défis liés à la planification, ce qui facilite le maintien de vos projets sur la bonne voie. Cette personnalisation et flexibilité font de ClickUp un choix idéal pour les équipes souhaitant optimiser leurs processus de gestion de projet.
Principales fonctionnalités de ClickUp
ClickUp propose de nombreuses autres fonctionnalités pour créer des diagrammes de Gantt et gérer des projets.
- Jalons : Vous pouvez suivre les principales réalisations du projet pour vous assurer que votre équipe respecte les échéances critiques.
- Suivi du temps : Cela vous permet de suivre le temps passé sur les tâches directement sur la plateforme afin de mieux gérer vos ressources et vos délais.
- Priorités des tâches : Vous pouvez attribuer des niveaux de priorité aux tâches afin d'aider votre équipe à se concentrer sur l'essentiel et à faire avancer les projets efficacement.
- Attribution multiple : Vous pouvez attribuer des tâches à plusieurs membres de l'équipe, favorisant la collaboration et assurant la responsabilité sur l'ensemble de vos projets.
Intégrations ClickUp
Les intégrations incluent Slack, Google Workspace, Dropbox, Figma, Vimeo, Zoom, Box et Microsoft Teams. Vous pouvez également utiliser Zapier pour des intégrations supplémentaires, ou créer des intégrations personnalisées via l'API du logiciel.
Pros and Cons
Pros:
- Utilisateurs illimités avec le plan gratuit
- Plus de 50 widgets pour personnaliser votre tableau de bord
- Stockage de fichiers illimité avec tous les forfaits payants
Cons:
- Rapports non disponibles dans le plan gratuit
- Stockage, projets et champs personnalisés limités dans le plan gratuit
New Product Updates from ClickUp

ClickUp Introduces Brain² Company AI
ClickUp has introduced Brain², a self-improving company AI that routes to the best models and can complete work such as websites, slides, and project management tasks. For more information, visit ClickUp's official site.
 .
.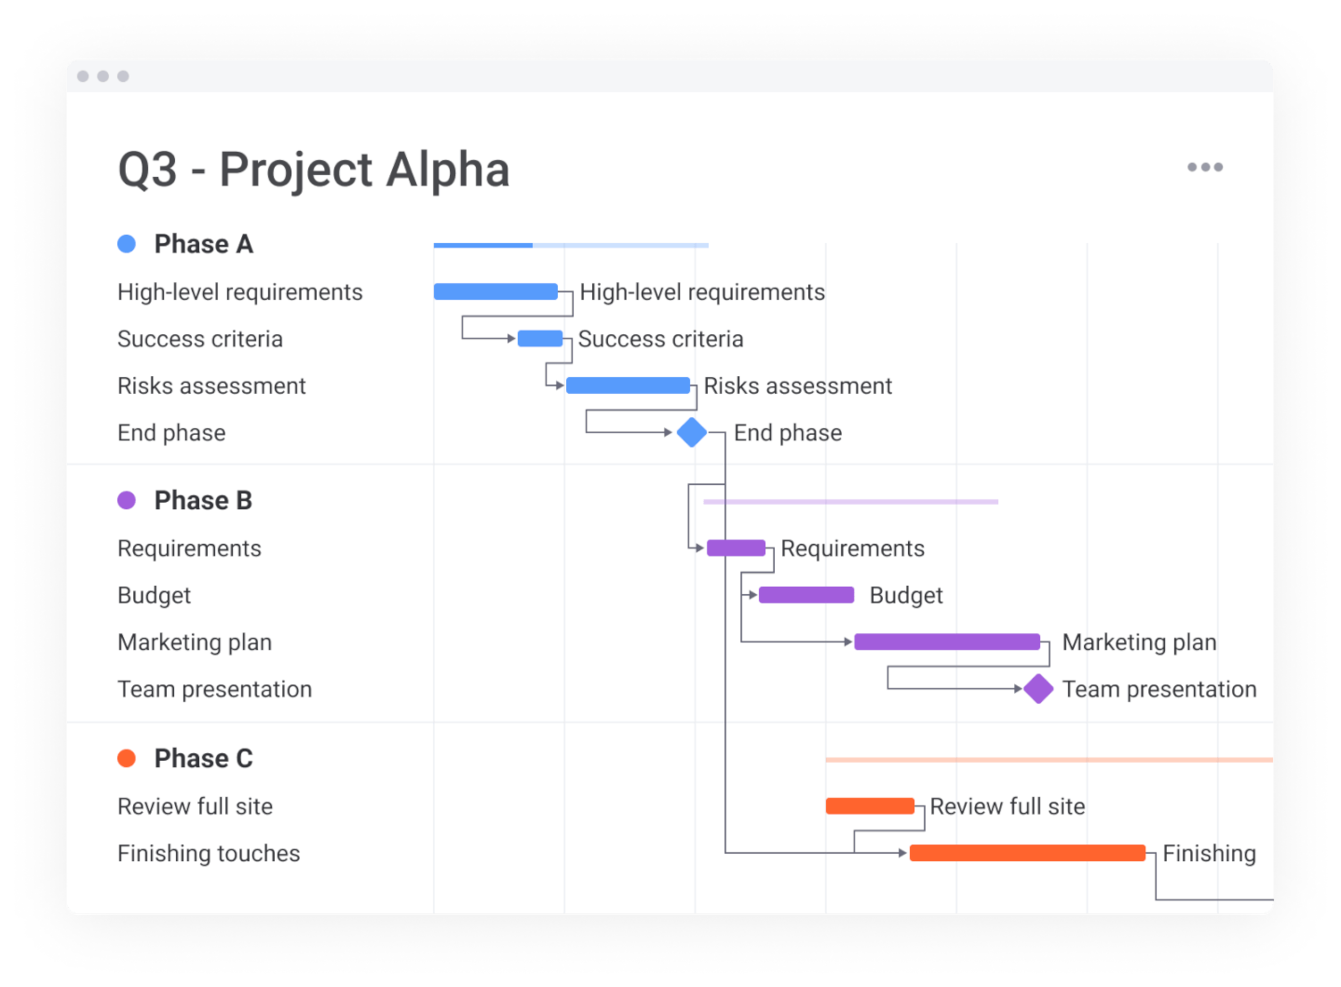
monday.com est une plateforme de gestion du travail qui offre une multitude de fonctionnalités pour la planification de projets et le suivi des ressources, dont les diagrammes de Gantt.
Pourquoi j'ai choisi monday.com
J'ai choisi monday.com car il permet de suivre l'avancement visuellement grâce à sa fonctionnalité de diagramme de Gantt. Les diagrammes de Gantt personnalisables de la plateforme vous permettent de visualiser les échéanciers, de prioriser les tâches et de gérer les dépendances, tout en apportant clarté et maîtrise à vos projets.
Ses tableaux de bord interactifs permettent de surveiller en un clin d'œil l'avancement, les budgets et les échéances, et favorisent une prise de décision éclairée. Ces fonctionnalités, associées à des outils de communication en temps réel, font de monday.com un excellent choix pour les équipes souhaitant améliorer la visibilité et la coordination des projets.
Fonctionnalités clés de monday.com
monday.com propose également un éventail d'autres fonctionnalités pour créer des diagrammes de Gantt et gérer vos projets.
- Dépendances des tâches : Vous pouvez facilement visualiser et gérer les relations entre les tâches, ce qui évite les goulots d'étranglement et permet d'assurer un déroulement fluide du projet.
- Suivi de l'avancement : Cette fonctionnalité vous permet de surveiller la santé de vos projets en temps réel avec des indicateurs visuels montrant les jalons et les pourcentages d'achèvement.
- Gestion des ressources : Cette fonction vous permet de centraliser les plannings et les responsabilités et d'allouer efficacement les ressources et la coordination entre les équipes.
- Structures de découpage du travail : Vous pouvez décomposer des projets complexes en tâches gérables, ce qui facilite la planification et l'exécution des projets.
Intégrations monday.com
Les intégrations comprennent Dropbox, Excel, Google Calendar, Google Drive, Integromat, Slack, Trello, et bien plus encore via un abonnement payant avec Zapier.
Pros and Cons
Pros:
- Interface conviviale et intuitive
- Offre gratuite à vie disponible
- Plateforme complète de gestion du travail
Cons:
- Stockage limité dans les offres de base et gratuite
- Les diagrammes de Gantt ne sont pas inclus dans l'offre de base ou gratuite
New Product Updates from monday AI Work Space

monday.com Adds Managed Columns Across Boards
monday.com adds Managed Column to let teams standardize and reuse column labels across multiple boards from a single source of truth. The update helps organizations maintain consistency, clarity, and centralized control at scale. For more information, visit monday.com’s official site.
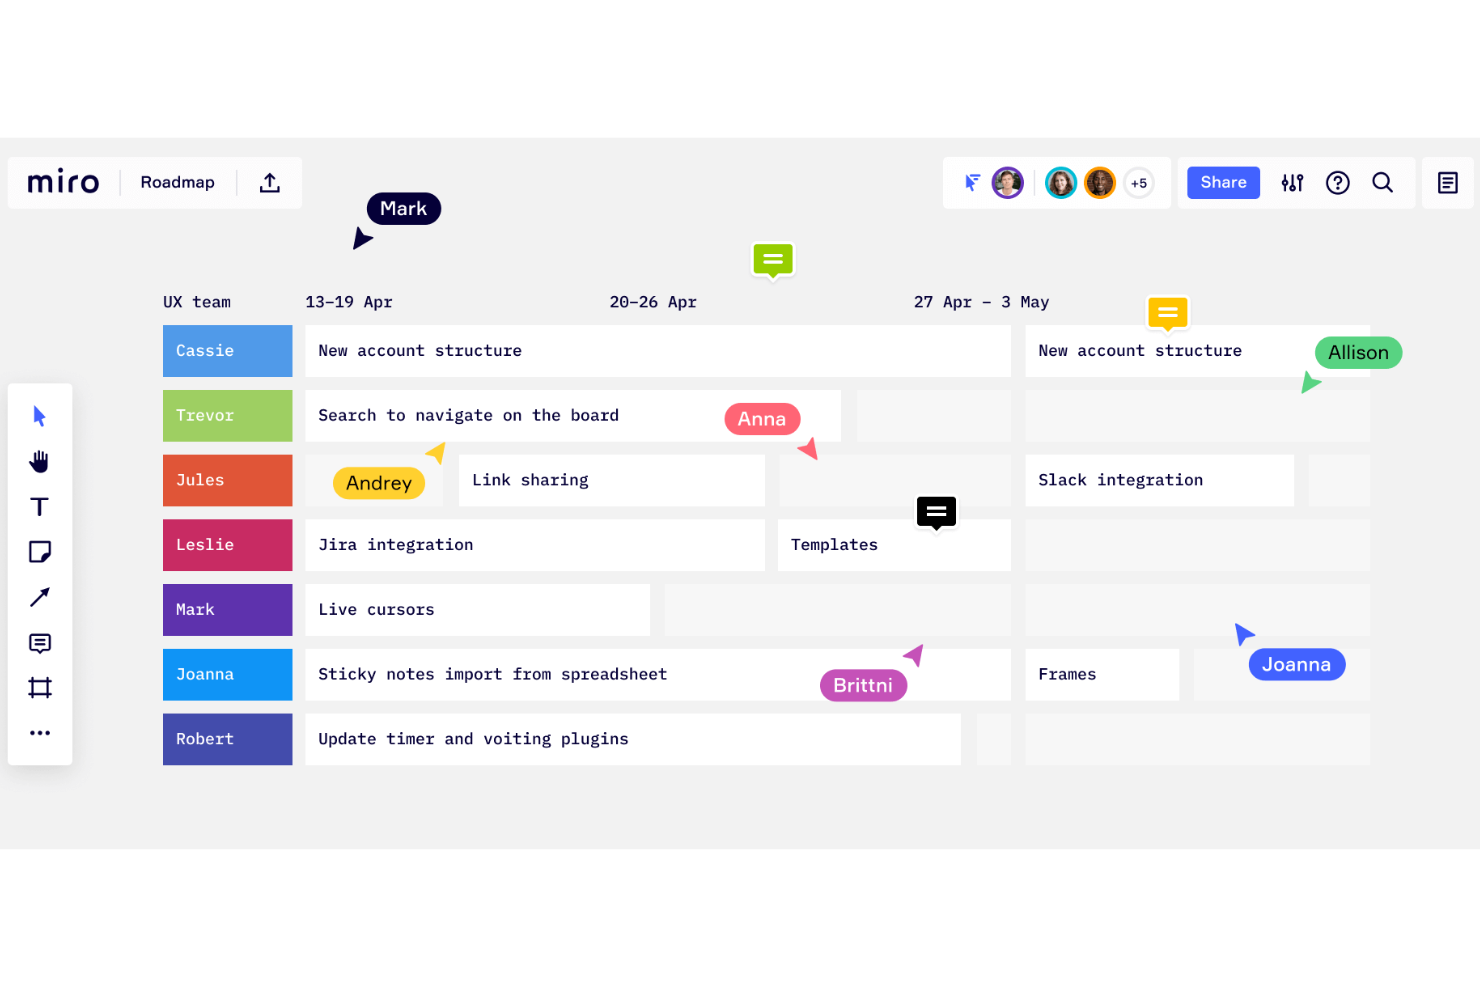
Miro est un tableau blanc collaboratif en ligne proposant plus de 1 000 modèles, dont des cartes heuristiques, des tableaux Kanban, des diagrammes de Gantt, des maquettes de produits, des tableaux de recherche et des organigrammes.
Pourquoi j'ai choisi Miro
J'ai choisi Miro pour ses capacités remarquables en tant que tableau blanc interactif, idéal pour créer des diagrammes de Gantt. Ce que j'apprécie, c'est que Miro permet à votre équipe de visualiser les échéanciers de projet directement sur un canevas collaboratif et rend facile l'ajustement des tâches et des dates limites en temps réel. La fonctionnalité glisser-déposer rend la modification de votre diagramme de Gantt simple et garde la planification de projet dynamique et réactive.
De plus, la capacité à collaborer avec les membres de l'équipe en temps réel signifie que les contributions et mises à jour sont intégrées de manière fluide. Cela permet aussi à tout le monde de rester synchronisé sans les échanges répétés.
Principales fonctionnalités de Miro
Miro propose également plusieurs autres fonctionnalités utiles pour créer des diagrammes de Gantt et gérer des projets.
- Estimation des efforts : Cette fonctionnalité vous permet de prendre en compte les personnes, le temps et les outils nécessaires aux tâches, et vous aide à identifier les risques potentiels dès le début de la planification du projet.
- Jalons : Vous pouvez définir et célébrer des jalons, ce qui aide à motiver votre équipe et à s'assurer que tout le monde reste aligné sur les objectifs du projet.
- Modèles personnalisables : Cela vous permet de démarrer avec des modèles prêts à l'emploi ou de créer des diagrammes à partir de zéro et d'ajouter des tâches, des échéanciers et un code couleur pour une meilleure organisation et clarté.
- Assistance par IA : Les fonctionnalités d'IA de Miro peuvent structurer automatiquement les échéanciers et les tâches selon votre saisie afin d'économiser du temps et d'assurer la précision.
Intégrations de Miro
Les intégrations incluent Zoom, Figma, Asana, Microsoft Teams, Jira, Slack, Google Drive, Box, Confluence, monday.com, Airtable, Notion, Azure et Webex. Certaines intégrations sont réservées aux formules payantes.
Pros and Cons
Pros:
- Mise en place intuitive et facile
- Offre gratuite à vie disponible
- Fonctionnalités de communication intégrées
Cons:
- Le zoom peut être saccadé sur les grands projets
- Pas d’export PDF de haute qualité avec l’offre gratuite
New Product Updates from Miro
Miro Adds Japan Data Residency for Enterprise Customers
Miro has introduced Japan data residency for enterprise customers, offering in-region storage for production data, backups, and metadata, plus in-region compute infrastructure. For more information, visit Miro's official site.
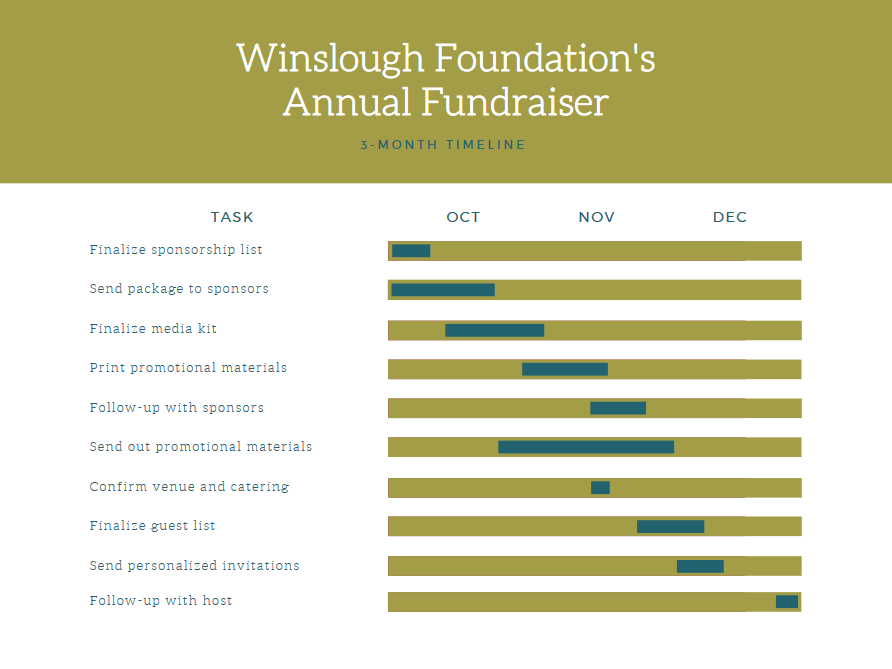
Canva est une plateforme de conception en ligne conçue pour être facile à utiliser même pour les non-experts. Elle propose des modèles pour toutes sortes de besoins, des diagrammes de Gantt aux présentations, infographies, visuels pour réseaux sociaux, et bien plus.
Pourquoi j'ai choisi Canva
Je suis un grand fan de l'interface simple et directe de ce logiciel, basée sur le glisser-déposer. Il est facile à prendre en main, même pour les moins technophiles d'entre nous. J'ai inclus Canva dans cette liste parce qu'il est intuitif et dispose d'une grande quantité de modèles prêts à l'emploi. Vous pouvez choisir parmi des centaines de milliers de modèles disponibles, et les personnaliser selon vos besoins. À mon avis, l'offre gratuite de Canva est un excellent moyen, rapide et sans frais, de créer un diagramme de Gantt prêt à être présenté. De plus, vous pourrez utiliser la plateforme pour d'autres besoins graphiques également.
Fonctionnalités clés de Canva
En plus des modèles, Canva offre une série d'autres fonctionnalités utiles pour la création de diagrammes de Gantt.
- Outils de personnalisation visuelle : Vous pouvez facilement ajuster les couleurs, les polices et les styles pour correspondre à votre image de marque et rendre vos diagrammes de Gantt fonctionnels et attrayants.
- Définition des jalons : Cette fonctionnalité vous permet de marquer les étapes clés de votre calendrier de projet afin d'aider votre équipe à rester concentrée sur les livrables principaux.
- Gestion des dépendances : Vous pouvez relier les tâches pour visualiser les dépendances et vous assurer que votre équipe comprend bien l'enchaînement des activités du projet.
- Fonctionnalités de collaboration : Vous et votre équipe pouvez éditer et voir les changements en temps réel, ce qui améliore la communication et le travail d'équipe.
Intégrations Canva
Les intégrations comprennent WordPress, eClincher, Rippling, Sendible, Post Planner et Viraltag.
Pros and Cons
Pros:
- Ultra convivial et intuitif
- Des centaines de milliers de modèles
- Produit présentable, aucun besoin de designer
Cons:
- Fonctionnalités avancées des diagrammes de Gantt absentes
- Options de téléchargement limitées avec l'offre gratuite
FigJam est un outil de tableau blanc en ligne conçu pour faciliter la collaboration en temps réel entre les membres d'une équipe, offrant une plateforme dynamique pour une variété d'activités telles que le remue-méninges, la création de diagrammes et la planification stratégique.
Pourquoi j'ai choisi FigJam
J'ai choisi FigJam comme créateur de diagrammes de Gantt grâce à sa capacité à collaborer en temps réel, ce qui est essentiel pour maintenir des plannings de projet à jour et assurer l'alignement de l'équipe. Ce qui distingue FigJam, c'est son intégration de fonctionnalités d'IA capables de générer des modèles personnalisés et d'automatiser les tâches répétitives, ce qui peut s'avérer particulièrement utile lors de la création et de la mise à jour de diagrammes de Gantt.
Je pense que FigJam est idéal pour la collaboration en temps réel au sein d'équipes de design car il permet non seulement aux membres de travailler ensemble de façon synchrone grâce à l'audio et au chat en direct, mais il prend également en charge la communication asynchrone via les commentaires et les réactions, garantissant ainsi que tous les membres, quel que soit leur emplacement ou leur fuseau horaire, puissent contribuer au processus de planification du projet.
Principales fonctionnalités de FigJam
FigJam propose plusieurs autres fonctionnalités qui en font un choix intéressant pour un logiciel de diagramme de Gantt.
- Tableau blanc interactif : Permet à votre équipe de collaborer en temps réel, de dessiner des idées et des plans de projet directement sur une toile numérique, et de visualiser des plannings de projets complexes.
- Visualisation des jalons : Vous pouvez suivre la progression en marquant les dates clés et les livrables dans votre chronologie de projet et vous assurer que tout le monde est aligné sur les objectifs du projet.
- Outils de gestion des ressources : Ils permettent d'allouer et de suivre efficacement les ressources (via des modèles), et de maintenir l'équilibre et l'efficacité des tâches de votre projet.
- Attribution et gestion des tâches : Vous pouvez attribuer des tâches aux membres de l'équipe directement dans le diagramme de Gantt, ce qui facilite la gestion des plannings et des responsabilités.
Intégrations de FigJam
Les intégrations incluent Figma, Microsoft Teams, Asana, Jira, Mixpanel et GitHub.
Pros and Cons
Pros:
- Propose des modèles communautaires pour divers usages
- Intégration avec Figma pour la collaboration en design
- Interface conviviale et intuitive
Cons:
- Pas d'accès hors ligne disponible
- L'intégration et le support du compte sont réservés au plan entreprise

Asana est un outil de gestion de projet qui aide les équipes à planifier, organiser et suivre le travail au fil du temps. L'un de ses moyens clés pour y parvenir est sa vue chronologique (également appelée Gantt), qui vous permet de visualiser les tâches réparties sur un calendrier.
Pourquoi j’ai choisi Asana
J’ai choisi Asana parce qu’il donne la possibilité de créer des dépendances entre les tâches directement dans la vue chronologique. Cela signifie que vous ne faites pas que mettre des dates aux tâches—vous pouvez aussi montrer quelles tâches en bloquent d’autres ou dépendent d’autres. Lorsque des changements surviennent (déplacements de tâches, retards), vous voyez comment une modification se répercute sur les tâches dépendantes.
Fonctionnalités clés d’Asana
En plus de la visualisation des dépendances entre tâches, Asana propose une gamme d'autres fonctionnalités pour la gestion de projet.
- Vue Chronologique : Elle permet de créer un plan de projet visuel et de programmer des échéances et jalons pour un meilleur suivi.
- Priorisation des tâches : Vous pouvez facilement hiérarchiser les tâches dans les projets et garantir que votre équipe se concentre sur les points les plus importants à tout moment.
- Modèles de projet : Cela vous aide à configurer rapidement de nouveaux projets à l’aide de structures et de flux prédéfinis.
- Outils de collaboration d’équipe : Avec des fonctionnalités de communication intégrées comme les commentaires et pièces jointes, votre équipe peut collaborer et échanger des informations directement au sein des tâches.
Intégrations d’Asana
Les intégrations incluent Slack, Google Drive, Everhour, Microsoft Teams, Amazon Q Index, Splunk, Entra ID, Tableau, Jira Cloud, Microsoft Office 365, MuleSoft et BetterCloud.
Pros and Cons
Pros:
- Met en avant le chemin critique pour visualiser les bloqueurs
- Permet de créer des dépendances entre tâches dans la vue chronologique
- Prend en charge les sous-tâches dans une vue chronologique de projet globale
Cons:
- Les chronologies complexes peuvent devenir visuellement encombrées
- L’accès à l’API d’écart est limité ou absent pour certaines données

Wrike est une plateforme de gestion de projet basée sur le cloud qui combine la planification avec diagramme de Gantt, le suivi des tâches, la gestion de la charge de travail et l'automatisation des processus alimentée par l'intelligence artificielle pour les projets et les flux de travail.
Pour qui Wrike est-il le mieux adapté ?
Wrike convient particulièrement aux équipes de taille moyenne à grande entreprises qui gèrent des projets complexes avec de multiples parties prenantes dans les domaines produit, marketing et opérations.
Pourquoi j'ai choisi Wrike
J'ai sélectionné Wrike parmi les meilleurs car son automatisation par IA va bien au-delà de simples suggestions superficielles. Les capacités IA de Wrike peuvent aider à résumer le travail, générer du contenu et assister dans les flux de gestion de projet. J'apprécie aussi Wrike Copilot, qui est intégré dans vos projets et répond à la demande aux questions sur l'état d'avancement ou le progrès d'un sprint. Pour le travail spécifique avec diagramme de Gantt, cela signifie moins de temps passé à rechercher des mises à jour et plus de temps consacré à la gestion des dépendances et des jalons.
Fonctionnalités clés de Wrike
- Chronologie Gantt interactive : Glissez-déposez les tâches directement sur la chronologie pour replanifier le travail et ajuster les dépendances en temps réel.
- Vue de la charge de travail : Visualisez les tâches attribuées à chaque membre et leur capacité sur les projets afin d'anticiper la surcharge avant qu'elle n'affecte la livraison.
- Tableaux de bord personnalisés : Construisez des tableaux de bord propres à chaque projet affichant l'avancement des tâches, les éléments en retard et le statut des jalons d'un simple coup d'œil.
- Modèles de projet : Sauvegardez et réutilisez des structures de projet, y compris les chronologies et séquences de tâches, en tant que modèles pour des processus reproductibles.
Intégrations Wrike
Wrike propose plus de 400 intégrations grâce à ses connecteurs natifs et à l'add-on Wrike Integrate, incluant des outils comme Salesforce, Microsoft Teams, Google Sheets, Slack, Adobe Creative Cloud, Jira, Power BI, Tableau, Miro et Zoom. Il se connecte aussi à Zapier et dispose d'une API RESTful ouverte pour des intégrations personnalisées.
Pros and Cons
Pros:
- Chemin critique intégré avec analyse des marges
- Importe les fichiers projet .MPP, .MPX et .XML
- Les dates des tâches dépendantes s'ajustent automatiquement en cas de modification
Cons:
- La navigation entre les espaces et vues paraît encombrée
- Le suivi du temps est réservé à la formule Business et supérieure
New Product Updates from Wrike

Wrike Improves Template Mapping and Dashboard Filters
Wrike expanded Template Mapping with workflow and custom item type mapping, and made the new filter experience the default for Dashboard chart widgets. These updates simplify workspace setup and provide a more consistent dashboard filtering experience. For more information, visit Wrike’s official site.
 .
.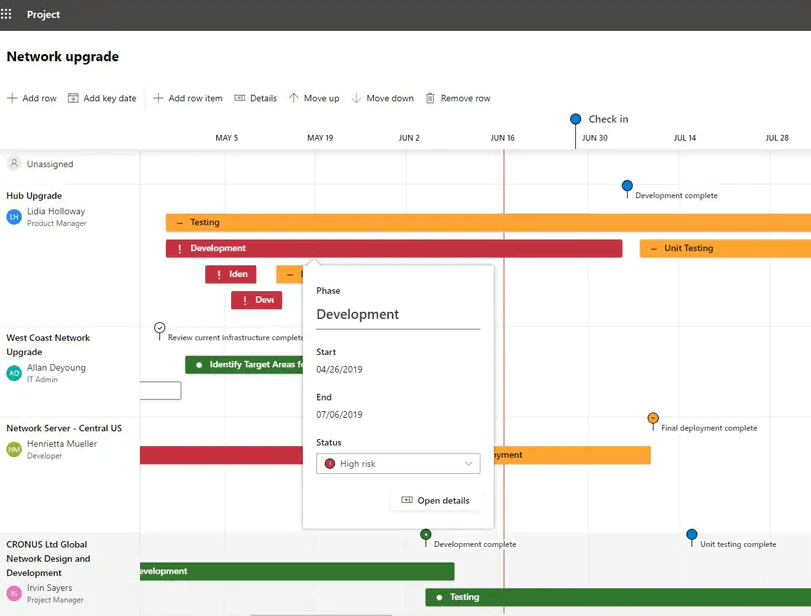
Microsoft Project est un logiciel de gestion de projet développé et commercialisé par Microsoft. Il est conçu pour vous aider à planifier, suivre et gérer des projets de différentes tailles et complexités grâce à une variété de fonctionnalités, dont son générateur de diagrammes de Gantt.
Pourquoi j'ai choisi Microsoft Project
J'ai choisi Microsoft Project pour sa planification de projet détaillée, ce qui en fait un excellent choix pour créer des diagrammes de Gantt. Avec des fonctionnalités telles que l'organisation hiérarchique des tâches et la liaison des dépendances, vous pouvez visualiser les plannings de projets complexes avec clarté.
La personnalisation des barres de Gantt permet d'ajouter des repères visuels personnalisés et vous aide à gérer les tâches de projet complexes. De plus, les outils intégrés d’allocation des ressources et de gestion du budget permettent de maintenir la planification des projets en adéquation avec les capacités de votre équipe et vos contraintes financières.
Fonctionnalités clés de Microsoft Project
Microsoft Project propose également une variété d'autres fonctionnalités qui en font un outil utile pour la création de diagrammes de Gantt.
- Vue chronologique : Cette fonctionnalité vous permet d’avoir une vue d’ensemble de votre calendrier de projet et offre un aperçu général qui complète la vue détaillée du diagramme de Gantt.
- Suivi des jalons : Vous pouvez définir des points spécifiques dans la chronologie de votre projet pour vous concentrer sur les réalisations clés et vous assurer que votre équipe respecte les échéances importantes.
- Regroupement des ressources : Cela vous permet de gérer les ressources sur plusieurs projets et d'allouer efficacement les membres de l'équipe et les équipements.
- Priorisation des tâches : En attribuant des niveaux de priorité aux tâches, vous pouvez traiter en premier les activités les plus critiques, optimiser vos flux de travail et maximiser la productivité.
Intégrations Microsoft Project
Les intégrations incluent les autres logiciels Microsoft, comme Outlook, Excel, Skype, et plus encore.
Pros and Cons
Pros:
- Module de priorisation des facteurs pour classer les stratégies/objectifs
- Descriptions utiles de modèles de projet pour vous guider
- Intégration avec les autres logiciels Microsoft
Cons:
- Options de personnalisation limitées
- Courbe d'apprentissage abrupte

think-cell est un module complémentaire logiciel pour Microsoft PowerPoint et Excel qui vous aide à créer facilement différents types de graphiques pour vos présentations destinées aux parties prenantes, y compris des diagrammes de Gantt.
Pourquoi j'ai choisi think-cell
Pour les chefs de projet qui passent plus de 2 heures par semaine à préparer des présentations dans Excel ou PowerPoint, je pense que ce logiciel vous fera gagner énormément de temps et vous évitera bien des maux de tête. Il vous permet de créer des diagrammes de Gantt basés sur un calendrier ajustable directement dans PowerPoint, avec des fonctionnalités de glisser-déposer pour les échéanciers, les dépendances et les jalons. Vous pouvez également lier des feuilles Excel à des graphiques PowerPoint afin que toute mise à jour de données soit reportée dans votre diagramme de Gantt.
Fonctionnalités clés de think-cell
think-cell propose toute une gamme d'autres fonctionnalités conçues pour créer des diagrammes de Gantt efficaces.
- Saisie interactive des activités : Cela vous permet de saisir les activités directement sur le diagramme de Gantt afin de simplifier la construction de votre échéancier de projet.
- Semaines de travail personnalisables : Vous pouvez définir la configuration des semaines de travail, telles que des semaines de 5 ou 7 jours, pour refléter précisément le planning de votre équipe.
- Accolades de période : Cette fonctionnalité vous permet d'ajouter facilement des accolades pour indiquer la durée de tâches ou de phases spécifiques de votre projet et fournit des repères visuels clairs.
- Mise à jour automatique des dates : Lorsque vous déplacez des tâches ou des jalons, les dates s'ajustent automatiquement, ce qui garantit l'exactitude de votre échéancier sans intervention manuelle.
Intégrations think-cell
Les intégrations comprennent Microsoft PowerPoint et Microsoft Excel.
Pros and Cons
Pros:
- Améliore vos capacités avec les produits Microsoft
- Automatisation pour accélérer les tâches répétitives
- Convient même aux non-experts techniques
Cons:
- Il est difficile de transférer les données vers un nouveau graphique une fois celui-ci créé
- Principalement conçu pour Windows
Visor est un créateur de diagrammes de Gantt qui aide les utilisateurs à réaliser gratuitement des diagrammes de Gantt et des feuilles de calcul colorés, connectés à des applications SaaS comme Jira. Avec Visor, les utilisateurs peuvent visualiser les calendriers de leurs projets, planifier les ressources, suivre l’avancement et gérer les dépendances.
Pourquoi j’ai choisi Visor
J’ai choisi Visor pour son interface conviviale, qui, selon mon expérience, est particulièrement utile pour rester organisé et respecter les délais lors de la gestion de projets complexes. Sa synchronisation bidirectionnelle avec les applications SaaS garantit que vos diagrammes et rapports restent précis sans intervention manuelle et permet de créer des diagrammes de Gantt à partir des informations de votre outil SaaS, même lorsque les données ne sont pas parfaitement propres. Vous pouvez créer des vues pour chaque membre de votre équipe sans avoir à configurer un compte individuel pour chacun. Vous pouvez également glisser-déposer les tâches pour ajuster rapidement les échéances.
Fonctionnalités clés de Visor
Visor propose également une gamme d’autres fonctionnalités pour la gestion de projet et la création de diagrammes de Gantt.
- Vues multiples : Visor propose des vues Gantt, tableau, Kanban et chronologique, afin que votre équipe puisse gérer les projets sous divers angles et adopter la vue correspondant le mieux à son mode de travail.
- Modèles intelligents IA : Vous pouvez profiter de modèles propulsés par l’IA pour générer rapidement des diagrammes de Gantt adaptés à vos tâches spécifiques, économisant un temps précieux lors de la configuration du projet.
- Ajout de jalons : Cela vous permet d’ajouter facilement des jalons et de les colorer pour les tâches et sous-tâches, facilitant la visualisation de l’avancement du projet et la hiérarchisation des livrables clés.
- Champs personnalisés : Vous pouvez créer des champs personnalisés pour enregistrer et étiqueter des données dans les diagrammes de Gantt, ce qui apporte une flexibilité pour capturer et catégoriser les informations selon les besoins uniques de votre projet.
Intégrations Visor
Les intégrations incluent Jira, Salesforce et Asana.
Pros and Cons
Pros:
- Permet des flux de travail multi-applications
- Synchronisation bidirectionnelle qui renvoie l'information à la source
- Interface colorée et intuitive
Cons:
- Les crédits de synchronisation sont limités
- C’est uniquement un visualiseur - nécessite un autre outil
Autres logiciels de création de diagrammes de Gantt
Les outils ci-dessus ne sont pas les seuls créateurs de diagrammes de Gantt disponibles. Voici d’autres solutions qui méritent d’être mentionnées.
- MindView
Idéal pour les structures de découpage du projet
- TeamGantt
Idéal pour suivre les chemins critiques de projet
- Gantter
Idéal pour les recommandations avec IA
- GanttPRO
Idéal pour la gestion de la charge de travail en temps réel
- Smartsheet
Idéal pour la planification inter-départements
- Zoho Projects
Idéal pour la montée en charge
- ProjectManager
Idéal pour les grandes entreprises
- Office Timeline
Idéal pour la création de frises chronologiques


Découvrez notre vidéo sur les meilleurs créateurs de diagrammes de Gantt :

Autres avis sur des logiciels de gestion de projet
Si vous n’avez pas encore trouvé ce qu’il vous faut, consultez ces autres avis de logiciels de gestion de projet que nous avons sélectionnés pour vous :
- Outils de productivité
- Logiciels de suivi de projet
- Logiciels de planification de projet
- Logiciels de gestion de projet
- Logiciels de gestion des ressources
- Logiciels d'automatisation des processus
- Logiciels de gestion de projet avec diagrammes de Gantt
Critères de sélection pour les créateurs de diagrammes de Gantt
Lors de la sélection des meilleurs créateurs de diagrammes de Gantt à inclure dans cette liste, j’ai pris en compte les besoins courants des acheteurs et leurs points de douleur, tels que la capacité à suivre facilement les échéances de projet et à collaborer avec les membres de l’équipe. J’ai utilisé le cadre suivant pour rendre mon évaluation structurée et équitable :
Fonctionnalités de base (25% du score total)
Pour être considéré dans cette liste, chaque solution devait répondre aux cas d’utilisation suivants :
- Créer et modifier des diagrammes de Gantt
- Suivre l’avancement du projet avec des jalons
- Attribuer des tâches aux membres de l’équipe
- Visualiser les dépendances entre les tâches
- Exporter les diagrammes de Gantt sous plusieurs formats
Fonctionnalités spéciales supplémentaires (25% du score total)
Pour affiner la sélection, j’ai également recherché des fonctionnalités uniques, telles que :
- Intégration avec des outils de gestion de projet populaires
- Fonctionnalités de collaboration en temps réel
- Modèles personnalisables pour les diagrammes de Gantt
- Outils avancés de gestion des ressources
- Recommandations de planification à l’aide de l’IA
Facilité d’utilisation (10% du score total)
Pour évaluer la convivialité de chaque système, j’ai recherché les éléments suivants :
- Une interface intuitive avec glisser-déposer
- Des graphiques clairs et visuellement attrayants
- Navigation facile entre les projets
- Mises à jour et modifications des tâches simples
- Faible latence du système pour les grands projets
Expérience d’intégration (Onboarding) (10% du score total)
Pour évaluer l’intégration de chaque plateforme, j’ai examiné si l’outil propose :
- Accès à des visites interactives du produit
- Modèles prêts à l’emploi pour une mise en route rapide
- Vidéos de formation complètes et documentation détaillée
- Assistance par chat en direct ou chatbot lors de la configuration
- Webinaires ou séances de démonstration pour les nouveaux utilisateurs
Service client (10% du score total)
Pour évaluer les services de support client de chaque fournisseur, j’ai vérifié si le créateur de diagrammes de Gantt propose :
- Support client disponible 24h/24, 7j/7
- Base de connaissances détaillée ou FAQ
- Plusieurs moyens de contact : e-mail, chat et téléphone
- Des réponses aux demandes dans des délais raisonnables
- Des relances proactives pour la résolution des problèmes
Rapport qualité/prix (10% du score total)
Pour évaluer la valeur de chaque plateforme, j’ai vérifié si l’outil propose les éléments suivants :
- Des formules tarifaires flexibles selon la taille des équipes
- Périodes d’essai gratuites ou versions freemium
- Fonctionnalités avancées à un prix concurrentiel
- Toutes les fonctionnalités nécessaires dans les forfaits de base
- Frais cachés ou coûts imprévus
Avis clients (10% du score total)
Pour évaluer la satisfaction générale des utilisateurs, j’ai vu si les avis couvraient les aspects suivants :
- Facilité d’utilisation et ergonomie
- Fiabilité et disponibilité de la plateforme
- Satisfaction à l’égard du support client
- Perception du rapport qualité/prix
- Efficacité globale en gestion de projets
Comment choisir un logiciel de création de diagrammes de Gantt
Il est facile de se perdre dans des listes de fonctionnalités interminables et des structures tarifaires complexes. Pour rester concentré, voici une checklist des critères à garder à l’esprit :
| Facteur | À prendre en compte |
|---|---|
| Évolutivité | Assurez-vous que l’outil peut gérer la croissance de votre équipe et des projets de plus en plus complexes sans ralentissements. |
| Intégrations | Vérifiez si le logiciel se connecte avec les outils déjà utilisés, comme les logiciels de gestion de projet, les CRM ou le stockage dans le cloud. |
| Personnalisation | Cherchez des options pour personnaliser les diagrammes de Gantt avec des champs personnalisés, des couleurs ou des mises en page adaptées au flux de travail de votre équipe. |
| Facilité d’utilisation | Assurez-vous que l’interface soit intuitive afin que votre équipe puisse commencer à l’utiliser rapidement, sans formation approfondie. |
| Budget | Comparez les plans tarifaires et assurez-vous que les fonctionnalités dont vous avez besoin sont incluses sans nécessiter d’ajouts coûteux. |
| Dispositifs de sécurité | Vérifiez que la plateforme offre de solides mesures de protection des données, comme le chiffrement et le contrôle des accès utilisateurs, pour sécuriser vos projets. |
| Collaboration | Confirmez qu’elle prend en charge la collaboration en équipe avec des fonctionnalités comme les commentaires sur les tâches, les mises à jour en temps réel et le partage de fichiers. |
| Outils de rapport | Vérifiez si le logiciel propose des rapports clairs et exploitables pour suivre les progrès et prendre des décisions basées sur les données. |
Tendances dans les créateurs de diagrammes de Gantt
Voici un aperçu de certaines tendances en matière de créateurs de diagrammes de Gantt que nous anticipons de voir évoluer cette année :
- Meilleures interfaces visuelles : Des logiciels comme Smartsheet et ClickUp ont entrepris d’importantes améliorations d’interface afin de rendre la visualisation des projets plus intuitive, colorée et interactive.
- Intégration de l’intelligence artificielle : Des outils comme Hive et Height proposent des fonctionnalités d’IA capables d’automatiser des tâches chronophages et d’offrir des analyses prédictives. C’est particulièrement utile pour l’allocation des ressources et l’identification des risques, et cela peut vous aider à réduire la charge de travail.
- Plug-ins de collaboration en temps réel : Avec la réduction de logiciels spécialisés, davantage d’outils proposent des plug-ins et intégrations permettant de discuter, partager des fichiers et prendre des décisions sans quitter la plateforme.
Qu’est-ce qu’un créateur de diagrammes de Gantt ?
Un créateur de diagrammes de Gantt est un outil de gestion de projet permettant de concevoir des diagrammes de Gantt — des chronologies visuelles de projet — et de les utiliser pour suivre l’avancement. Vous pouvez utiliser un logiciel de diagramme de Gantt pour planifier les tâches, les durées, les dates de début et de fin, les dépendances, le chemin critique ainsi que les ressources.
Les programmes de diagrammes de Gantt intègrent aussi souvent des fonctions d’attribution des tâches et de gestion des ressources, ce qui facilite la planification de projet et permet d’assurer clarté et alignement sur le plan et l’avancement du projet.
Fonctionnalités d’un logiciel de création de diagrammes de Gantt
Lors du choix d’un créateur de diagrammes de Gantt, portez attention aux fonctionnalités clés suivantes :
- Dépendances entre tâches : Vous pouvez facilement relier des tâches et visualiser quelles tâches doivent être terminées en priorité. Cela vous aide à repérer les goulets d’étranglement et maintenir le bon avancement des projets.
- Interface glisser-déposer : Cela vous permet de cliquer et déplacer simplement des tâches sur la chronologie, ce qui rend la mise à jour des plannings rapide et intuitive.
- Suivi des jalons : Vous pouvez définir et visualiser les étapes clés du projet afin que tout le monde sache comment avance le travail.
- Allocation des ressources : Vous pouvez affecter des membres de l’équipe ou des ressources à des tâches spécifiques, éviter la surcharge d’un collaborateur et assurer la cohésion de l’équipe.
- Personnalisation de l’affichage et de la chronologie : Vous pouvez ajuster la vue des heures aux mois pour zoomer sur les détails ou prendre du recul selon les besoins.
- Suivi de la progression : Ceci permet de suivre le pourcentage d’avancement de chaque tâche pour toujours savoir où en est le projet.
- Outils de collaboration : Vous pouvez inviter des collègues, laisser des commentaires ou partager des mises à jour pour simplifier le travail d’équipe et fluidifier la communication.
- Options d’exportation et de partage : Cela vous permet de créer des PDF, des liens ou des images exportables de vos diagrammes et de partager les plannings avec clients ou collègues.
- Code couleur : Vous pouvez utiliser des couleurs pour classer les tâches selon l’équipe, la priorité ou la phase, et ainsi garder un diagramme organisé.
- Mise en avant du chemin critique : Cette fonction vous aide à repérer la série de tâches ayant un impact direct sur la date de fin du projet, pour vous concentrer sur ce qui est le plus urgent.
Fonctionnalités d’IA à rechercher dans un créateur de diagrammes de Gantt
De nombreux créateurs de diagrammes de Gantt intègrent également des fonctionnalités intelligentes basées sur l’IA pour vous faire gagner du temps et améliorer l’efficacité :
- Planification automatisée : Vous pouvez laisser l’IA suggérer des séquences de tâches et des calendriers optimaux en fonction des exigences du projet, des délais et de la disponibilité des ressources.
- Analyse prédictive : Vous recevrez des prévisions sur d’éventuels retards ou risques grâce à l’analyse des données historiques et des tendances actuelles du projet.
- Allocation intelligente des ressources : Vous pouvez obtenir des recommandations pilotées par l’IA pour l’attribution des membres de l’équipe ou des ressources afin d’équilibrer les charges de travail et d’éviter les conflits.
- Saisie en langage naturel : Cela vous permet de décrire votre projet en français courant et l’IA générera pour vous un brouillon de diagramme de Gantt sans nécessiter de saisie manuelle de données.
- Mises à jour automatisées de l’avancement : L’IA peut suivre l’achèvement des tâches et mettre automatiquement à jour votre diagramme en s’intégrant à d’autres outils de gestion de projet, ou même en analysant les communications de l’équipe.
- Notifications intelligentes : Vous recevrez des rappels proactifs et des alertes sur les échéances à venir, les obstacles potentiels ou les modifications de planning.
- Planification de scénarios : Vous pouvez utiliser l’IA pour modéliser des scénarios « et si » et voir comment les changements de périmètre, de ressources ou de dates peuvent affecter votre calendrier.
- Priorisation des tâches : Vous recevrez des suggestions sur les tâches à prioriser selon les interdépendances, les échéances et la capacité de votre équipe, pour garder votre projet sur la bonne voie.
Bien que ces fonctionnalités soient courantes dans cette catégorie de logiciels, les produits évoluent constamment. Ainsi, prenez en compte la fréquence à laquelle le produit est mis à jour. Comme le souligne Robyn Birkedal :
Un élément à garder à l’esprit est la fréquence de mise à jour d’un outil. Les nouvelles fonctionnalités peuvent être formidables, mais si vous ne suivez pas le rythme, il peut être difficile de ne pas se sentir dépassé lorsque l’interface change de façon inattendue.
Avantages des logiciels de création de diagrammes de Gantt
Voici cinq avantages principaux des logiciels de gestion de diagrammes de Gantt :
- Gestion de projet rationalisée : Un logiciel de diagramme de Gantt offre une plateforme centrale pour la gestion de toutes les tâches du projet. Cette approche centralisée vous permet de suivre l’avancement des tâches, l’allocation des ressources et les échéances, tout en contribuant à améliorer la livraison des projets.
- Collaboration d’équipe améliorée : Les membres de l’équipe peuvent partager des mises à jour, donner leur avis et maintenir une communication claire. Ainsi, chacun reste aligné sur les objectifs du projet et productif.
- Allocation efficace des ressources : Un logiciel de diagramme de Gantt permet de visualiser et de gérer efficacement la répartition des ressources. En attribuant les ressources de manière stratégique, vous optimisez leur utilisation, améliorez les résultats des projets et évitez la surcharge.
- Identification et réduction des risques projets : Grâce à l’analyse avancée, le logiciel permet de repérer rapidement les obstacles potentiels et de gérer les risques. Vous pouvez ainsi résoudre les problèmes de façon proactive et minimiser les retards.
- Prise de décision éclairée : Avec des rapports complets et des analyses, le logiciel de diagramme de Gantt fournit à vous et à vos parties prenantes les données nécessaires pour prendre des décisions avisées. Vous éliminez les suppositions et guidez ainsi vos projets vers le succès en vous appuyant sur des preuves solides.
Coûts et tarification des logiciels de création de diagrammes de Gantt
Vous trouverez ci-dessous un tableau présentant les différentes options de forfaits et leur tarification pour les logiciels de diagramme de Gantt :
| Nom du forfait | Prix (par utilisateur/mois) | Fonctionnalités |
|---|---|---|
| Gratuit | $0 | Fonctionnalités de base de diagramme de Gantt, nombre limité d’utilisateurs et de projets |
| Basique | $5 - $10 | Création de diagrammes de Gantt, dépendances de tâches, rapports de base, utilisateurs et projets limités |
| Standard | $10 - $20 | Fonctionnalités avancées de Gantt, planification des tâches, gestion des ressources, utilisateurs/projets multiples |
| Premium | $20 - $50 | Planification avancée, diagrammes de Gantt personnalisables, intégrations, utilisateurs/projets illimités |
Les principales étapes où votre entreprise peut envisager de passer à un plan tarifaire supérieur comprennent :
- Augmentation de la complexité des projets : Lorsque les projets deviennent plus complexes, vous devrez peut-être passer à un niveau de tarification supérieur pour accéder à des fonctionnalités avancées.
- Extension de l'équipe : À mesure que votre équipe s'agrandit, il peut être nécessaire de passer à une formule supérieure pour ajouter plus de licences utilisateurs, bénéficier d'outils de collaboration améliorés et d'une gestion des droits plus sophistiquée.
- Besoins d'intégration : Lorsque vous souhaitez intégrer votre logiciel de diagramme de Gantt avec d'autres outils comme un CRM, un ERP ou des suites de gestion de projet, une montée en gamme vers une formule supérieure permet d'obtenir des capacités d'intégration avancées.
- Exigences en matière de données et de rapports : Vous devrez peut-être opter pour une offre de tarif supérieure si vous avez besoin de rapports avancés, d'analyses et de fonctionnalités de visualisation de données.
- Support client et formation : Des niveaux plus élevés de support client, de formation et d'accompagnement deviennent indispensables à mesure que votre entreprise se développe, car cela vous permettra d'utiliser l'outil efficacement et d'en maximiser les bénéfices.
FAQ sur les créateurs de diagrammes de Gantt
Trouvez des réponses aux questions fréquentes sur ce sujet.
Quel est le meilleur logiciel gratuit de diagramme de Gantt ?
Le meilleur logiciel gratuit de diagramme de Gantt dépend de vos cas d’utilisation spécifiques, mais parmi les plus populaires figurent des outils comme ClickUp, TeamGantt et GanttProject. Chacun propose un niveau gratuit avec des fonctionnalités de base telles que la planification des tâches et la visualisation des plannings.
ClickUp se distingue par la flexibilité de ses vues projet et le nombre illimité d’utilisateurs. TeamGantt offre une interface intuitive de glisser-déposer, mais limite les utilisateurs gratuits à un projet à la fois. GanttProject est entièrement gratuit à télécharger. Tenir compte de la taille de votre équipe et de la complexité de vos projets vous aidera à choisir la bonne option gratuite selon vos besoins.
Comment les diagrammes de Gantt se comparent-ils aux tableaux Kanban pour la gestion des tâches ?
Les diagrammes de Gantt vous aident à planifier et à suivre les projets à l’aide de plannings, de dépendances et de jalons. Ils sont idéals pour programmer et visualiser comment les tâches se chevauchent.
Les tableaux Kanban se concentrent sur les flux de travail et utilisent des colonnes pour afficher le statut des tâches ; ils conviennent mieux au travail axé sur la tâche impliquant de nombreux transferts. Si vous avez besoin de visualiser les échéances et les dépendances d’ensemble, les diagrammes de Gantt sont préférables. De nombreux chefs de projet utilisent les deux : le Kanban pour le travail au quotidien, et un diagramme de Gantt pour une vue d’ensemble du projet.
Quelles sont les bonnes pratiques pour mettre à jour un diagramme de Gantt en cours de projet ?
Mettez régulièrement à jour votre diagramme de Gantt (au moins chaque semaine) pour qu’il reste précis et reflète les véritables changements. Passez en revue l’état des tâches, ajustez les échéances en cas de retards et communiquez les modifications à votre équipe.
Utilisez le codage couleur ou les commentaires pour mettre en avant les changements et clarifications. La plupart des outils prennent en charge les mises à jour automatiques avec notifications. Des mises à jour cohérentes vous aident à repérer les goulots d’étranglement, à garder l’équipe alignée et à éviter les mauvaises surprises à l’approche des échéances.
Quelles sont les principales différences entre les créateurs de diagrammes de Gantt gratuits et payants ?
Les outils gratuits de diagramme de Gantt limitent généralement le nombre d’utilisateurs, de projets actifs, d’intégrations, ou de fonctionnalités avancées telles que les rapports et la gestion des ressources. Les versions payantes offrent plus d’options de collaboration, d’automatisation, de champs personnalisés et un meilleur support technique.
Si vous gérez de nombreux projets ou avez besoin de fonctionnalités comme le suivi des charges de travail et les intégrations, il vaut mieux opter pour une offre payante. Commencer par une version gratuite est une bonne manière d’évaluer si un outil vous convient, mais vous devrez passer à une version supérieure si votre équipe et vos projets deviennent plus complexes.
Puis-je intégrer un créateur de diagrammes de Gantt avec d'autres outils de gestion de projet ?
Oui, la plupart des créateurs de diagrammes de Gantt s’intègrent à d’autres outils de gestion de projet comme Asana, Trello, Slack et Google Workspace. Les intégrations vous aident à synchroniser les tâches, automatiser les flux de travail et réduire les mises à jour manuelles ou en double entre plateformes.
Consultez le marketplace ou les paramètres du logiciel pour découvrir les options d’intégration. Si votre équipe utilise déjà un outil de gestion de projet principal, il propose peut-être des diagrammes de Gantt intégrés, sinon cherchez un logiciel de diagramme de Gantt offrant une connexion native ou via Zapier.
Comment puis-je gérer l'allocation des ressources avec un logiciel de diagramme de Gantt ?
La plupart des outils de diagramme de Gantt permettent d’assigner des tâches, de suivre les charges et de visualiser la capacité de l’équipe. Affectez les ressources (membres de l’équipe ou équipements) directement sur l’échéancier des tâches. Vous pouvez utiliser les fonctions de vue charge de travail ou d’histogramme de ressources pour repérer les membres surchargés ou les périodes creuses. Révisez régulièrement les affectations pour garder un équilibrage correct et éviter la surcharge ou les retards.
Quels critères prendre en compte pour choisir un créateur de diagramme de Gantt pour mon équipe ?
Privilégiez une interface intuitive, des fonctionnalités collaboratives, des intégrations et le prix. Vérifiez que l’outil propose le glisser-déposer, le suivi des dépendances et des options d’export.
Vérifiez s’il prend en charge le suivi du temps, les mises à jour en temps réel et la messagerie d’équipe. Choisissez une solution adaptée à la taille de vos projets et au niveau de familiarité de votre équipe avec les diagrammes de Gantt. Vous pouvez toujours demander un essai gratuit ou tester des versions freemium avant de vous engager.
Existe-t-il des outils de diagrammes de Gantt adaptés à la gestion de projet agile ?
Oui, de nombreux créateurs de diagrammes de Gantt, comme ClickUp, Smartsheet et Wrike, proposent des fonctionnalités adaptées aux méthodes agiles. Recherchez la gestion du backlog, la planification des sprints et la flexibilité des échéanciers. Certains outils allient timelines de Gantt et tableaux agiles, vous permettant ainsi de mener des sprints tout en suivant les plannings et dépendances au niveau global. Cela facilite l’association des workflows agiles et d’une planification structurée.

Et ensuite ?
Vous souhaitez entrer en contact avec d'autres gestionnaires de projets digitaux pour partager des ressources et des bonnes pratiques ? Rejoignez notre communauté de membres et accédez à plus de 100 modèles, exemples et échantillons, tout en échangeant avec des centaines d'autres chefs de projet digital sur Slack.