Avis sur Supermetrics : Avantages, Inconvénients, Fonctionnalités et Tarifs Expliqués


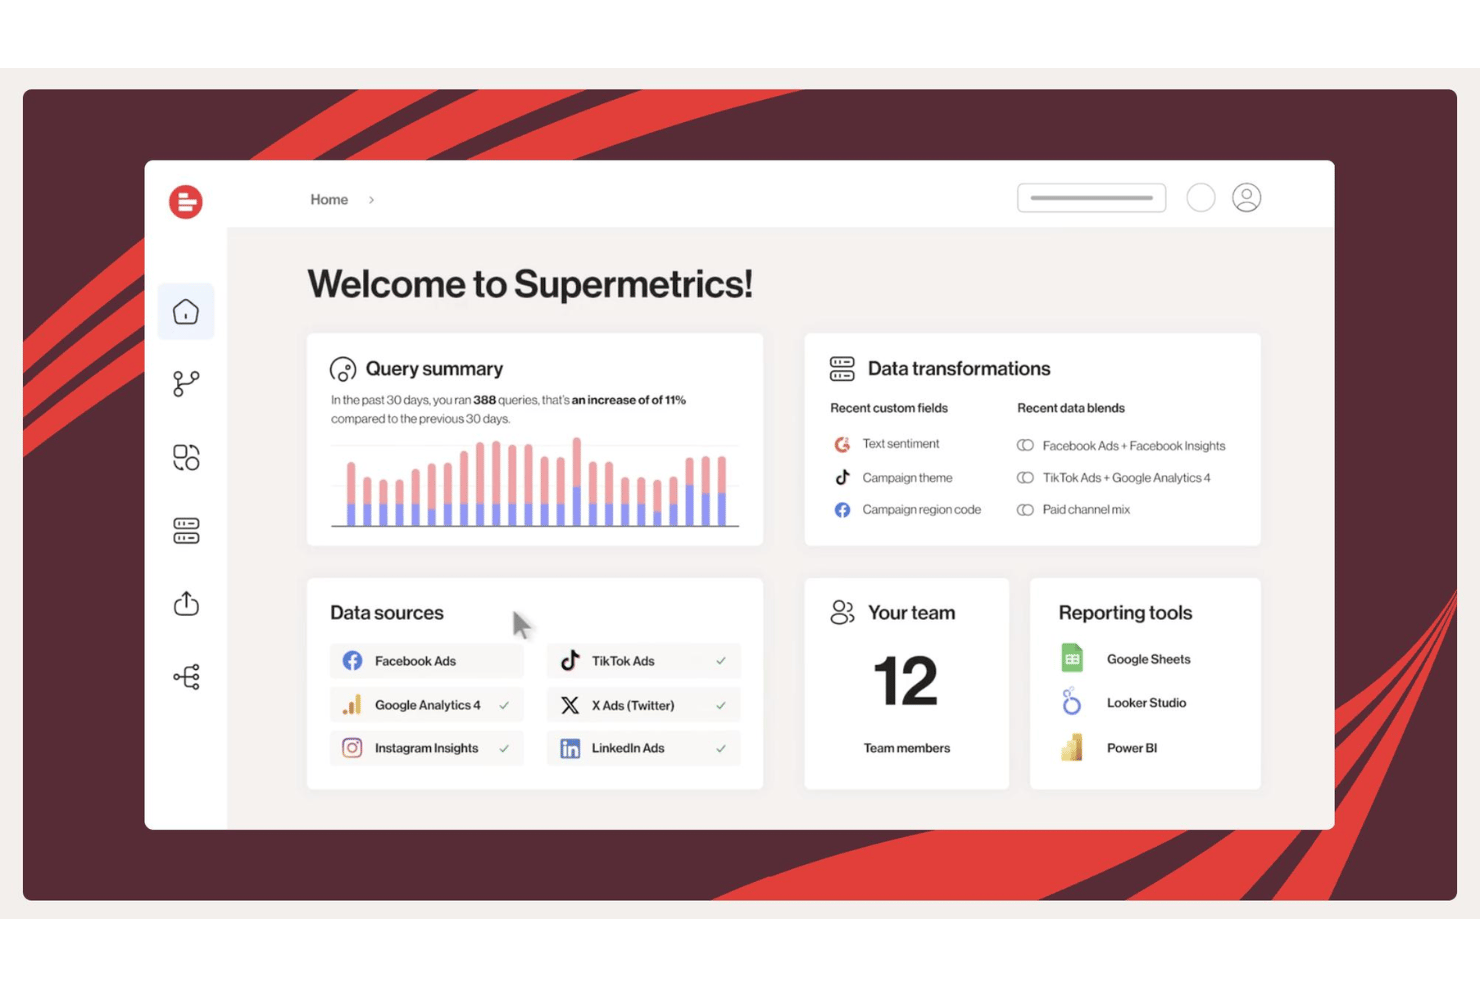
Supermetrics is a business intelligence tool built to automate data collection and reporting for marketers, analysts, and digital teams. If you’re trying to wrangle data from dozens of marketing platforms, keep dashboards current, or just make it easier to share insights, Supermetrics streamlines the heavy lifting by pulling all your data into one place—no coding or complex setup needed.
In this review, I’ll break down Supermetrics’s features, use cases, pros and cons, and give you a clear look at its pricing so you can decide if it belongs in your BI stack.
Supermetrics Evaluation Summary
- From $44/month (billed annually)
- 14-day free trial + free demo available
Pourquoi vous pouvez nous faire confiance
Nous testons et évaluons des logiciels de gestion de projet depuis 2012. En tant que chefs de projet, nous savons à quel point il est difficile et pourtant essentiel de faire le bon choix lors de la sélection d’un outil. Nous investissons dans la recherche approfondie pour aider notre audience à faire de meilleurs achats logiciels. Nous avons testé plus de 2 000 outils pour différents cas d’utilisation en gestion de projet et rédigé plus de 1 000 analyses complètes. Découvrez comment nous restons transparents & notre méthodologie d’évaluation des logiciels.
Supermetrics Overview
If I’m judging business intelligence tools for digital marketing teams, I think Supermetrics stands out for its deep integration set, simple onboarding, and robust data blending capabilities. You’ll find the interface easy to navigate, and support is reliable. Pricing can add up for larger data loads, and customization isn’t as deep as some alternatives, but I’d choose Supermetrics for teams who want fast, automated reporting from dozens of sources without heavy IT involvement. If you prioritize speed over advanced modeling, Supermetrics is a solid choice.
pros
-
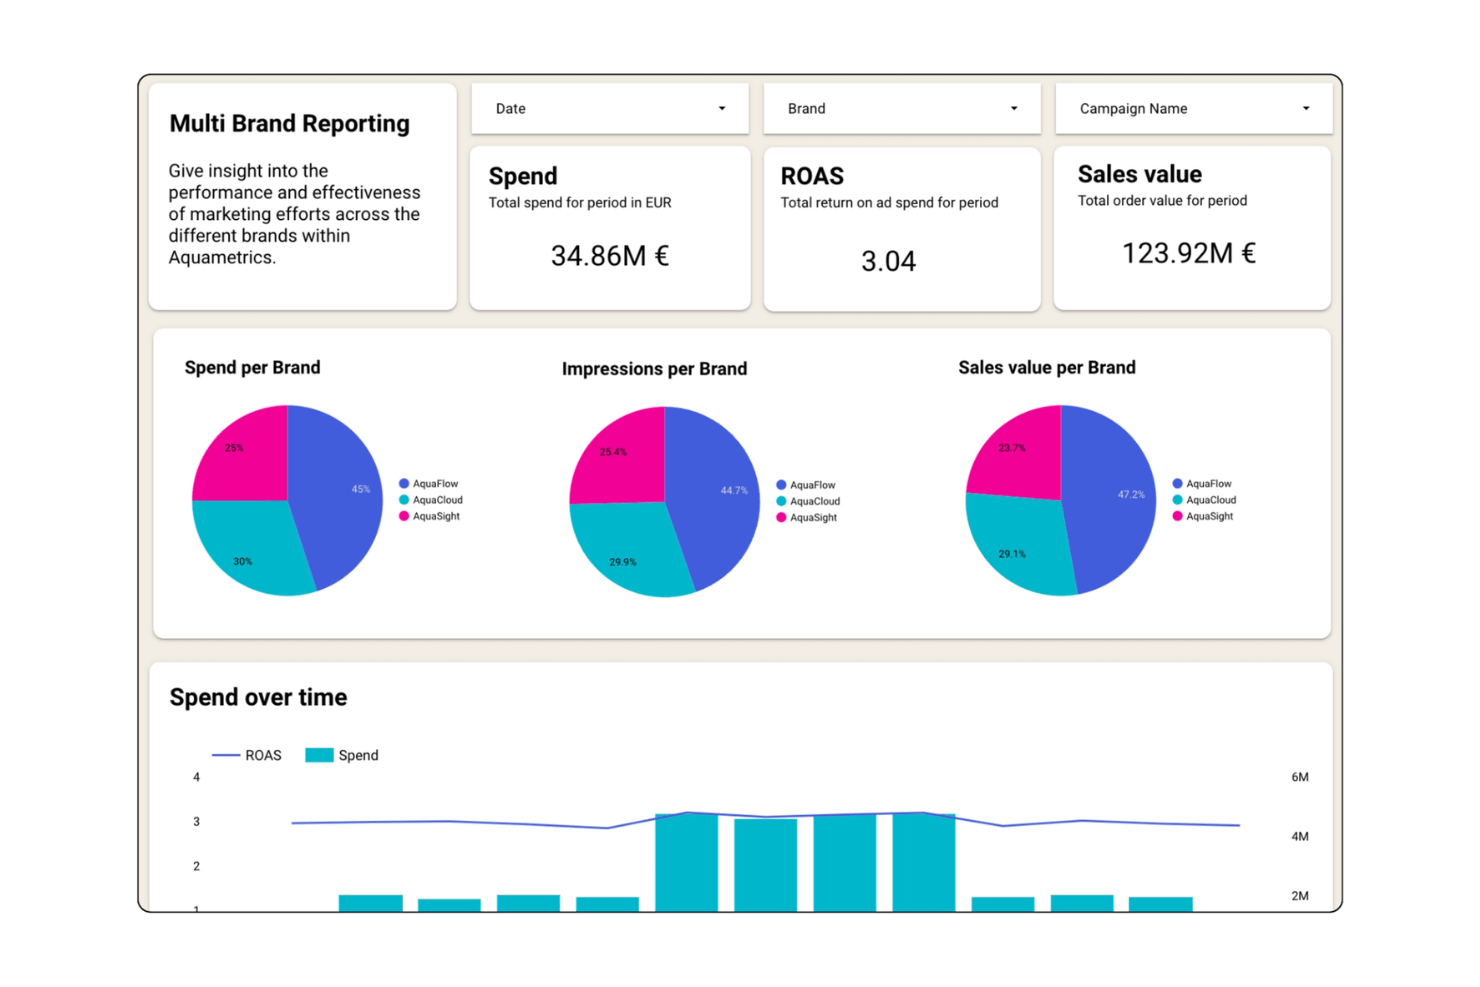
Automates multi-source marketing data into Google Sheets and Looker Studio
-
Flexible scheduling options for report refresh and delivery
-
Handles high volumes of campaign and analytics data well
cons
-
Advanced data blending is limited compared to some BI platforms
-
Pricing increases quickly as data volume scales up
-
Visualizations are basic compared to dedicated BI tools
-

Accelo
Visit WebsiteThis is an aggregated rating for this tool including ratings from Crozdesk users and ratings from other sites.4.4 -
Celoxis
Visit WebsiteThis is an aggregated rating for this tool including ratings from Crozdesk users and ratings from other sites.4.4 -
Wrike
Visit WebsiteThis is an aggregated rating for this tool including ratings from Crozdesk users and ratings from other sites.4.3


Notre méthodologie d'évaluation
Comment nous testons et notons les outils
Nous avons passé des années à construire, affiner et améliorer notre système de test et de notation de logiciels. Notre grille d’évaluation est conçue pour capturer les subtilités de la sélection de logiciels et ce qui rend un outil efficace, en mettant l’accent sur les aspects critiques de la prise de décision. Ci-dessous, vous pouvez voir exactement comment notre processus de test et de notation fonctionne sur sept critères. Cela nous permet de fournir une évaluation impartiale des logiciels selon leur fonctionnalité principale, leurs fonctionnalités remarquables, leur facilité d’utilisation, l’onboarding, le support client, les intégrations, les avis clients et le rapport qualité/prix.
Fonctionnalités principales (25 % du score final)
Le point de départ de notre évaluation est toujours la fonctionnalité principale de l’outil. Dispose-t-il des fonctionnalités et caractéristiques de base attendues par l’utilisateur ? Certaines de ces fonctionnalités de base sont-elles réservées aux formules tarifaires supérieures ? Nous nous attendons à ce qu’un outil soit à la hauteur des capacités de base de ses concurrents.
Fonctionnalités remarquables (25 % du score final)
Ensuite, nous évaluons les fonctionnalités remarquables et peu communes qui vont au-delà de la fonctionnalité de base habituellement retrouvée dans ce type d’outils. Un score élevé reflète des fonctionnalités spécialisées ou uniques qui rendent le produit plus rapide, plus efficace, ou offrent une valeur supplémentaire à l’utilisateur. Nous évaluons également la facilité d’intégration avec d’autres outils couramment présents dans l’environnement technique pour étendre la puissance et l’utilité du logiciel. Les outils offrant de nombreuses intégrations natives, des connexions tierces et un accès API pour créer des intégrations personnalisées obtiennent la meilleure note.
Facilité d’utilisation (10 % du score final)
Nous considérons la rapidité et la facilité d’exécution des tâches principales à l’aide de l’outil. Un logiciel bien noté est conçu intelligemment, intuitif à utiliser, propose des applications mobiles, fournit des modèles et simplifie les tâches relativement complexes.
Onboarding (10 % du score final)
Nous savons à quel point l’adoption rapide par l’équipe est cruciale lors de la mise en place d’une nouvelle plateforme. Nous évaluons donc la facilité avec laquelle un utilisateur peut apprendre et utiliser le logiciel avec un minimum de formation. Nous vérifions la rapidité avec laquelle un membre peut s’installer et démarrer sans expérience préalable. Les solutions ayant une note élevée nécessitent peu ou pas de support.
Support client (10 % du score final)
Nous examinons la rapidité et la facilité d’obtention d’une aide par téléphone, chat en direct ou base de connaissances. Les outils et sociétés proposant un support en temps réel obtiennent la meilleure note, tandis que les chatbots sont les moins bien notés.
Avis clients (10 % du score final)
Au-delà de nos propres tests et évaluations, nous tenons compte du net promoter score des clients actuels et passés. Nous étudions la probabilité, pour eux, de choisir à nouveau l’outil pour ses fonctionnalités principales. Un logiciel ayant une note élevée reflète un score NPS élevé de la part des utilisateurs actuels ou passés.
Rapport qualité/prix (10 % du score final)
Enfin, en tenant compte de tous les autres critères, nous comparons le prix moyen des forfaits d’entrée de gamme aux fonctionnalités principales et considérons la valeur des autres critères d’évaluation. Un logiciel qui en offre davantage pour moins cher sera mieux noté.
Core Features
Automated Data Transfers
Schedule recurring transfers of marketing data into spreadsheets or dashboards with no manual export required. This keeps your reports up to date without extra steps.
Custom Data Mapping
Map and transform fields from multiple sources within a single pipeline. This lets you standardize metrics and dimensions even if source naming differs.
Query-Based Data Filtering
Apply detailed filters when pulling data so you only fetch what matters. Filter by campaign, platform, or custom parameters for tailored datasets.
Historical Data Retrieval
Import large volumes of historical data from connected platforms. You get a complete view for trend and performance analysis.
Data Source Monitoring
Track the status and performance of every connected data source. Get alerts if a data pull fails so you can react quickly.
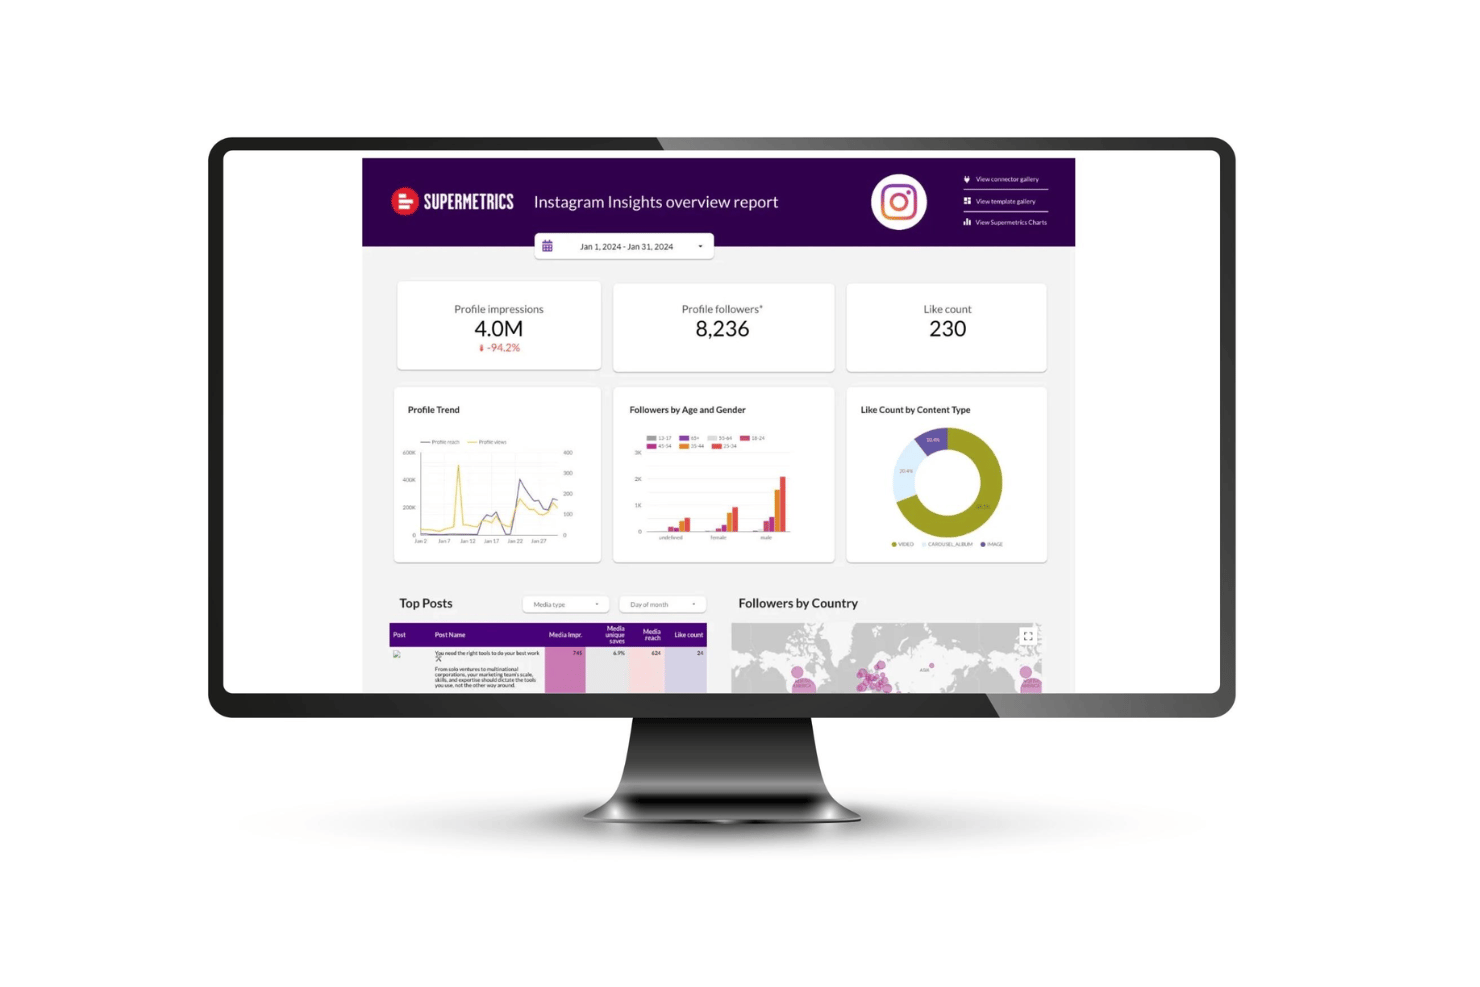
Pre-Built Reporting Templates
Use ready-made templates for popular marketing and analytics reports. This accelerates adoption and helps visualize data without building dashboards from scratch.
Ease of Use
Supermetrics is user-friendly for non-technical teams, thanks to a clean interface and no-code setup for data pipelines. I think the report scheduling, template library, and step-by-step data connection guide let most users skip manual data pulls or SQL. Most user reviews agree that setup is fast and daily use requires little support.
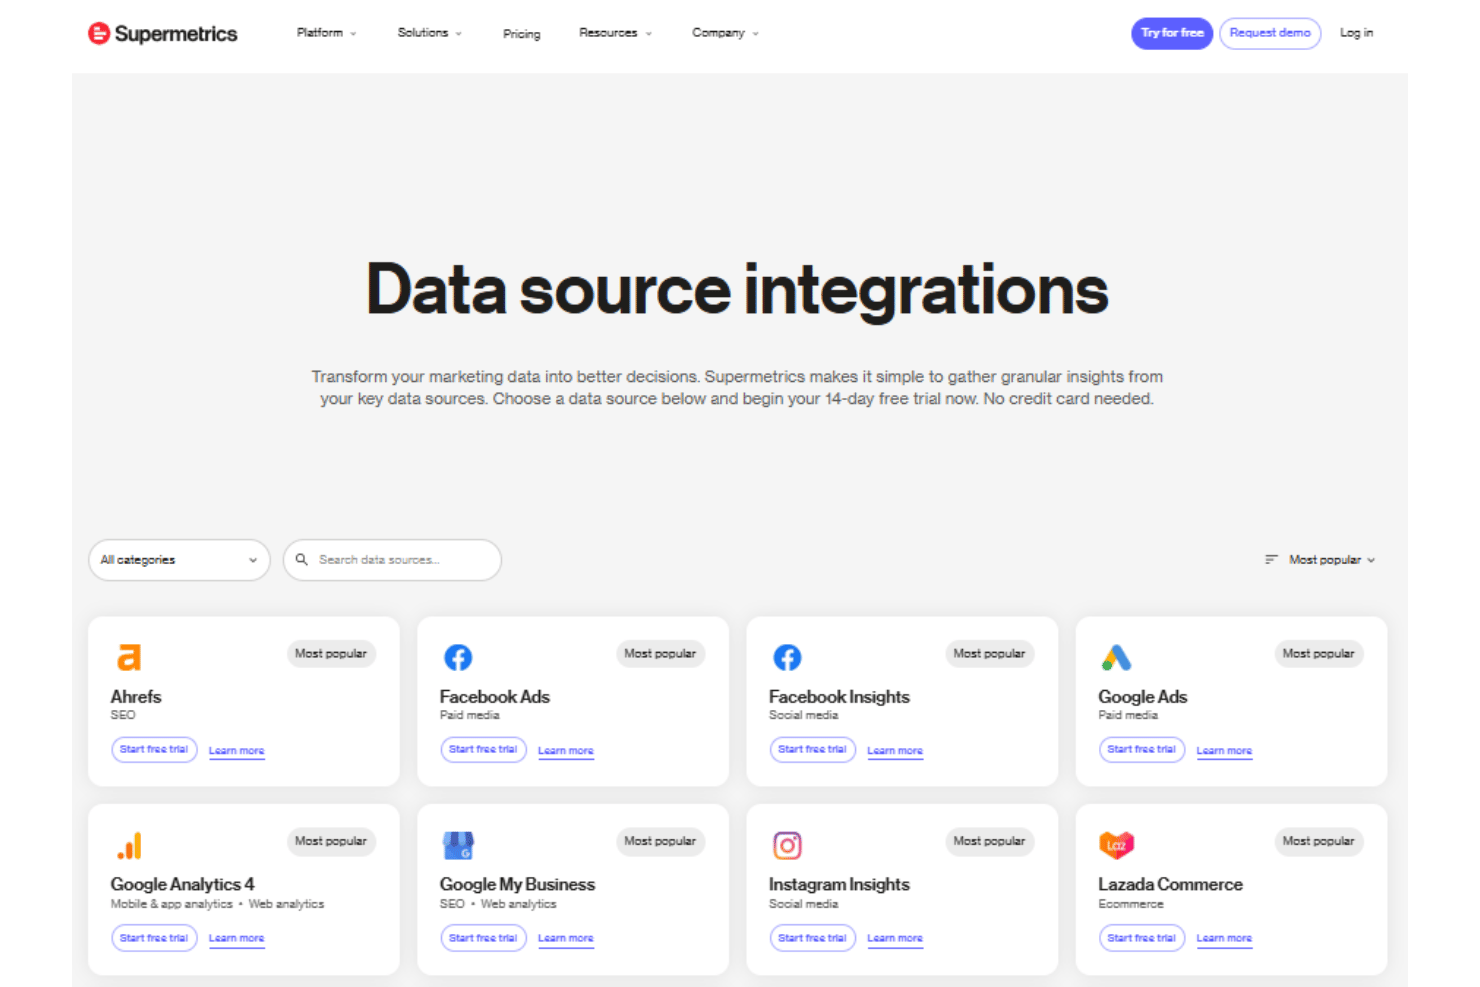
Integrations
Supermetrics integrates with Ahrefs, Marketo, Google Analytics 4, Google Ads, Facebook Ads, Shopify, and HubSpot, among many others.
Supermetrics also offers an API and connects with data warehouses and cloud storage platforms.
Supermetrics Specs
- API
- Audience Targeting
- Brand Management
- Conversion Tracking
- Data Export
- Data Import
- External Integrations
- Keyword Tracking
- Lead Management
- Lead Scoring
- Link Tracking
- Marketing Automation
- Multi-User
- Net Promoter Score
- Notifications
- Social-Media Integration