10 Raporlama Aracını Test Ettim: 2026 İçin En İyi Seçimlerim

10 En İyi Raporlama Araçları Listesi


Görünüşe göre sayısız raporlama aracı mevcut; bu nedenle hangisinin sizin için en iyi olduğunu belirlemek zor olabilir. Verileri ekibinizle mümkün olan en erişilebilir ve doğru şekilde paylaşmak istiyor, ancak hangi aracın ihtiyaçlarınıza en uygun olduğunu bulmanız gerekiyor. Yardımcı olabilirim!
Bu yazıda, büyük projelerden iş büyütmeye kadar çeşitli amaçlarla farklı proje yönetimi raporlama araçlarını kullanma deneyimimden yararlanarak işleri basitleştiriyor ve size en iyi raporlama araçlarının kısa listesini sunuyorum.
Why Trust Our Software Recommendations
Our team has been testing and reviewing software since 2012. As project managers ourselves, we know how difficult—and important—it is to choose the right software.
For this guide, we evaluated tools using hands-on testing and independent research, scoring tools using our selection criteria. We also draw on insights from industry thought leaders and practicing project management experts.
Our reviews reflect our human editorial judgment, not a sales pitch.
Expert reviewers:
Raporlama Araçları Karşılaştırma Tablosu
En iyi raporlama aracı seçimlerimin fiyatlandırma ayrıntılarını bu karşılaştırma tablosunda özetliyorum:
| Tool | Starting Price | Website | |
|---|---|---|---|
| Best reporting tool for easy-to-read charts | 4.3 out of 5 | $30/month 15-day free trial | Website |
| Best reporting software for small business accounting | 4.0 out of 5 | $38/month Free plan + 30-day trial available | Book Demo |
| Unlimited users, data sources, and integrations in all plans. | 4.8 out of 5 | $44/mo Free trial available | Website |
| Best for automated reporting without an analyst | 5.0 out of 5 | $29/month Free plan available | Website |
| Best reporting tool for agile teams | 4.7 out of 5 | €17.50/user/month Free plan + 14-day free trial available | Website |
| Best reporting software for embedded analytics | 4.5 out of 5 | Pricing upon request 14-day free trial | Website |
| Best for quickly generating digital marketing dashboards and reports | 4.7 out of 5 | $14.50/month 3 days free trial | Website |
| Best for BI tool integration | 4.5 out of 5 | Pricing upon request Free demo available | Website |
| Best for easy PowerPoint reports | 4.5 out of 5 | Pricing upon request Free plan available | Website |
| Best reporting tool for marketing agencies | 4.5 out of 5 | $812/month Free demo available | Website |
En İyi Raporlama Araçlarına Genel Bakış
Aşağıda her bir aracın açıklamasını, rapor oluşturma sürecini nasıl yönettiğini ve bu listeye neden dahil edildiğini bulabilirsiniz. Aracın kullanıcı perspektifinden nasıl göründüğü hakkında fikir sahibi olmanız için ekran görüntülerini de ekledim.

Best reporting tool for easy-to-read charts
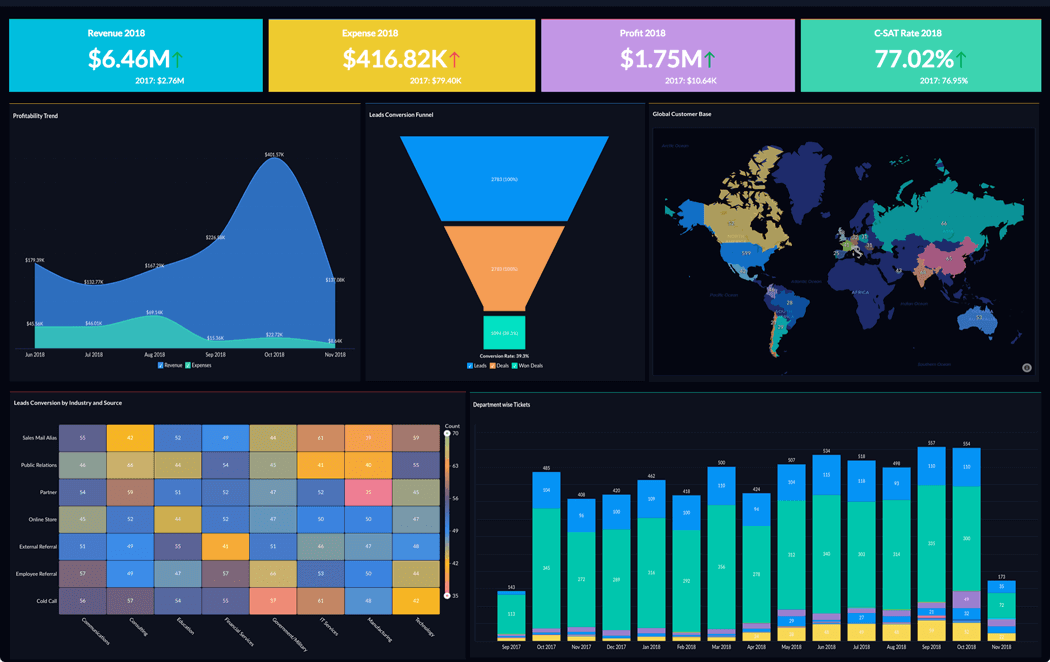
Zoho Analytics is an analytics and reporting tool to help you convert raw business data into comprehensive reports and dashboards. You can use it to collect, enrich, and filter data to make it easier to analyze. It has an AI assistant feature to help you generate insights, spot patterns, and forecast trends. Zoho Analytics has a mobile app version that works on iOS and Android.
Zoho Analytics lets you use charts, widgets, and pivot tables ensuring you can present data in the best possible way. Zoho Analytics allows you to collaborate with other users to build and share custom reports and dashboards. Its user permission settings give you control over who can view and edit your data according to need and/or authority.
Zoho Analytics cost starts at $24/month/up to 2 users. They offer a 15-day free trial.
New Product Updates from Zoho Analytics

Zoho Analytics Adds Exogenous Variables to Multivariate Forecasting
Zoho Analytics introduces exogenous variables for multivariate forecasting using the VARX model. This helps forecasts account for external drivers such as marketing spend, discounts, and seasonality. For more information, visit Zoho Analytics’ official site.
 .

Best reporting software for small business accounting
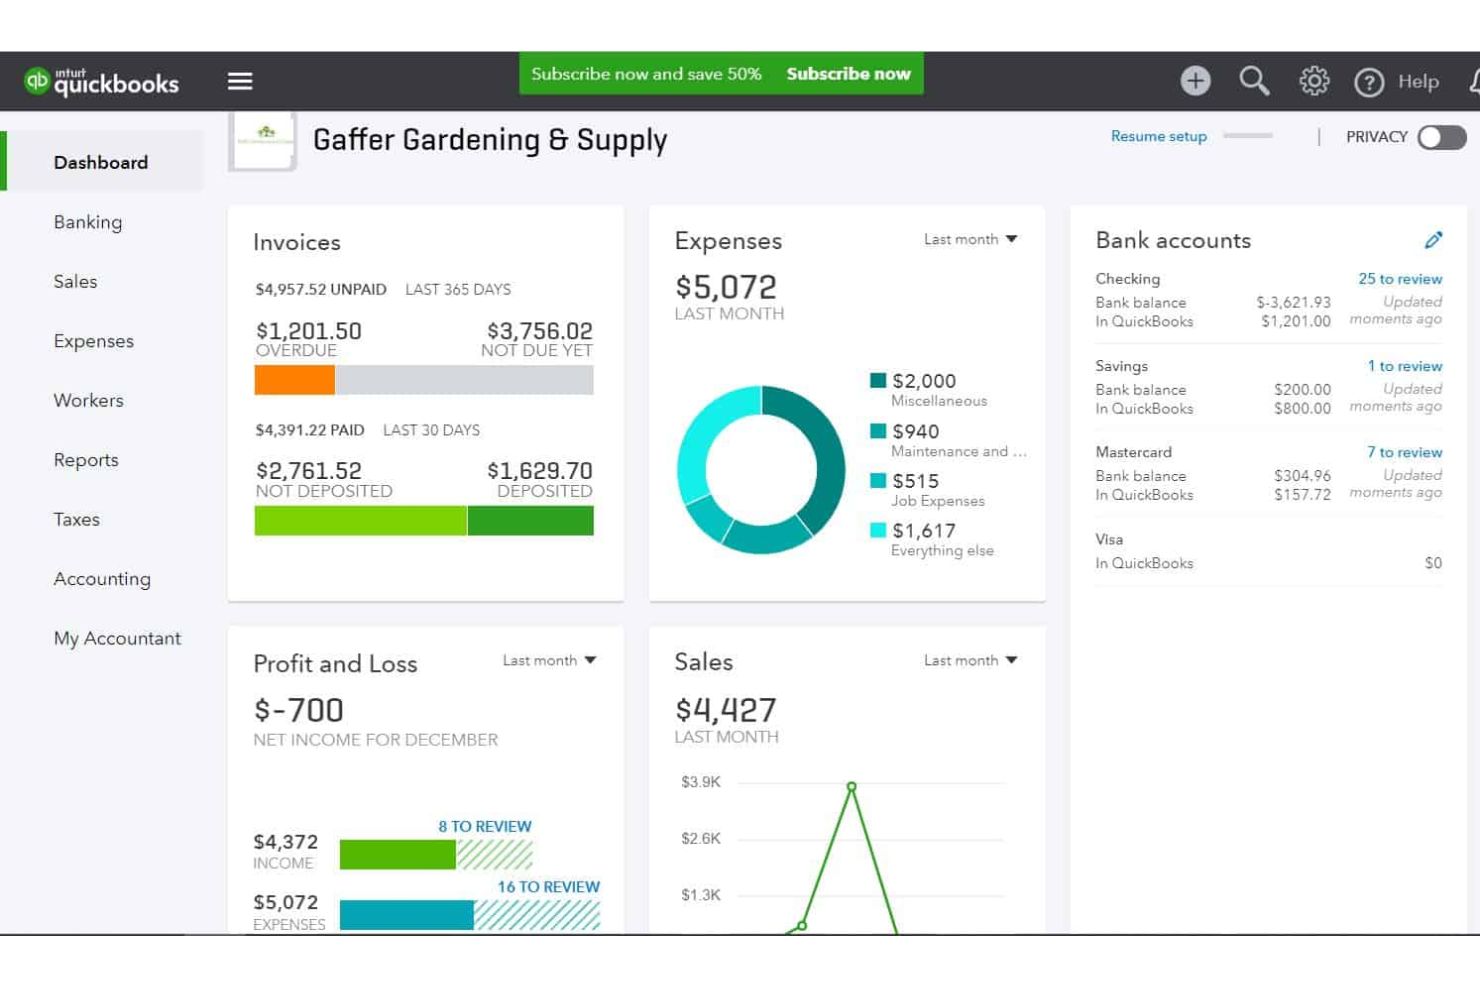
QuickBooks is an accounting solution that helps small businesses track their expenses, manage their invoicing, and report on their financials. The software tracks your transaction details, helping you keep accurate records. Based on the finances you track in the system, you can view how much you're spending in each expense category from your dashboard.
The platform offers a simple, low-cost expense reporting solution for small- and medium-sized businesses. Receipts are sorted automatically, and you can reclassify transactions in bulk. You can also generate invoices, and even set up recurring invoices for repeat clients or customers.
QuickBooks Online integrates with over 450 business apps like Square, Stripe, Paychex, Insightly CRM, Mailchimp, Shopify, eBay, BigCommerce, Magento, Squarespace, Etsy, Katana, and ProjectWorks. Pricing starts from $30 per month, and a 30-day free trial is available.
New Product Updates from QuickBooks Online
QuickBooks Online Advanced Expands Job Costing and Desktop Workflows
QuickBooks Online Advanced expands construction job costing, inventory management, and Desktop-style workflows while adding guided migration support. These updates give growing businesses more operational depth without leaving QuickBooks Online. For more information, visit QuickBooks Online Advanced’s official site.
 .

DashThis
Unlimited users, data sources, and integrations in all plans.

DashThis is an automated marketing reporting tool that lets you bring multiple platforms into one, co-create powerful dashboards, and automate their delivery. The features included in the product can help anyone from freelancers to world-renowned agencies like DDB.
The first thing I immediately liked about this product is that all their plans have unlimited users, data sources, and integrations. The difference comes in the number of dashboards you can create and the level of customization in white-label reports.
Since reporting can be one of our most time-consuming activities, DashThis has prepared a bunch of templates that help you get started right away. You just have to select the template you prefer, plug in your data, and run the report on your preferred time periods. Once you find your perfect report, you can clone it, export it, or generate and share it automatically via email to your clients every month.
DashThis has over 34 useful integrations that will help you bring all your marketing data into one place and extract comprehensive reports. These integrations include social media platforms, Google Analytics, SEMrush, Mailchimp, Perfect Audience, TikTok Ads, and more.
DashThis starts at $38/month (paid annually) for 3 dashboards and comes with a free 15-day trial (10 dashboards).
New Product Updates from DashThis

DashThis Adds AI-Powered Custom Data Sources Through MCP
DashThis now lets you add custom data sources to dashboards using AI through Claude or ChatGPT via MCP, turning data from non-native tools, spreadsheets, emails, or screenshots into scheduled widgets. For more information, visit DashThis's official site.
 .

Signara
Best for automated reporting without an analyst
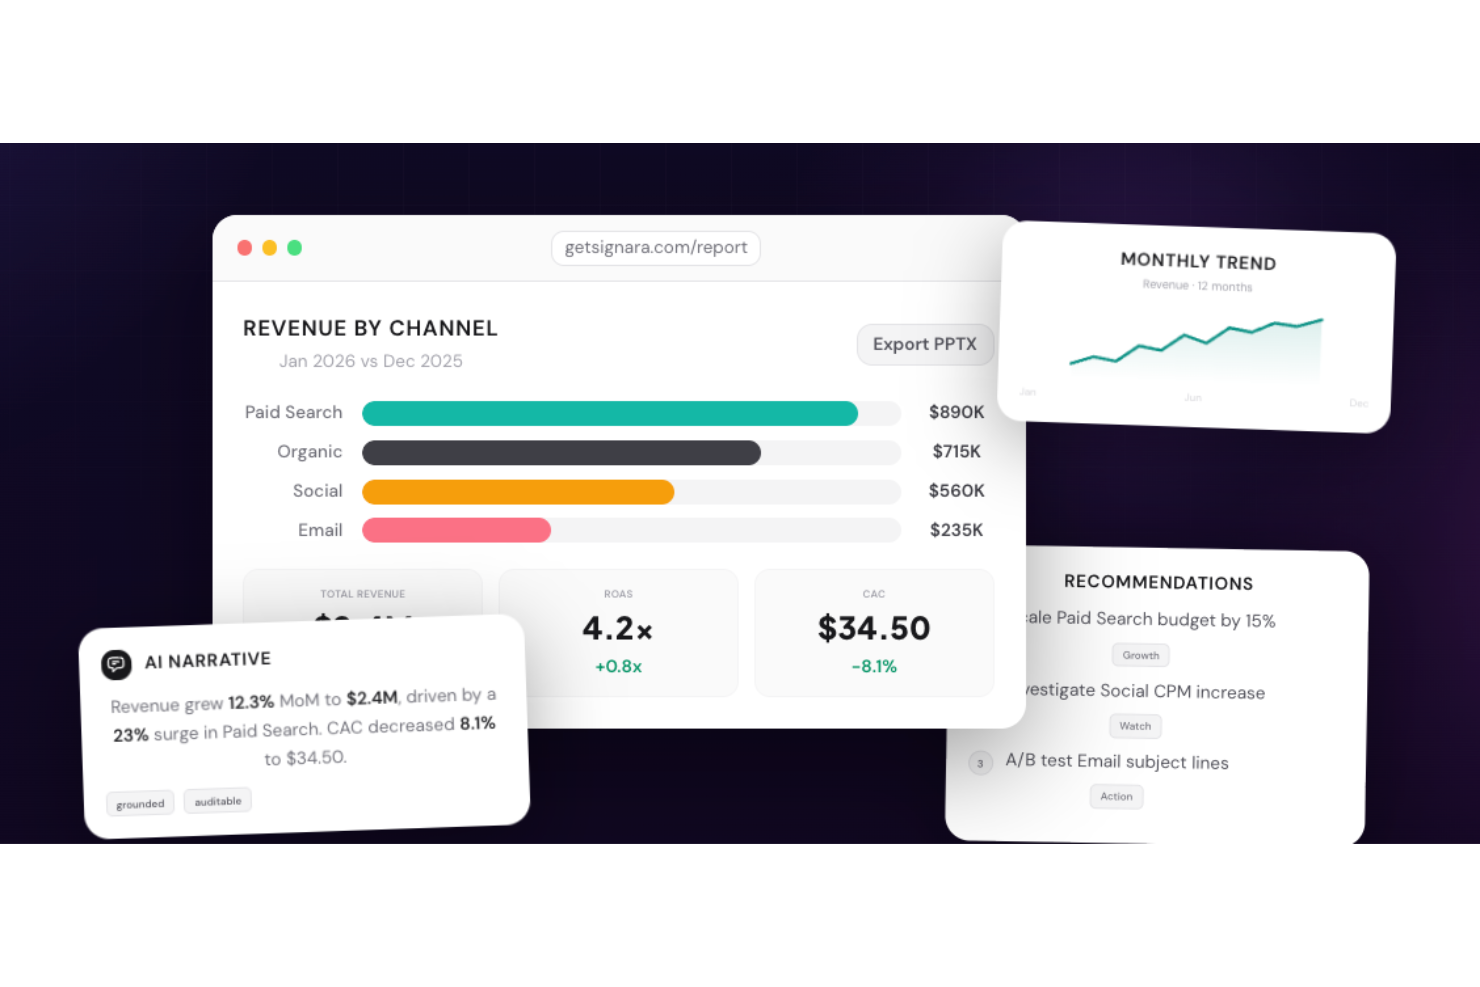
Signara is an AI-powered analytics reporting tool for marketing teams that automatically generates interactive dashboards and PPTX reports—complete with KPI calculations, driver analysis, and AI-written narratives—directly from connected data sources.
Who Is Signara Best For?
Signara is a good fit for marketing analysts and performance teams who need automated, presentation-ready reports without manual data wrangling.
Why I Picked Signara
I've included Signara in my top picks because its interactive dashboards make it easy to display any marketing KPI set in a format that's genuinely ready to share publicly. I can configure which metrics surface, how channels are grouped, and how period comparisons appear, so every display reflects the exact data story I want to tell. The AI-generated narratives also add context automatically, explaining what changed and why, which means public-facing dashboards don't just show numbers.
Signara Key Features
- PPTX report export: Generate a fully formatted, presentation-ready PowerPoint deck directly from your dashboard output in one click.
- Driver analysis: Signara's agent layer identifies what moved, why, and by how much across your marketing channels before the report is ever built.
- Deterministic KPI engine: Every metric is calculated using locked, auditable formulas in code, so no KPI is ever guessed or approximated.
- AI-generated recommendations: Alongside narrative summaries, Signara surfaces prioritized next steps, such as scaling a channel budget or investigating a CPM spike.
Signara Integrations
Signara offers native integrations with HubSpot, Snowflake, BigQuery, Databricks, PostgreSQL, MySQL, Google Sheets, and Google Analytics (GA4), and also supports drag-and-drop uploads for Excel and CSV files. An API is available for connecting additional data sources.
Pros and Cons
Pros:
- Reports generate without analyst involvement
- No raw data stored on platform
- AI narratives explain what changed and why
Cons:
- No mobile app for on-the-go access
- Limited to marketing and finance use cases
Best reporting tool for agile teams

MeisterTask is a task and project management tool designed primarily for agile teams. The tool offers a variety of reporting features for monitoring team productivity, as well as custom dashboards and the ability for team members to create personal agendas organized to fit their way of working. MeisterTask is intuitive and simple to use, with a clean interface
Users can view progress reports, time reports, and safety reports. View and download reports showing tasks that are completed, overdue, or upcoming. Project managers and team leads can also get reports on how much time team members are tracking, as well as reports related to data security, privacy, and compliance.
MeisterTask integrates with sister software MindMeister as well as Gmail, Outlook, Slack, Microsoft Teams, GitHub, Zendesk, Google Drive, and more.
MeisterTask costs from $8.25/user/month. They also offer a freemium plan.

Tableau
Best reporting software for embedded analytics

Tableau is a visual analytics platform for exploring, understanding, and managing business data. It uses a drag and drop method to create reports using the available data visualizations and widgets.Tableau uses interactive data visualizations so you can create visually-compelling reports that viewers can click to explore.
If you need to build powerful dashboards quickly, Tableau is the best reporting tool for you because of its embedded analytics features. The embedded analytics are customizable through an API so you can insert data collection and reporting functionality into your pre-existing workflow. This can also help you personalize your customers’ data experience.
Tableau integrates with other business tools, including Google Cloud, Microsoft SQL Server, Google Sheets, Hive, and SAP.
Tableau pricing starts at $12/user/month, and they offer a 14-day free trial.

Reportei
Best for quickly generating digital marketing dashboards and reports

Reportei generates digital marketing reports quickly, focusing on social media data and analytics. This tool is great for agencies, freelancers, and digital marketing professionals that need to save time on reporting and spend more time on analysis.
Reportei also offers a marketing timeline feature, allowing users to add events and milestones throughout the project to the timeline and categorize them to keep track of overall project progress.
Integrations include Facebook, Instagram, LinkedIn, YouTube, Facebook Ads, Instagram Ads, Google Ads, Google Analytics, and other channels.
Pricing starts at $14.50/month.

Adverity
Best for BI tool integration
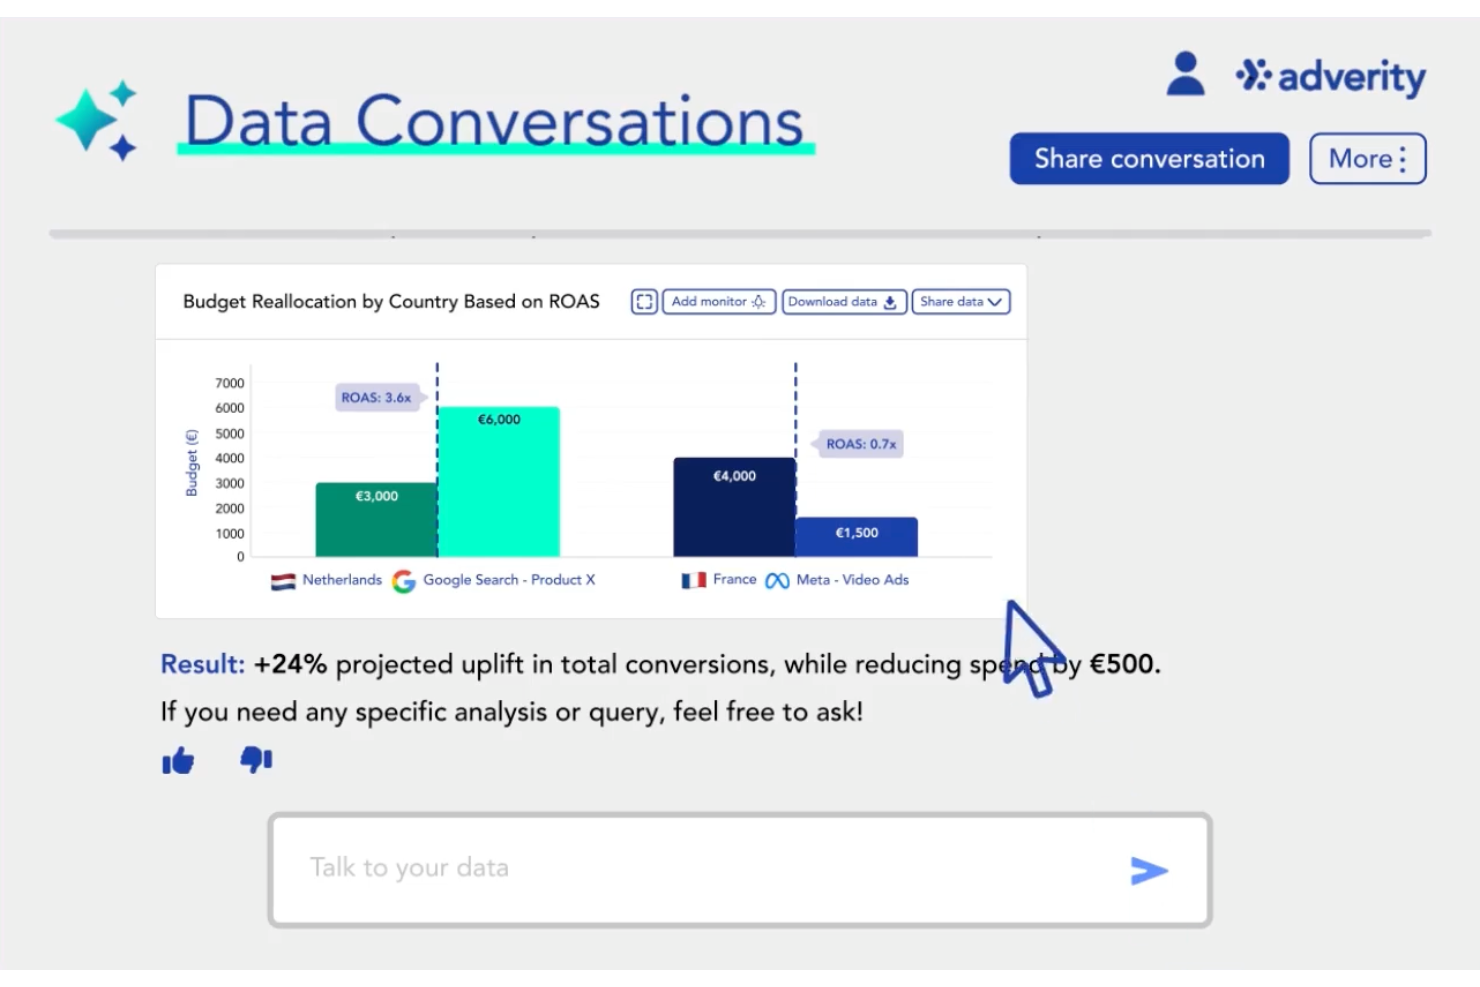
Adverity stands out as a versatile marketing intelligence platform tailored for businesses seeking to streamline their data management and reporting processes. It supports teams that rely on BI tool integration, helping connect marketing data pipelines with reporting platforms for analysis and visualization. If you're in a marketing or data analytics role, you might find Adverity particularly appealing for its ability to integrate data from a variety of sources, automate data workflows, and deliver insights that support more informed decision-making.
Why I Picked Adverity
I picked Adverity for its BI tool integration, which allows teams to connect marketing data pipelines with reporting and analytics platforms. Its library of data connectors helps gather data from multiple marketing and analytics sources into a single environment. The platform also includes automated data transformation and quality checks that help keep datasets consistent for reporting and analysis.
Adverity Key Features
In addition to its strong data integration capabilities, Adverity offers:
- Data Orchestration: Automates the process of cleaning, harmonizing, and monitoring data quality.
- Workflow Automation: Facilitates the automation of repetitive tasks, allowing your team to focus on strategic decision-making.
- Collaboration Tools: Enables team members to collaborate effectively on data analysis and reporting.
Adverity Integrations
Integrations include Google Analytics, Google Ads, Facebook Ads, Instagram Insights, LinkedIn Ads, Mailchimp, Salesforce, HubSpot, Adobe Analytics, and Microsoft Excel.
Pros and Cons
Pros:
- Responsive support team helps resolve integration and pipeline configuration issues
- Reliable cross-platform data transfers for large marketing and advertising datasets
- Pre-built connectors simplify integrating marketing and analytics data sources
Cons:
- Managing large-scale pipelines can become time-consuming during setup
- Complex onboarding process for configuring connectors and data pipelines

Best for easy PowerPoint reports
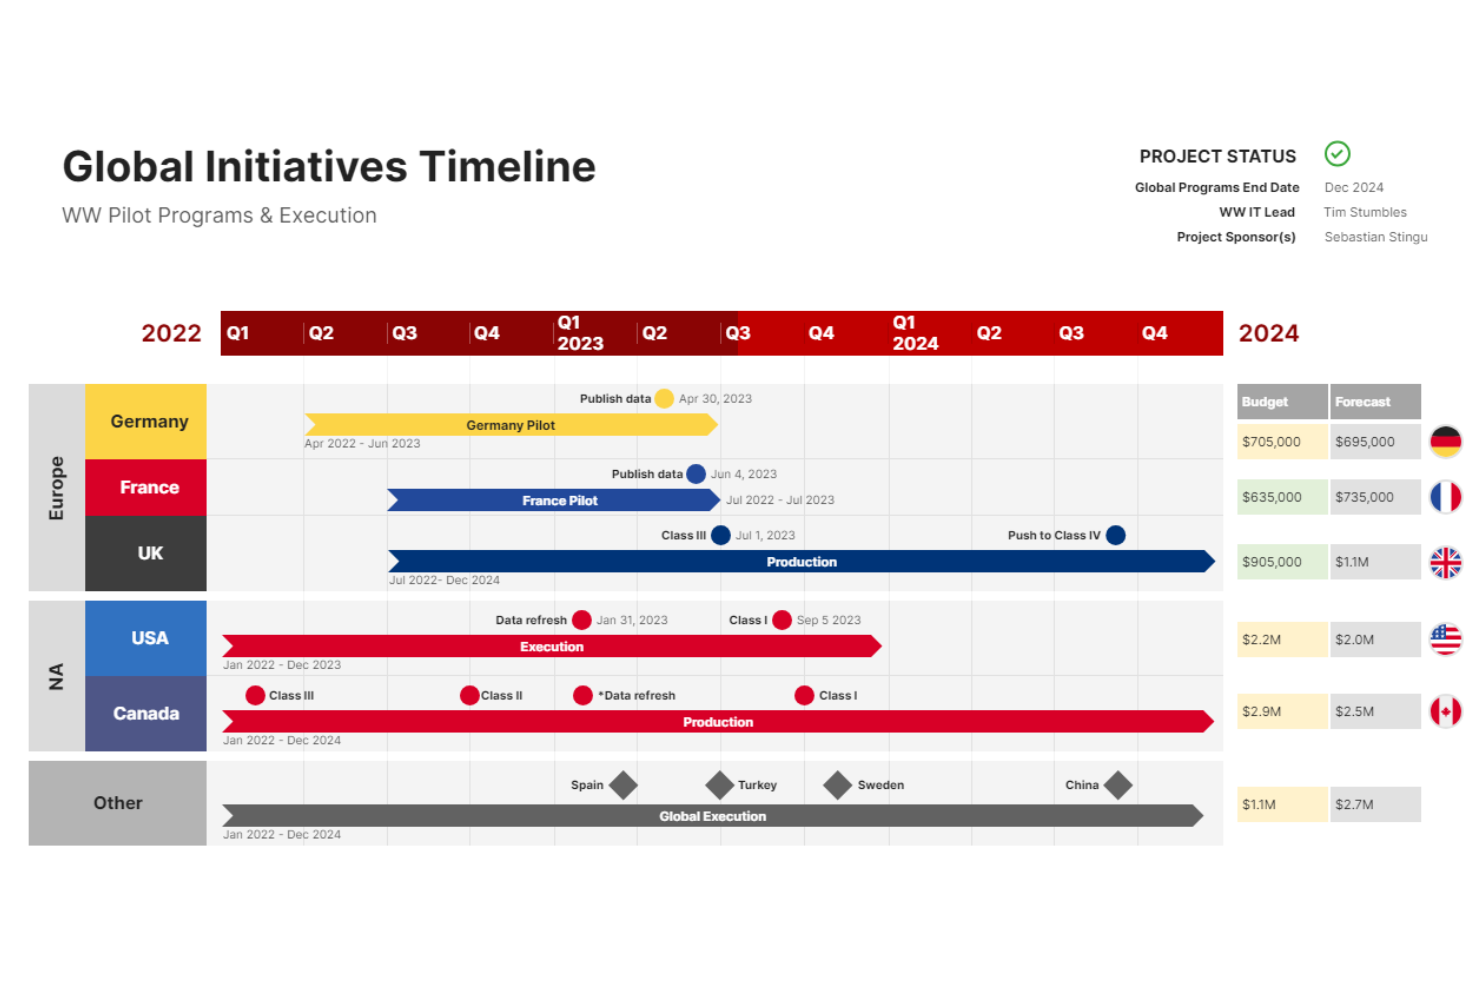
Office Timeline stands out as a reporting tool by offering a unique solution for transforming complex project information into easy-to-understand, visually appealing timelines and Gantt charts within Microsoft PowerPoint. This integration is particularly valuable for professionals who need to communicate project status, milestones, and deliverables to stakeholders in a clear and concise manner.
mary function of timeline creation, Office Timeline excels in its ability to facilitate communication and understanding among project teams and stakeholders. The tool's customizable templates and styles enable users to highlight key project dates, dependencies, and progress in a format that is immediately accessible and interpretable by audiences, regardless of their project management expertise. This capability is especially useful in environments where quick decision-making is critical, as it provides a visual snapshot of project health and trajectory.
Office Timeline costs from $99/year.

Whatagraph
Best reporting tool for marketing agencies

Whatagraph is a reporting tool for marketing agencies and in-house marketing teams that helps you get the right data in front of your customers and in a way they understand.
With this tool, you can create reports in minutes thanks to their 95+ templates and connectors to multiple data sources. Also, you can make these reports customized to your client by changing the colors and adding their logo.
Once you are done making it pretty, Whatagraph lets you automate report delivery so your clients can get their weekly, monthly or quarterly reports, and all you have to do is set the time interval! No more "$!@, I forgot to send the report" moments.
Whatagraph integrates with over 40 tools. These include Facebook, Shopify, Mailchimp, Salesforce, and Tik Tok Ads. All of them can be used as data sources for your reports.
Whatagraph has a 7-day free trial, and pricing starts at $199 per month, which gets you 25 data sources and 5 users, with unlimited reports.
Diğer Gösterge Paneli Raporlama Araçları
İşte en iyi listeye giremeyen birkaç otomatik raporlama aracı. Kullanışlı geçici raporlama aracı için ek önerilere ihtiyacınız varsa bunlara göz atın.
- Xero
For reporting on project quotes, time, and financials
- Jira
Reporting tool for agile teams
- Bonsai Agency Software
For real-time agency performance reporting
- Supermetrics
Reporting tool for integrating over 150 data sources
- Adobe Customer Journey Analytics
For unified cross-channel customer insights
- Google Data Studio
For sharing & collaboration
- Power BI for Office 365
Reporting platform for scaling organizations
- ThoughtSpot
Reporting tool for beginners
- Coefficient
For integrating Google Sheets and Excel
- SegMetrics
Reporting tool for marketing and sales teams
- Octoboard
Reporting software for automated reporting
- FanRuan Software
Reporting software for enterprises
- Rippling Spend
For expense reporting
- ClickUp
Reporting dashboards that promote collaboration
- Celoxis
Reporting tool for data-driven PPM decisions
- Hive
Reporting tool with interactive dashboards
- Wrike
For collaboration on project reporting
- Smartsheet
Connect and integrate with tools and apps you already use to glean real-time insights into the work that teams are doing across the organization.
- Mixpanel
Behavioral analytics tool to analyze website site user engagement, monitor KPIs, and easily generate reports.
- Sisense
API-first cloud technology with interactive dashboards, self-service analytics, and white-labeled BI apps for your use.
- Planview AdaptiveWork
Capture and track all your project and team data in real-time, including effort, status, issues, and change requests.
- Klipfolio
Connect hundreds of data sources, including spreadsheets, files, databases, and web services applications to build data visualizations.
- Domo
Works with your data lakes, data warehouses, ETL tools, and more, to deliver data insights with built-in collaboration and productivity tools.
- Funnel
Automatically collect all the data you need from any data source and feed it directly to your data warehouse, dashboard solution, or any other tool you’re using.
- Looker
Connect with Redshift, Snowflake, BigQuery, as well as 50+ supported SQL dialects to build embedded visualizations and data science workflows.
- Qlik
Combines all your data and makes it analysis-ready for everyone to freely explore, amplified by machine intelligence for better results.
- Supermetrics
Centralize all your marketing data in their marketing data warehouse, build dashboards and reports with ad-hoc analysis.
- Board
Explore your data, run effective analysis, build interactive dashboards, and create impactful reports.
- TapClicks
Marketing report tool (TapReports) and marketing performance analytics (TapAnalytics) with a clean, streamlined UI.
- ProWorkflow
Reporting software for graphical data reports


How I Evaluate Reporting Tools
I split my evaluation into baseline must-haves—like portfolio roll-ups and scheduled reports—and the differentiators that separate true PMO tools from basic dashboards.
Core Functionality (Table Stakes For This List)
When I'm selecting tools for my list, I rank each one on a scale from 0 (does not offer the functionality) to 5 (excels in this area) for each core functionality listed below. Then, I calculate the tool's total score into a percentage. Each tool needs to achieve a minimum total score of 65% to be considered for inclusion.
- Project Dashboards: I evaluate whether dashboards show real-time project health with customizable widgets—things like burn rate, milestone progress, and team workload in a single view.
- Pre-Built Report Templates: A solid template library saves hours of setup, so I look for ready-made formats like status reports, Gantt charts, burndown charts, and budget summaries.
- Portfolio-Level Reporting: For PMO leads managing dozens of initiatives, I check whether the tool can roll up KPIs across projects and programs into a consolidated executive view.
- Data Integrations: Most teams run on tools like Jira, Asana, or Smartsheet, so I evaluate native connectors, API access, and the depth of data sync each platform supports.
- Automated Report Scheduling: I look for the ability to schedule recurring reports to stakeholders via email or shareable links, with control over cadence and recipient lists.
- Custom Report Builder: The best reporting happens when you can slice data your way, so I check for custom filters, calculated fields, and drill-down capabilities beyond preset views.
Once I have a list of tools that meet the criteria, I consider what sets each platform apart.
Differentiating Factors (What Sets Vendors Apart)
Here's how I compare and contrast different vendors:
Standout Features
Cross-tool data aggregation matters when your portfolio spans Jira, Asana, and Smartsheet. I look for tools that normalize data from multiple platforms into one unified report. AI-powered insights add another layer by flagging risks or forecasting delays before they surface in a standup. I also evaluate stakeholder-facing portals where execs or clients can view live reports with permission-based access instead of waiting on a weekly PDF.
Beyond Features
I check how quickly a team can go from setup to first report. Some tools offer pre-configured PMO templates, while others require weeks of custom configuration. Methodology fit also matters—an agile team tracking velocity and sprint burndown needs different reporting defaults than a waterfall team measuring earned value. For teams handling sensitive financial or client data, I evaluate role-based access controls, SSO support, and compliance certifications like SOC 2, which can be a deciding factor for enterprise PMOs.
Raporlama Araçları Nasıl Seçilir?
Uzun özellik listeleri ve karmaşık fiyatlandırma yapılarına kendinizi kaptırmanız kolaydır. Benzersiz yazılım seçimi süreciniz boyunca odağınızı korumanıza yardımcı olmak için aklınızda bulundurmanız gereken faktörleri içeren bir kontrol listesi hazırladım:
| Faktör | Dikkat Edilmesi Gerekenler |
| Ölçeklenebilirlik | Aracın işletmenizle birlikte büyüyebildiğinden emin olun. Artan veri hacimlerini ve kullanıcı sayılarını yavaşlamadan işleyebilen seçenekleri arayın. |
| Entegrasyonlar | Aracın CRM'ler, ERP'ler veya proje yönetimi yazılımları gibi mevcut sistemlerinizle sorunsuz bir şekilde entegre olup olmadığını kontrol edin. |
| Özelleştirilebilirlik | Raporları, gösterge panellerini ve ölçümleri ekibinizin benzersiz iş akışlarına ve KPI'larına uyacak şekilde ne ölçüde özelleştirebileceğinizi değerlendirin. |
| Kullanım Kolaylığı | Ekibinizin kapsamlı bir eğitim veya teknik destek almadan hızlıca içgörüler oluşturmasını sağlayan sezgisel bir arayüz arayın. |
| Bütçe | Fiyatlandırma yapılarını bütçenizle karşılaştırın. Daha fazla kullanıcı, veri depolama veya gelişmiş özellikler için alınan ek ücretler gibi gizli maliyetlere dikkat edin. |
| Güvenlik Önlemleri | Hassas verileri korumak için aracın şifreleme, kullanıcı erişim denetimleri ve GDPR gibi düzenlemelere uyumluluk içerdiğini doğrulayın. |
| Destek | Sorun giderme ve eğitim için 7/24 yardım veya özel hesap yöneticileri gibi mevcut müşteri desteği düzeyini değerlendirin. |
| Veri Görselleştirme | Verilerin ekibiniz tarafından kolayca yorumlanabilmesini ve eyleme dönüştürülebilmesini sağlayan grafikler, çizelgeler ve gösterge panelleri gibi görselleştirme seçeneklerini arayın. |
2026 İçin Raporlama Araçlarındaki Trendler
Araştırmam sırasında farklı raporlama aracı sağlayıcılarından sayısız ürün güncellemesi, basın bülteni ve sürüm günlüğü inceledim. İşte yakından takip ettiğim yeni trendlerden bazıları:
- Yapay Zekâ Odaklı İçgörüler: Birçok platform artık verilerdeki kalıpları analiz etmek ve uygulanabilir içgörüler önermek için yapay zekâ raporlama araçlarını kullanıyor; bu da kullanıcıların zamandan tasarruf etmesine ve daha iyi kararlar almasına yardımcı oluyor. Örneğin bazı araçlar finansal raporlardaki anormallikleri işaretliyor veya geçmiş verilere dayanarak izlenmesi gereken metrikleri öneriyor.
- Doğal Dille Sorgulama: Kullanıcılar artık rapor oluşturmak için sorularını günlük dille sorabiliyor. Bu, raporlamayı teknik olmayan ekip üyeleri için de erişilebilir hâle getiriyor. Örneğin bir kullanıcı “Geçen çeyrekte satışlar nasıldı?” yazabilir ve anında grafik biçiminde bir yanıt alabilir.
- Gömülü Analiz: Daha fazla araç, işletmelerin raporları doğrudan kendi yazılımlarına veya müşteri portallarına entegre edebilmesi için gömülü analiz özellikleri sunuyor. Bu, müşterilerine analiz sağlayan SaaS şirketleri için kullanışlıdır.
- Veri Hikâyeleştirme Özellikleri: Araçlar, otomatik açıklamalar ve öne çıkan noktalarla ham sayıları anlatılara dönüştürmeye yönelik özellikler ekliyor. Bu, ekiplerin sunumlar veya güncellemeler sırasında bulguları daha etkili bir şekilde paylaşmasına yardımcı oluyor.
- Veri Gizliliği Geliştirmeleri: Sağlayıcılar, GDPR ve CCPA gibi daha katı düzenlemelere uymak için daha fazla gizlilik denetimi geliştiriyor. Örneğin bazı araçlar artık verilerin anonimleştirilmesini sağlıyor veya kullanıcı rollerine göre hassas metriklere erişimi kısıtlıyor.
Bu trendler bağımsız raporlama platformlarıyla sınırlı değil; birçoğu diğer yazılım kategorilerine de taşınıyor. Örneğin görsel proje yönetimi yazılımları, ekiplerin proje performansını daha sezgisel bir şekilde takip etmesine yardımcı olmak için gerçek zamanlı gösterge panoları, yapay zekâ tarafından oluşturulan içgörüler ve özelleştirilebilir veri görselleştirmeleri gibi gelişmiş raporlama özelliklerini giderek daha fazla entegre ediyor.
Raporlama Araçları Nedir?
Raporlama araçları, işletmelerin verileri düzenli ve anlaşılır bir biçimde toplamasına, işlemesine ve sunmasına yardımcı olan yazılımlardır. Verileri veri tabanları ve elektronik tablolar gibi çeşitli kaynaklardan alır ve trendleri, kalıpları ve içgörüleri gösteren raporlara dönüştürürler. Bu raporlar tablo, çizelge, grafik ve gösterge paneli biçiminde olabilir; böylece karmaşık verilerin bir bakışta anlaşılması kolaylaşır.
Raporlama yazılımları, yöneticilere ve paydaşlara performansı anlamak, iyileştirme alanlarını belirlemek ve gelecekteki eylemleri planlamak için gereken bilgileri sağladığından karar alma açısından paha biçilmezdir. Bu da daha bilinçli stratejiler, daha verimli operasyonlar ve daha güçlü bir kârlılık anlamına gelebilir.
Özellikler
Raporlama araçlarını seçerken aşağıdaki temel özelliklere dikkat edin:
- Özelleştirilebilir gösterge panoları: Ekibiniz için en uygun verileri iş akışınıza uygun bir biçimde düzenlemenize ve görüntülemenize olanak tanır. Minimum kodlamayla markaya özel özelleştirme için beyaz etiketli gösterge paneli araçlarına göz atın.
- Gerçek zamanlı raporlama: Yeni veriler geldikçe raporları otomatik olarak günceller ve en güncel bilgilere dayanarak karar almanıza yardımcı olur.
- Veri görselleştirme seçenekleri: Karmaşık verilerin paydaşlar tarafından yorumlanmasını ve paylaşılmasını kolaylaştırmak için çizelgeler, grafikler ve ısı haritaları sunar.
- Zamanlanmış raporlar: Rapor oluşturma ve teslim etme işlemlerini otomatikleştirmenize olanak tanır; böylece zamandan tasarruf edilir ve ekibiniz için tutarlı güncellemeler sağlanır.
- Role dayalı erişim denetimleri: Güvenliği ve uyumluluğu artırmak için hassas raporlara veya verilere erişimi kullanıcı rollerine göre kısıtlar.
- Detaya inme özellikleri: Daha derin içgörüler elde etmek için belirli metriklere tıklayabilmenizi sağlar ve sayıların arkasındaki etkenleri anlamanıza yardımcı olur.
- Çoklu kaynak entegrasyonu: Daha kapsamlı bir görünüm elde etmek için çeşitli platform ve araçlardaki verileri tek bir raporda birleştirir.
- Dışa aktarma seçenekleri: Kolay paylaşım ve daha ileri analiz için raporları PDF, Excel veya CSV gibi farklı biçimlerde dışa aktarmanıza olanak tanır.
- Trend analiz araçları: Zaman içindeki veri kalıplarını öne çıkarır; gelecekteki sonuçları tahmin etmenize ve buna göre plan yapmanıza yardımcı olur.
- Açıklama araçları: Daha iyi iş birliği ve bağlam paylaşımı için kullanıcıların doğrudan raporlara yorum veya not eklemesine olanak tanır.
Faydalar
Raporlama araçlarını uygulamak, ekibiniz ve işletmeniz için çeşitli faydalar sağlar. Yararlanabileceğiniz birkaç fayda şunlardır:
- Geliştirilmiş karar alma: Ekibinize, kararları doğru ve güncel verilere dayandırabilmesi için gerçek zamanlı içgörüler ve anlaşılır görseller sunar.
- Zaman tasarrufu: Rapor oluşturmayı ve veri güncellemelerini otomatikleştirerek diğer önemli görevler için zaman kazandırır.
- Daha iyi iş birliği: Ekiplerin panoları paylaşmasına ve doğrudan raporlara yorum eklemesine olanak tanıyarak temel içgörüler konusunda uyum sağlamayı kolaylaştırır.
- Artırılmış veri doğruluğu: Bilgileri doğrudan entegre sistemlerden alarak manuel veri girişi ve hesaplama hatalarını azaltır.
- Geliştirilmiş hesap verebilirlik: İzlenmesi ve raporlanması kolay metriklerle temel performans göstergelerini takip eder ve sorumluluk atar.
- Daha hızlı eğilim belirleme: Fırsatları ve zorlukları erkenden fark etmenize yardımcı olmak için verilerinizdeki kalıpları analiz eder.
- Ölçeklenebilir raporlama: Artan ihtiyaçlarınıza uyum sağlayarak zaman içinde daha büyük veri kümelerini ve daha karmaşık analizleri yönetmenize olanak tanır.
Maliyetler ve Fiyatlandırma
Raporlama araçlarını seçmek, mevcut çeşitli fiyatlandırma modellerinin ve planların anlaşılmasını gerektirir. Maliyetler; özelliklere, ekip büyüklüğüne, eklentilere ve daha fazlasına göre değişir. Aşağıdaki tablo, raporlama aracı çözümlerinde yaygın olarak sunulan planları, ortalama fiyatlarını ve genellikle dahil edilen özellikleri özetlemektedir:
Raporlama Araçları için Plan Karşılaştırma Tablosu
| Plan Türü | Ortalama Fiyat | Yaygın Özellikler |
| Ücretsiz Plan | $0 | Temel raporlama, sınırlı panolar, CSV biçiminde veri dışa aktarma ve tek kullanıcı erişimi. |
| Kişisel Plan | $5-$25/kullanıcı/ay | Gelişmiş panolar, özelleştirilebilir şablonlar, e-posta ile raporlama ve öncelikli destek. |
| İşletme Planı | $30-$75/kullanıcı/ay | Çok kullanıcılı erişim, role dayalı izinler, popüler araçlarla entegrasyonlar ve eğilim analizi. |
| Kurumsal Plan | $100+/kullanıcı/ay | Sınırsız kullanıcı, gelişmiş analizler, API erişimi, özel markalama ve özel destek. |
SSS
Başkalarının bu konu hakkında sorduğu yaygın soruların yanıtlarını bulun.
Raporlama araçlarının türleri nelerdir?
Gösterge paneli yazılımı, veri görselleştirme yazılımı, puan kartı araçları ve özel rapor yazma araçları gibi birçok raporlama aracı türü vardır.
Gösterge paneli yazılımı, sizin için en önemli raporları ön plana çıkarmanızı sağlar. Veri görselleştirme yazılımı, verileri kullanıcıların kolayca okuyabileceği görsel bir biçime dönüştürür.
Puan kartı araçları ise tamamen performans verileriyle ilgilidir. Böylece en başarılı çalışanlarınızın kimler olduğunu bilirsiniz. Son olarak, özel rapor yazma araçları, sürekli değişen ihtiyaçlara sahip şirketler için çeşitli anlık rapor biçimleri oluşturur.
İş zekâsı yazılımı nedir?
İş zekâsı yazılımı; ham verileri toplamak, analiz etmek ve bilinçli karar almayı desteklemek üzere kullanıcı dostu bir şekilde sunmak için kullanılan kritik bir araçtır. İş zekâsı yazılımı, çeşitli kaynaklardan gelen verileri bir araya getirip işler ve proje yöneticilerine proje performansının kapsamlı ve bütüncül bir görünümünü sunar. Proje yöneticilerinin eğilimleri belirlemesine, temel performans göstergelerini (KPI’lar) izlemesine ve projelerin başarılı bir şekilde yürütülmesine katkıda bulunan veriye dayalı kararlar almasına olanak tanır.
Şu anda raporlama yazılımı aramıyor musunuz?
İşinize yarayabilecek diğer proje yönetimi araçları listelerimize göz atın:
- Proje portföyü yönetimi araçlarına göz atın. Bu araçlar, raporlarınızı daha üst düzeyde ve projeler arasında hazırlamanıza ve iletmenize yardımcı olabilir.
- İletişim, iletişim, iletişim. Bu konuda uzmanlaşmadıysanız başka hiçbir işe gerçekten başlayamazsınız. Şu En İyi 10 İletişim Aracı ve Yazılımı aracını deneyin.
- En iyi pazarlama proje yönetimi yazılımları listem gibi diğer yazılımlar arasında bir proje raporlama aracı bulun.