10 Mejores Alternativas a TapClicks en 2026

Lista de alternativas a TapClicks


Las mejores alternativas a TapClicks ofrecen a tu agencia reportes flexibles, integraciones sólidas y paneles de control que realmente tienen sentido para los clientes. Si estás buscando opciones, probablemente busques una plataforma de software de informes para agencias que combine reportes con gestión de datos, ayude a tomar mejores decisiones y mejore la facilidad de uso general.
Muchas herramientas van más allá de los informes básicos al ofrecer funciones de inteligencia empresarial, integraciones con CRM e incluso soluciones todo en uno que centralizan tus datos de marketing. En esta guía encontrarás las plataformas de software de informes para agencias mejor valoradas, que te ayudarán a automatizar informes, conectar todos tus datos de marketing y entregar análisis relevantes para tus clientes, para que puedas dedicar menos tiempo al manejo de hojas de cálculo y más tiempo a obtener resultados.
¿Qué es TapClicks?
TapClicks es una plataforma de análisis y reportes de marketing diseñada para agencias y equipos de marketing. Conecta datos de múltiples fuentes, automatiza los informes a clientes y proporciona paneles personalizables. Con TapClicks puedes centralizar el rendimiento de campañas, visualizar métricas clave y simplificar el modo en que compartes resultados con tus clientes. Las agencias utilizan TapClicks para ahorrar tiempo en informes manuales y aportar análisis claros y accionables en todos sus canales de marketing.
Resumen de las mejores alternativas a TapClicks
Esta tabla comparativa resume los detalles de precios para mis mejores selecciones de alternativas a TapClicks para ayudarte a encontrar la mejor opción según tu presupuesto y necesidades de negocio.
| Tool | Best For | Trial Info | Price | ||
|---|---|---|---|---|---|
| 1 | Ideal para paneles empresariales en tiempo real | Prueba gratuita de 14 días | Desde $120/mes (facturado anualmente) | Website | |
| 2 | Ideal para informes de marketing para clientes | Prueba gratuita de 14 días | Desde $20/cliente/mes (facturado anualmente) | Website | |
| 3 | Ideal para informes de marketing visuales | Plan gratuito disponible | Desde $229/mes (facturado anualmente) | Website | |
| 4 | Ideal para flujos personalizados de datos de marketing | Demo gratuita disponible | Precio a consultar | Website | |
| 5 | Ideal para el seguimiento del rendimiento en tiempo real | Plan gratuito + prueba gratis + demo gratuita disponible | Desde $64/mes (facturado anualmente) | Website | |
| 6 | Ideal para reportes de marketing automatizados | Prueba gratuita de 14 días + demo gratuita disponible | Desde $62/mes (facturado anualmente) | Website | |
| 7 | Ideal para datos de marketing centralizados | Demostración gratuita disponible | Desde $200/mes (facturación anual) | Website | |
| 8 | Ideal para integración de datos de marketing | Demo gratuita disponible | Precio a consultar | Website | |
| 9 | Ideal para reportes empresariales y paneles de control | Prueba gratuita de 14 días + demo gratis disponible | Desde $19.90/usuario/mes (facturado anualmente) | Website | |
| 10 | Ideal para análisis y reportes de agencias | Demostración gratuita disponible | Precio a consultar | Website |
Por qué puedes confiar en nosotros
Llevamos probando y evaluando software de gestión de proyectos desde 2012. Como gestores de proyectos, sabemos lo crítico y difícil que es tomar la mejor decisión al seleccionar software.
Invertimos en una investigación profunda para ayudar a nuestra audiencia a tomar decisiones de compra más informadas. Hemos probado más de 2,000 herramientas para diferentes escenarios de gestión de proyectos y redactado más de 1,000 reseñas detalladas. Conoce cómo mantenemos la transparencia y nuestra metodología de revisión de software.
-

Celoxis
Visit WebsiteThis is an aggregated rating for this tool including ratings from Crozdesk users and ratings from other sites.4.4 -
Accelo
Visit WebsiteThis is an aggregated rating for this tool including ratings from Crozdesk users and ratings from other sites.4.4 -
Wrike
Visit WebsiteThis is an aggregated rating for this tool including ratings from Crozdesk users and ratings from other sites.4.3


Reseñas de alternativas a TapClicks
A continuación te presento mis resúmenes detallados de las mejores alternativas a TapClicks que integran mi lista. Mis reseñas ofrecen una visión detallada de sus características, integraciones y mejores casos de uso para ayudarte a encontrar la plataforma ideal para ti.

Klipfolio es una plataforma de paneles y reportes diseñada para agencias y equipos que necesitan visualizar datos de marketing y negocios en tiempo real desde múltiples fuentes. Si deseas crear paneles altamente personalizables y automatizar la elaboración de informes para clientes, esta herramienta está pensada para ti.
¿Para quién es mejor Klipfolio?
Agencias y equipos de marketing que necesitan monitorear y generar reportes de datos en tiempo real provenientes de varias fuentes.
Por qué Klipfolio es una buena alternativa a TapClicks
Elegí Klipfolio por el nivel de control que ofrece sobre el diseño de los paneles. El Klip Editor me permite crear visualizaciones de datos personalizadas desde cero usando fórmulas y transformaciones de datos, algo que la mayoría de herramientas de reportes no permiten a este nivel. También valoro PowerMetrics, la capa de métricas de Klipfolio, que permite a mi equipo definir y estandarizar los KPIs una vez y reutilizarlos en varios paneles. En la práctica, eso significa que cada reporte de cliente extrae de las mismas definiciones de datos consistentes, lo que reduce las discrepancias y las correcciones manuales.
Características clave de Klipfolio
- Amplia biblioteca de gráficos: Elige entre más de 30 tipos de gráficos, incluidos indicadores, pictogramas, mapas y embudos.
- Personalización con HTML, CSS y JS: Modifica los visuales de los paneles utilizando temas personalizados, JavaScript y CSS en línea para informes de clientes con imagen de marca total.
- Reportes automatizados: Programa paneles e informes para renderizarse como PDF o imágenes y envíalos por correo electrónico automatizado.
- Enlaces publicados: Comparte paneles con clientes dentro o fuera de tu organización usando enlaces públicos o protegidos con contraseña.
Integraciones de Klipfolio
Klipfolio ofrece más de 100 integraciones nativas, incluidas Google Analytics, Facebook Ads, HubSpot, Salesforce, Google Sheets, Xero, QuickBooks, Shopify, Snowflake y Zapier. También dispone de una API para integraciones personalizadas.
Pros and Cons
Pros:
- Seguimiento de KPIs en tiempo real con actualización instantánea
- Cálculo profundo de métricas personalizadas mediante fórmulas
- Plantillas predefinidas para una configuración rápida de paneles
Cons:
- Las conexiones iniciales de datos pueden ser complejas
- La programación de informes por correo electrónico requiere planes de pago

AgencyAnalytics es una plataforma de informes diseñada para agencias de marketing que desean automatizar la elaboración de informes para clientes y monitorizar el rendimiento de campañas en un solo lugar. Si gestionas múltiples clientes y necesitas conectar decenas de canales de marketing, esta herramienta te ayuda a centralizar la analítica y agilizar las actualizaciones.
¿Para quién es mejor AgencyAnalytics?
Agencias de marketing y consultores que necesitan reportes automatizados y multidispositivo para clientes.
Por qué AgencyAnalytics es una buena alternativa a TapClicks
Elegí AgencyAnalytics porque la función de programación automática de informes realmente elimina el trabajo manual de la elaboración de informes para clientes a gran escala. Me gusta que puedes transformar un panel en vivo en un informe listo y programado en minutos, con datos de más de 85 integraciones ya cargados. El flujo de trabajo de aprobación de informes es una característica que encuentro especialmente útil—me permite revisar y añadir comentarios antes de enviar cualquier cosa a los clientes. En la práctica, eso significa que cada informe refleja la voz de mi agencia, y no solo datos en bruto.
Características clave de AgencyAnalytics
- Constructor de informes de arrastrar y soltar: Crea y personaliza informes para clientes usando un editor visual con widgets ajustables, fuentes, colores e imágenes de fondo.
- Creación de informes como diapositivas: Convierte datos de rendimiento de marketing en presentaciones listas para usar directamente dentro del generador de informes.
- Widget de seguimiento de objetivos: Establece metas para cualquier métrica y muestra el progreso en tiempo real hacia los objetivos de los clientes en paneles e informes.
- Informes y paneles consolidados: Agrupa métricas clave de varios clientes o ubicaciones en una sola vista consolidada.
Integraciones de AgencyAnalytics
AgencyAnalytics ofrece más de 85 integraciones nativas, incluyendo Google Analytics, Google Ads, Facebook Ads, LinkedIn Ads, Mailchimp y más, con una API disponible para integraciones personalizadas.
Pros and Cons
Pros:
- Paneles con marca blanca para imagen de cliente
- Seguimiento de objetivos personalizado y widgets de KPIs
- Flujo de trabajo de aprobación integrado para revisión de informes
Cons:
- No incluye almacén de datos ni herramientas ETL integradas
- No tiene modelado avanzado de atribución entre canales

Whatagraph es una plataforma de informes multicanal diseñada para agencias de marketing que necesitan unificar datos de múltiples fuentes. Si deseas automatizar los informes para tus clientes y entregar análisis visualmente atractivos en tiempo real, esta herramienta está pensada para ti.
¿Para quién es mejor Whatagraph?
Agencias de marketing y equipos internos que gestionan campañas digitales multicanal.
¿Por qué Whatagraph es una buena alternativa a TapClicks?
Elegí Whatagraph porque su pipeline de datos integrado se encarga de la unificación de datos multicanal sin necesidad de middleware o trabajos manuales de ETL. Me gusta la función Source Blends, que permite combinar datos de plataformas como Google Ads y Facebook Ads en una sola vista multicanal. El motor de transformación sin código también resulta realmente útil: puedo estandarizar convenciones de nombres y construir métricas calculadas como ROAS combinado entre cuentas. En la práctica, esto significa que paso menos tiempo organizando datos y más tiempo entregando ideas accionables para los clientes.
Funciones principales de Whatagraph
- Creación de informes con IA: Usa instrucciones en lenguaje natural para generar informes de marketing completos sin construirlos manualmente desde cero.
- Chat con IA para clientes: Permite que los clientes consulten directamente sus propios datos a través de un chat integrado en su informe en vivo.
- Espacios de trabajo para múltiples clientes: Gestiona cientos de clientes en espacios de trabajo aislados y personalizados, con historial de versiones y plantillas vinculadas.
- Control de acceso basado en roles: Asigna permisos en cuatro niveles para controlar quién puede conectar datos, editar transformaciones o ver tableros.
Integraciones de Whatagraph
Whatagraph ofrece integraciones nativas con Google Analytics, Google Ads, Facebook Ads, LinkedIn Ads, HubSpot, Mailchimp, Shopify, Klaviyo, TikTok Ads, y más, además de una API disponible para integraciones personalizadas.
Pros and Cons
Pros:
- Informes programados automáticos para múltiples clientes
- Seguimiento de objetivos personalizados y widgets de KPI
- Flujo de aprobación incorporado para revisión de informes
Cons:
- Carece de configuración de permisos granulares en profundidad
- No está disponible la edición masiva de fuentes de datos
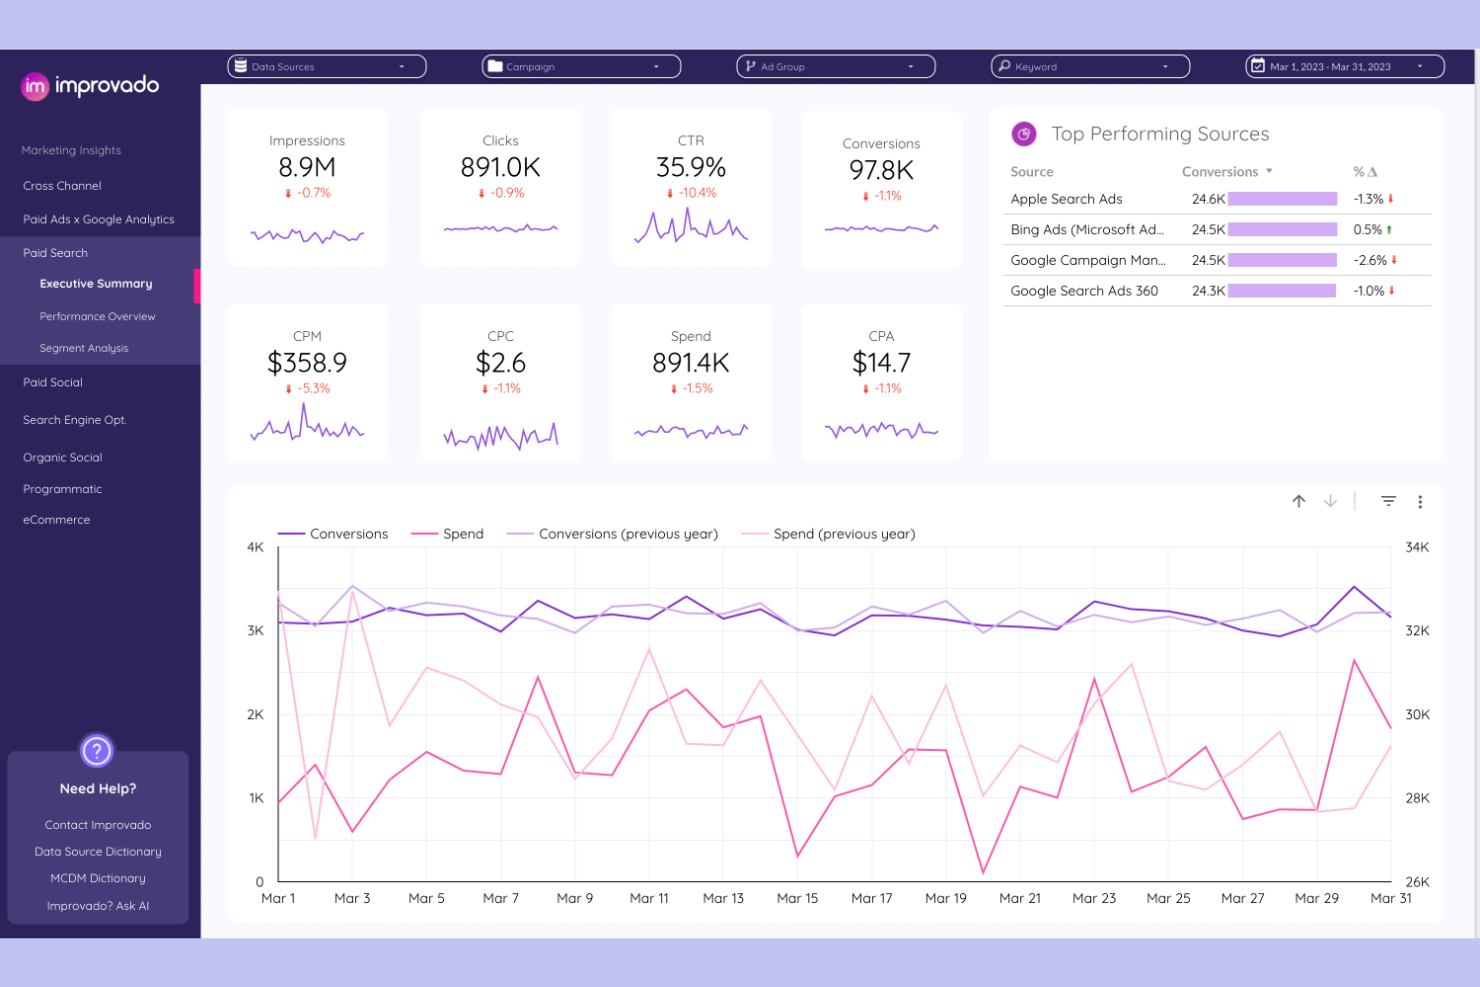
Improvado es una plataforma de análisis de marketing diseñada para agencias y equipos empresariales que necesitan centralizar, transformar y visualizar datos de docenas de fuentes de anuncios y analítica. Si buscas automatizar flujos de trabajo de informes complejos y obtener ideas accionables en múltiples canales, esta herramienta está pensada para ti.
¿Para quién es ideal Improvado?
Equipos de análisis de marketing en grandes agencias o marcas empresariales que gestionan campañas multicanal de alto volumen.
Por qué Improvado es una buena alternativa a TapClicks
Elegí Improvado porque su capa de descubrimiento impulsada por IA detecta anomalías y cambios de rendimiento en los canales sin que tenga que revisar manualmente los paneles. Me gusta mucho la función Insights, que marca automáticamente los cambios significativos en métricas como ROAS o CPC y explica la causa probable. En la práctica, esto significa que mi equipo puede detectar campañas con bajo rendimiento antes de que gasten el presupuesto, en lugar de enterarse después. Para las agencias que gestionan grandes carteras de anuncios complejos, ese tipo de descubrimiento automatizado es difícil de encontrar en otros lugares.
Características clave de Improvado
- Paneles de BI preconfigurados: Accede a plantillas de paneles ya preparadas compatibles con Power BI, Looker Studio y Tableau para los casos de uso habituales en marketing.
- Informes automatizados de periodo a periodo: Programa y automatiza informes recurrentes que comparan el rendimiento entre periodos personalizados sin configuración manual.
- Gobernanza de datos de marketing: Aplica reglas desde una biblioteca de directrices integrada para controlar la calidad de los datos de las campañas y señalar problemas de cumplimiento en toda tu canalización.
- Co-piloto de análisis con IA: Consulta tus datos de marketing en lenguaje natural y obtén respuestas presentadas como gráficos, tablas o diagramas en segundos.
Integraciones de Improvado
Improvado ofrece más de 500 integraciones nativas, incluyendo Google Ads, Facebook Ads, LinkedIn Ads, Google Analytics, HubSpot, Salesforce, Shopify, Amazon Ads, TikTok Ads y Google Sheets, con una API disponible para integraciones personalizadas.
Pros and Cons
Pros:
- Paneles preconfigurados para Power BI y Tableau
- Informes automatizados de periodo a periodo
- Co-piloto de análisis en lenguaje natural
Cons:
- Opciones limitadas de personalización de visualización
- No cuenta con modelado avanzado de atribución multicanal

Databox es una plataforma de análisis empresarial diseñada para agencias y equipos de marketing que necesitan consolidar datos de múltiples fuentes en paneles en tiempo real. Es una opción ideal para equipos que desean hacer seguimiento de KPIs, visualizar el rendimiento de campañas y automatizar informes a clientes sin una configuración compleja.
¿Para quién es mejor Databox?
Agencias de marketing y equipos internos que necesitan centralizar la analítica y automatizar reportes en tiempo real desde múltiples fuentes de datos.
Por qué Databox es una buena alternativa a TapClicks
Elegí Databox por su función Data Stories, que me permite insertar valores de métricas dinámicas directamente en el texto de los reportes. Cuando envío un informe mensual a un cliente, la narrativa se actualiza automáticamente con los últimos números, sin necesidad de ediciones manuales. También utilizo el modo de presentación de Databox, que formatea los reportes en diapositivas a pantalla completa con notas para el orador en reuniones en vivo con clientes. Esa combinación de informes automatizados y formato de presentación en vivo es algo que la mayoría de herramientas de informes para agencias no ofrecen juntas.
Funciones clave de Databox
- Resúmenes de rendimiento por IA: El analista Genie AI de Databox genera resúmenes escritos de métricas clave directamente en los reportes.
- Programación de informes: Envía automáticamente informes PDF por correo electrónico o Slack de forma diaria, semanal, mensual o trimestral.
- Plantillas de informes prediseñadas: Accede a plantillas listas para canales como Google Ads, Facebook Ads, HubSpot y Google Analytics 4.
- Personalización de marca: Ajusta tipografías, logotipos, imágenes y colores para adaptarlos a la marca de tu empresa o cliente dentro de los reportes.
Integraciones de Databox
Databox ofrece más de 130 integraciones nativas, incluyendo Google Analytics, Google Ads, Facebook Ads, HubSpot, Salesforce, Shopify, LinkedIn Ads, Mailchimp, Stripe y Google Sheets. Se dispone de una API para integraciones personalizadas.
Pros and Cons
Pros:
- Aplicación móvil para acceder a los datos desde cualquier lugar
- Amplia galería de plantillas de informes con un solo clic
- Alertas automáticas de datos por cambios en KPIs
Cons:
- Actualizaciones manuales de datos en planes gratuitos
- Retención de datos históricos limitada en niveles inferiores

Swydo es una plataforma de generación de informes y monitoreo diseñada para agencias y especialistas en marketing digital que necesitan automatizar los reportes de clientes en múltiples canales. Destaca por su enfoque basado en flujos de trabajo, que facilita programar, personalizar y gestionar informes recurrentes para los clientes.
¿Para quién es ideal Swydo?
Agencias y equipos de marketing digital que necesitan automatizar y gestionar informes recurrentes de clientes a través de diversas plataformas de publicidad y análisis.
Por qué Swydo es una buena alternativa a TapClicks
Elegí Swydo por la forma en que gestiona la generación automatizada de informes de clientes a gran escala. Las plantillas de informes dinámicos permiten a mi equipo crear una plantilla maestra y aplicarla instantáneamente a todas las cuentas de clientes: cualquier actualización en un widget o métrica se replica en todos los informes a la vez, eliminando mucho trabajo repetitivo de mantenimiento. También dependo de los tableros de monitoreo de Swydo para vigilar los KPIs de los clientes en todas las cuentas desde una sola vista, con alertas basadas en umbrales que detectan problemas antes de que los clientes los noten. Para agencias que gestionan un alto volumen de informes recurrentes, esa combinación de programación automatizada y monitoreo proactivo es difícil de igualar.
Características clave de Swydo
- Plantillas de informes predefinidas: Accede a una biblioteca de plantillas listas para usar con widgets y KPIs preestablecidos para canales como Google Ads, Meta y LinkedIn.
- Seguimiento de objetivos: Establece objetivos personalizados para conversiones, ROAS o clientes potenciales y haz un seguimiento automático del progreso contra esos objetivos dentro de los informes.
- Tableros para clientes: Crea tableros de monitoreo personalizados por cliente con tablas de KPIs, umbrales de objetivo y filtros por responsable de cuenta o estado del KPI.
- Compartir en PDF y paneles online: Entrega informes como PDFs descargables o paneles online compartibles, según la preferencia del cliente.
Integraciones de Swydo
Swydo ofrece más de 32 integraciones nativas que incluyen Google Ads, Facebook Ads, Google Analytics, LinkedIn Ads, Microsoft Advertising, Google Sheets, Mailchimp, HubSpot, Instagram Insights y YouTube. Dispone de una API para integraciones personalizadas.
Pros and Cons
Pros:
- Recordatorios automáticos para la entrega de informes
- Seguimiento de objetivos integrado para los clientes
- Duplica informes entre cuentas de clientes al instante
Cons:
- Sin funcionalidades integradas de almacenamiento de datos
- La programación de informes está disponible solo en planes superiores

Funnel es una plataforma de datos de marketing creada para agencias y equipos internos que necesitan centralizar, limpiar e informar sobre los datos de campañas provenientes de cientos de fuentes. Si deseas automatizar la recopilación de datos y entregar informes actualizados y listos para el cliente sin trabajo manual, esta herramienta está diseñada para ti.
¿Para Quién es Mejor Funnel?
Agencias de marketing y equipos internos que gestionan campañas digitales multicanal para varios clientes o marcas.
Por Qué Funnel Es una Buena Alternativa a TapClicks
Elegí Funnel porque elimina el trabajo manual de extraer datos de decenas de plataformas publicitarias y consolidarlos en una única capa de informes limpia. Lo que realmente me gusta es el pipeline automatizado de recopilación de datos—Funnel se conecta a tus fuentes, normaliza los datos y los mantiene actualizados sin que nadie toque una hoja de cálculo. También valoro la función de Informe, que permite a mi equipo crear informes listos para el cliente y compartibles directamente sobre datos en vivo. En la práctica, esto significa que no estamos rehaciendo informes cada semana: se actualizan automáticamente a medida que llegan nuevos datos de campaña.
Funciones Clave de Funnel
- Funnel Portals: Crea portales seguros y específicos para cada cliente que les permiten acceder a su propio panel personalizado sin compartir datos no relacionados.
- Constructor de paneles drag-and-drop: Crea informes desde cero o personaliza plantillas preconstruidas sin escribir código.
- Soporte para múltiples destinos de BI: Envía el mismo conjunto de datos a Looker Studio, Power BI, Tableau, Google Sheets y Excel simultáneamente.
- Plantillas de panel preconstruidas: Comienza con plantillas listas para casos de uso como anuncios pagados, Google Analytics, Shopify y marketing de rendimiento multicanal.
Integraciones de Funnel
Funnel ofrece integraciones nativas con Google Ads, Facebook Ads, LinkedIn Ads, Google Analytics, HubSpot, Shopify, Amazon Ads, TikTok Ads y Google Sheets, con una API disponible para integraciones personalizadas.
Pros and Cons
Pros:
- Tableros en vivo que se actualizan con los nuevos datos de campaña
- Exportaciones a Power BI, Tableau y Google Sheets
- Mapeo de datos personalizado para necesidades de informes complejos
Cons:
- Sin visualización integrada más allá de los tableros
- No ofrece un panel de control de marca blanca directo para clientes

Adverity es una plataforma de integración y análisis de datos diseñada para equipos de marketing y agencias que necesitan unificar, limpiar y analizar datos de múltiples fuentes. Si buscas automatizar flujos de trabajo de datos complejos y ofrecer información accionable a los clientes, Adverity es una opción a considerar.
¿Para quién es mejor Adverity?
Analistas de marketing y equipos de datos en agencias medianas y grandes que necesitan integración y análisis de datos automatizados.
Por qué Adverity es una buena alternativa a TapClicks
He elegido Adverity porque su integración de datos automatizada va más allá que la mayoría de las herramientas de generación de informes. Me gusta que se encargue de la armonización de datos automáticamente, mapeando convenciones de nombres inconsistentes entre plataformas, para que mi equipo no tenga que pasar horas limpiando datos antes de crear informes. La función DataStream de Adverity me permite extraer información de cientos de fuentes y programar actualizaciones de datos automáticas, manteniendo los paneles siempre actualizados sin intervención manual. Para agencias que gestionan grandes volúmenes de datos de múltiples canales, ese nivel de automatización es difícil de igualar.
Características clave de Adverity
- Supervisión de la calidad de los datos: Detecta automáticamente anomalías e inconsistencias en tu almacén de datos antes de que lleguen a los informes.
- Controles granulares de acceso de usuario: Establece permisos basados en roles para gestionar quién puede ver, editar o exportar datos en equipos y clientes.
- Consultas con IA conversacional: Plantea preguntas en lenguaje natural directamente a tus datos para obtener información sin escribir SQL.
- Enrutamiento de destino de datos: Envía datos armonizados a herramientas de BI y plataformas como Tableau, Power BI, Snowflake y Google BigQuery.
Integraciones de Adverity
Adverity ofrece más de 600 integraciones nativas con plataformas de marketing, análisis y nube, incluyendo Google Analytics, Facebook Ads, Amazon Advertising, Salesforce, HubSpot y Snowflake. Se ofrece una API para integraciones personalizadas.
Pros and Cons
Pros:
- Gestiona automáticamente la armonización de datos complejos
- Ofrece herramientas avanzadas de supervisión de calidad de datos
- Permite actualizaciones automatizadas y programadas de datos
Cons:
- Requiere configuración técnica para flujos de trabajo avanzados
- No incluye funciones directas de informes marca blanca

Scoro es una plataforma de gestión de trabajo diseñada para agencias y consultoras que necesitan reportes unificados de proyectos, tiempo y finanzas. Si deseas conectar la entrega de proyectos, la planificación de recursos y paneles de control en tiempo real en un solo lugar, Scoro es una opción a considerar.
¿Para quién es mejor Scoro?
Agencias y consultoras que necesitan gestionar proyectos, recursos y reportes en una sola plataforma.
Por qué Scoro es una buena alternativa a TapClicks
Elegí Scoro porque conecta la entrega de proyectos y el rendimiento financiero en la misma capa de informes, algo que la mayoría de las herramientas de reportes para agencias no hacen. Me gusta que los paneles de Scoro extraen datos en vivo de presupuestos, registros de tiempo y hitos de proyectos simultáneamente, por lo que mi equipo puede ver la rentabilidad y utilización sin cambiar de plataforma. En la práctica, eso significa que puedo rastrear si un cliente con tarifa mensual es realmente rentable en tiempo real, no solo al momento de facturar. Para las agencias que necesitan que los informes reflejen la imagen completa de cómo el trabajo y el dinero se mueven juntos, Scoro lo hace muy bien.
Características clave de Scoro
- Plantillas de reportes predefinidas: Acceso a plantillas creadas por expertos que cubren productividad, utilización, ingresos, costos y ventas sin tener que generar reportes desde cero.
- Seguimiento de tarifas mensuales: Monitorea el trabajo recurrente de clientes, incluyendo el tiempo registrado y presupuesto consumido, para cada tarifa mensual en tiempo real.
- Reportes de utilización de recursos: Detecta brechas de capacidad y desequilibrios de carga de trabajo en tu equipo antes de que afecten la entrega.
- Información impulsada por IA: Utiliza la IA integrada de Scoro para obtener información instantánea y automatizar acciones directamente en la plataforma.
Integraciones de Scoro
Scoro ofrece integraciones nativas con Xero, QuickBooks, Zapier, Google Calendar, Slack y Dropbox, y proporciona una API para integraciones personalizadas.
Pros and Cons
Pros:
- Combina datos de proyectos, finanzas y reportes
- Plantillas de reportes predefinidas para agencias
- Reporte de utilización de recursos y carga de trabajo
Cons:
- No cuenta con conectores de análisis de marketing integrados
- La creación de reportes personalizados puede ser restrictiva
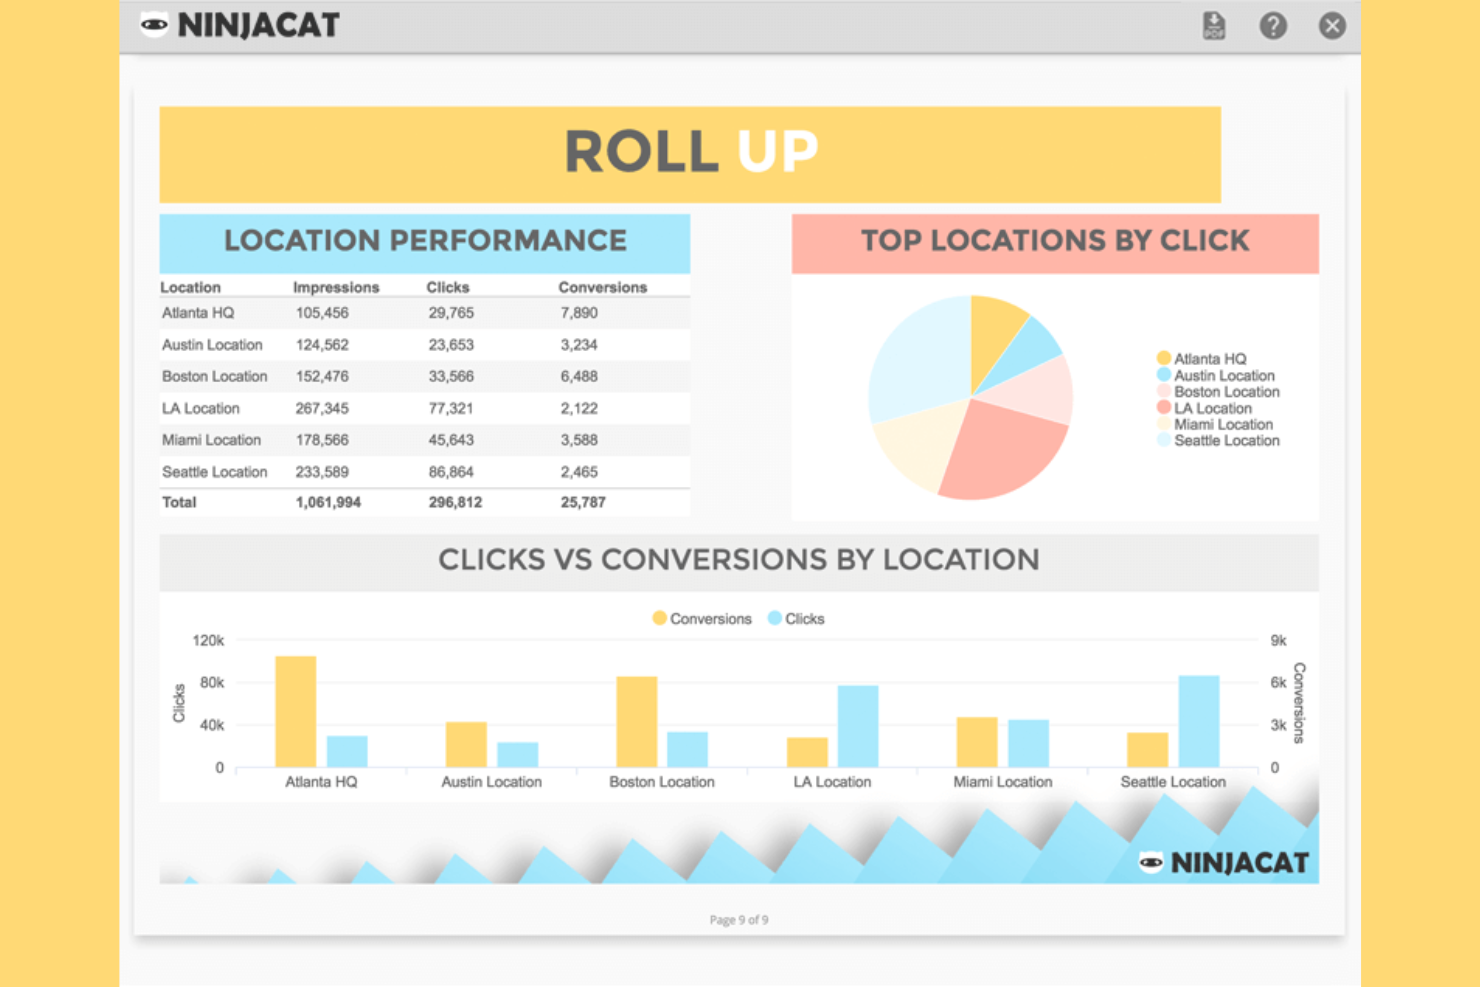
NinjaCat es una plataforma de generación de informes de marketing creada para agencias y empresas de medios que necesitan unificar datos de campañas, llamadas y gastos en un solo lugar. Si deseas automatizar los informes para clientes en múltiples canales publicitarios y rastrear el rendimiento hasta el nivel de cada llamada, vale la pena considerar NinjaCat.
¿Para quién es mejor NinjaCat?
Agencias de marketing y equipos de medios que gestionan campañas multicanal y reportes de clientes a escala.
Por qué NinjaCat es una buena alternativa a TapClicks
He seleccionado NinjaCat porque gestiona el flujo completo de informes para agencias que manejan múltiples clientes entre diferentes canales, incluyendo campañas de comercio electrónico. Me gusta que combina el seguimiento de llamadas con los datos de medios pagados en una sola vista, ayudándome a presentar una imagen completa del rendimiento. Sus reportes globales facilitan la agregación de datos entre diferentes cuentas, sin dejar de profundizar en los detalles, y funciones como usuarios ilimitados apoyan el crecimiento de los equipos. A pesar de sus capacidades avanzadas, la plataforma mantiene una curva de aprendizaje asequible, lo que facilita escalar los informes sin mayor complejidad.
Características clave de NinjaCat
- Widget de Insights de IA: Genera resúmenes de datos y narrativas en lenguaje sencillo directamente junto a los widgets del panel o en los informes.
- Galería de plantillas de informes: Comienza con plantillas prediseñadas o guarda tu propio diseño maestro para reutilizarlo entre clientes y campañas.
- Cálculo de márgenes de agencia: Incorpora las comisiones de la agencia directamente en métricas calculadas como CPC o CPM dentro de los informes.
- Paneles interactivos para clientes: Comparte paneles en tiempo real con permisos para que los clientes puedan filtrar y explorar datos cuando lo deseen.
Integraciones de NinjaCat
NinjaCat ofrece integraciones nativas con Google Ads, Facebook, Google Analytics 4, Google Sheets, LinkedIn, Facebook Insights y más. Hay conectores personalizados disponibles para fuentes de datos adicionales.
Pros and Cons
Pros:
- Integra el seguimiento de llamadas con los informes publicitarios
- Admite informes para múltiples ubicaciones y franquicias
- Ofrece paneles personalizables de marca blanca orientados al cliente
Cons:
- No incluye herramientas integradas de SEO o analítica web
- El editor de plantillas de informes puede resultar limitado
Otras alternativas a TapClicks
Aquí tienes algunas otras alternativas a TapClicks que no entraron en mi lista principal, pero que todavía merecen una revisión:
- DashThis
Ideal para informes automatizados de agencias
- Supermetrics
Ideal para la automatización de datos de marketing
- Reporting Ninja
Mejor para informes de marca blanca


Criterios de selección de alternativas a TapClicks
Al seleccionar las mejores alternativas a TapClicks para esta lista, tomé en cuenta necesidades típicas de los compradores y puntos de dolor relacionados con productos de software de informes para agencias, como la gestión de datos multicanal y la automatización de reportes periódicos para los clientes. También utilicé el siguiente marco para mantener mi evaluación estructurada y justa:
Funcionalidad principal (25% de la puntuación total)
Para ser consideradas en esta lista, cada solución debía cumplir estos casos de uso:
- Conexión con múltiples fuentes de datos de marketing
- Creación y personalización de informes para clientes
- Automatización de la programación y entrega de reportes
- Visualización del rendimiento de campañas y canales
- Soporte para marca blanca para agencias
Funciones adicionales destacadas (25% de la puntuación total)
Para acotar aún más la competencia, también busqué funciones únicas, como:
- Resúmenes de rendimiento generados por IA
- Informes narrativos dinámicos con valores de métricas en vivo
- Modo presentación para reuniones de clientes en tiempo real
- Gestión multi-cuenta para agencias
- Controles de permisos avanzados para acceso de clientes
Usabilidad (10% de la puntuación total)
Para evaluar la usabilidad de cada sistema, consideré lo siguiente:
- Panel de control y generador de informes intuitivos
- Diseño de interfaz limpio y moderno
- Navegación lógica entre fuentes de datos e informes
- Mínimos clics para acceder a las funciones principales
- Rendimiento rápido con grandes volúmenes de datos
Incorporación (10% de la puntuación total)
Para evaluar la experiencia de incorporación en cada plataforma, consideré lo siguiente:
- Disponibilidad de recorridos guiados paso a paso por el producto
- Acceso a vídeos de formación y seminarios web
- Plantillas predefinidas para tipos comunes de informes
- Chatbots integrados o configuración guiada
- Documentación clara para integraciones y configuración
Atención al cliente (10% de la puntuación total)
Para evaluar los servicios de atención al cliente de cada proveedor de software, tomé en cuenta lo siguiente:
- Disponibilidad de chat en vivo o soporte en tiempo real
- Capacidad de respuesta a los tickets y soporte por correo electrónico
- Acceso a un centro de ayuda o base de conocimientos con función de búsqueda
- Disponibilidad de especialistas en incorporación o responsables de cuenta
- Foros comunitarios o grupos de usuarios para soporte entre pares
Relación calidad-precio (10% de la puntuación total)
Para evaluar la relación calidad-precio de cada plataforma, tuve en cuenta lo siguiente:
- Planes de precios transparentes y flexibles
- Características incluidas en cada nivel de precio
- Disponibilidad de prueba gratuita o plan gratuito
- Sin cargos ocultos por integraciones o usuarios
- Escalabilidad para necesidades crecientes de la agencia
Opiniones de los clientes (10% de la puntuación total)
Para obtener una idea de la satisfacción general del cliente, tuve en cuenta lo siguiente al leer las reseñas de los usuarios:
- Valoraciones positivas sobre la automatización de informes
- Satisfacción con la fiabilidad de las integraciones
- Comentarios sobre la calidad del soporte al cliente
- Opiniones de usuarios sobre la personalización de paneles
- Problemas reportados relacionados con precisión de datos o caídas del sistema
¿Por qué buscar una alternativa a TapClicks?
Aunque TapClicks es una buena opción de software de informes para agencias, existen varias razones por las que algunos usuarios buscan soluciones alternativas. Puede que estés buscando una alternativa a TapClicks porque…
- Necesitas opciones más flexibles de personalización de marca (white-label)
- Quieres integraciones más profundas con herramientas de marketing especializadas
- Requieres características más avanzadas de visualización de datos
- Necesitas mejor soporte para la gestión de múltiples cuentas
- Deseas un proceso de incorporación más sencillo para nuevos usuarios
Si alguna de estas razones te resulta familiar, has llegado al lugar adecuado. Mi lista incluye varias opciones de software de informes para agencias que se adaptan mejor a equipos que enfrentan estos desafíos con TapClicks y buscan soluciones alternativas.
Principales características de TapClicks
A continuación, te presento algunas de las funcionalidades clave de TapClicks, para que puedas contrastar y comparar lo que ofrecen las soluciones alternativas:
- Panel de control de marketing unificado: TapClicks reúne datos de múltiples canales de marketing en un solo panel personalizable, lo que facilita monitorear el desempeño de las campañas de un vistazo.
- Informes automatizados: Programa y automatiza la generación periódica de informes para clientes, de modo que tu equipo pueda entregar información actualizada sin esfuerzo manual.
- Conectores de datos: TapClicks ofrece una amplia gama de conectores integrados para plataformas como Google Ads, Facebook Ads, LinkedIn y más, permitiéndote recopilar datos de docenas de fuentes de marketing.
- Marca blanca: Las agencias pueden personalizar completamente los paneles y los informes con sus propios logotipos, colores y dominio, brindando una experiencia fluida al cliente.
- Controles de acceso según el rol: Asigna diferentes niveles de permisos a miembros del equipo y clientes, asegurando que las personas correctas tengan acceso a los datos adecuados.
- Herramientas de transformación de datos: Limpia, mapea y combina datos de diferentes fuentes utilizando las funciones de transformación integradas de TapClicks, para que puedas crear informes integrados incluso a partir de conjuntos de datos dispares.
- Gestión de campañas: Supervisa, administra y optimiza campañas de marketing directamente en la plataforma, incluyendo control de presupuesto y alertas de rendimiento.
- Portal para clientes: Ofrece a los clientes acceso seguro y en tiempo real a sus propios paneles e informes a través de un portal dedicado.
- Biblioteca de visualizaciones: Elige entre una variedad de tipos de gráficos, diagramas y widgets para presentar los datos de la manera más impactante para tu audiencia.
- Acceso por API: Integra TapClicks con tus propios sistemas o flujos de trabajo personalizados mediante su API, permitiendo automatizaciones avanzadas y sincronización de datos.