

10 melhores ferramentas de inteligência empresarial para tomar melhores decisões em 2026

10 Lista restrita das melhores ferramentas de BI


As ferramentas de inteligência empresarial ajudam as equipas a transformar dados brutos em informações úteis, consolidando informações, visualizando tendências e apoiando uma tomada de decisões mais inteligente. Quer esteja a acompanhar KPIs, a analisar o comportamento dos clientes ou a prever receitas, a ferramenta de BI certa pode revelar padrões que impulsionam o crescimento e melhoram o desempenho em toda a sua organização.
Para o ajudar a escolher a plataforma certa, testei e analisei as principais ferramentas de inteligência empresarial com base nas suas capacidades de integração de dados, funcionalidades de painéis, facilidade de utilização e escalabilidade. Este guia destaca as melhores ferramentas de BI disponíveis em 2026, para que possa encontrar uma que satisfaça as necessidades de dados da sua equipa e apoie a tomada de decisões estratégicas.
O que são ferramentas de inteligência empresarial?
As ferramentas de inteligência empresarial são aplicações de software que recolhem, analisam e visualizam dados para ajudar as organizações a tomar decisões mais inteligentes e baseadas em dados.
Consolidam informações de fontes como bases de dados, folhas de cálculo e serviços na nuvem em painéis e relatórios interativos. Com funcionalidades como análise em tempo real, visualização de dados e elaboração de relatórios, as ferramentas de BI transformam dados brutos em informações úteis para equipas de vários departamentos.
Why Trust Our Software Recommendations
Our team has been testing and reviewing software since 2012. As project managers ourselves, we know how difficult—and important—it is to choose the right software.
For this guide, we evaluated tools using hands-on testing and independent research, scoring tools using our selection criteria. We also draw on insights from industry thought leaders and practicing project management experts.
Our reviews reflect our human editorial judgment, not a sales pitch.
Expert reviewers:
Tabela comparativa das ferramentas de inteligência empresarial
Pode utilizar a tabela seguinte para encontrar a melhor ferramenta de BI para as suas necessidades:
| Tool | Best For | Trial Info | Price | ||
|---|---|---|---|---|---|
| 1 | Best business intelligence tool for small companies | 15-day free trial | From $30/month (billed annually) | Website | |
| 2 | Best enterprise business intelligence tool | 14-day free trial | Pricing upon request | Website | |
| 3 | Best database BI reporting tool | Free trial + free demo available | Pricing upon request | Website | |
| 4 | Best for sharing analytics with external vendor portals | 30-day free trial | Pricing upon request | Website | |
| 5 | Best business intelligence API for building analytics into your products and tools | 7-day free trial | Pricing upon request | Website | |
| 6 | Best for integrating over 150 data sources | Free trial available | From $39/user/month (billed annually) | Website | |
| 7 | Best for real-time cross-channel journey mapping | Free trial available | Pricing upon request | Website | |
| 8 | Best for building and embedding dashboards in your applications | Free trial + free demo available | From $265/month (billed annually) | Website | |
| 9 | Best for Jira integration & custom views | Free plan available | From $18/user/month | Website | |
| 10 | Best business intelligence solution for Microsoft users | Free plan available | From $14/user/month (billed annually) | Website |
Visão geral das melhores ferramentas de inteligência empresarial
Eis uma visão geral das melhores ferramentas de BI atualmente disponíveis no mercado:

Best business intelligence tool for small companies

Zoho Analytics is a great business intelligence tool for small businesses, given their large feature set, simple interface, and affordable pricing for a small number of users. For one tour operator managing 17 multi-day trips, Zoho Analytics proved invaluable: “I have used Zoho Analytics to monitor guide performance, guest ratings and trip logistics on all our 17 multi-day tours. Zoho Analytics assisted me in revealing the trends of guest behavior and trip flow in the rural areas. It allowed us to reduce overtime by monitoring inefficiencies that we could not see on spreadsheets.”
This tool lets you pull data from a wide range of sources and build out intuitive and functional reports in order to analyze the visualized data. AI assistant “Zia” will answer questions typed into a query box using the data collected, combined with machine learning and natural language processing technologies.
Zoho Analytics takes the prize for my favorite in features and functionality. While most of the software reviewed here can sport a robust BI system, Zoho goes above and beyond with features like their AI assistant, their focus on ease of collaboration, tons of third party integration options, and Android and iOS mobile apps.
A few minor cons for Zoho include that the SQL tutorials could be built out a little bit better. Additionally, the reporting pivot view/summaries would benefit from having an “OR” or “CONTAINS” command in order to better pull out the data that you need.
They have integrations with Zoho Analytics, SAlesforce CRM, Microsoft Dynamics CRM, Hubspot CRM, Mailchimp, Google Analytics, Bing Ads, Zoho Surveys, Survey Monkey, Facebook, TWitter, YouTube,QuickBooks, Xero, Shopify, Zendesk, and more.
Zoho Analytics starts from $24/month for 2 users and has a free 15-day trial.
New Product Updates from Zoho Analytics

Zoho Analytics Adds Exogenous Variables to Multivariate Forecasting
Zoho Analytics introduces exogenous variables for multivariate forecasting using the VARX model. This helps forecasts account for external drivers such as marketing spend, discounts, and seasonality. For more information, visit Zoho Analytics’ official site.
 .

Tableau
Best enterprise business intelligence tool

Tableau is a robust, scalable analytics platform with desktop, cloud, or on-site options. It boasts an interactive, visual analysis style and allows you to securely consume your data via browser, desktop, mobile, or embedded into any application. They offer over 900 learning resources, including over 100 training videos. For Gianluca Ferruggia, General Manager at DesignRush, Tableau’s impact was immediate: “Tableau transformed our unrefined data into graphic stories, its drag-and-drop dashboards changed the game by enabling us to see trends our spreadsheets were hiding.”
They excel in a specific area of the features and functions evaluations criteria section: flexibility. Tableau is easily scalable; offered by server, desktop and/or cloud; available on all device types, be it PC or smartphone; and they have free analytics resources for students, educators and smaller not-for-profits. Whatever your niche, you are sure to find something that fits.
Tableau can join with data collection systems like ServiceNow, Splunk, and Google Analytics. Other integrations, or “Technology Partners as they call them, include 0xdata, AIMMS, Aircloak, AllSight, Amazon Web Services, Astera, Axiomatics, Birst, Datawatch,
Element Analytics, Google Cloud Platform, IBM, Microsoft, and many, many more.
The pricing is a bit steep to begin with and costs go up at the end of the year long contract. Multi-year contracts are not available, so they got dinged in our value for cost section because of the high and shifting price schema, which can come across as predatory.
Tableau starts at $70/user/month and has a free 14-day trial.

Looker
Best database BI reporting tool

Create easy-to-read reports and visual-oriented interactive dashboards that display data-rich actionable insight for defining business metrics, locating value, and discovering interconnectivity between tables. Resources and features include custom applications, embedded visualizations, data science workflows, the ability to host on Public Clouds (like AWS and GCP), and more. For Amit Chandak, Chief Analytics Officer at Kanerika Inc, Looker proved to be a powerful solution for client data challenges: “We used Looker to deliver real-time, trusted insights for a client struggling with fragmented data—once implemented, reporting speed improved by 50% and decision-making accelerated significantly thanks to clear, actionable dashboards.”
They offer a free interactive training course and many other tutorial-like resources, which is why I was able to score them so highly in the usability section of the evaluation criteria. Beneath the “Getting Started” tab, you’ll notice that they have plenty of self-help resources for viewing raw data, building tools, and developing models.
The downfall of this software is that writing the queries is not incredibly user friendly. On top of that, data analytics tasks take a significant amount of time to render and run queries. When it comes to big data, it may get sluggish.
They connect with databases from Redshift, Snowflake, BigQuery, as well as 50+ supported SQL dialects like Amazon Redshift, Google BigQuery, Snowflake, MySQL, Oracle, Amazon Athena, Amazon Aurora, and more.
Looker starts at $3,000/month for 10 users ($50/additional user) and has a free demo.
Domo
Best for sharing analytics with external vendor portals
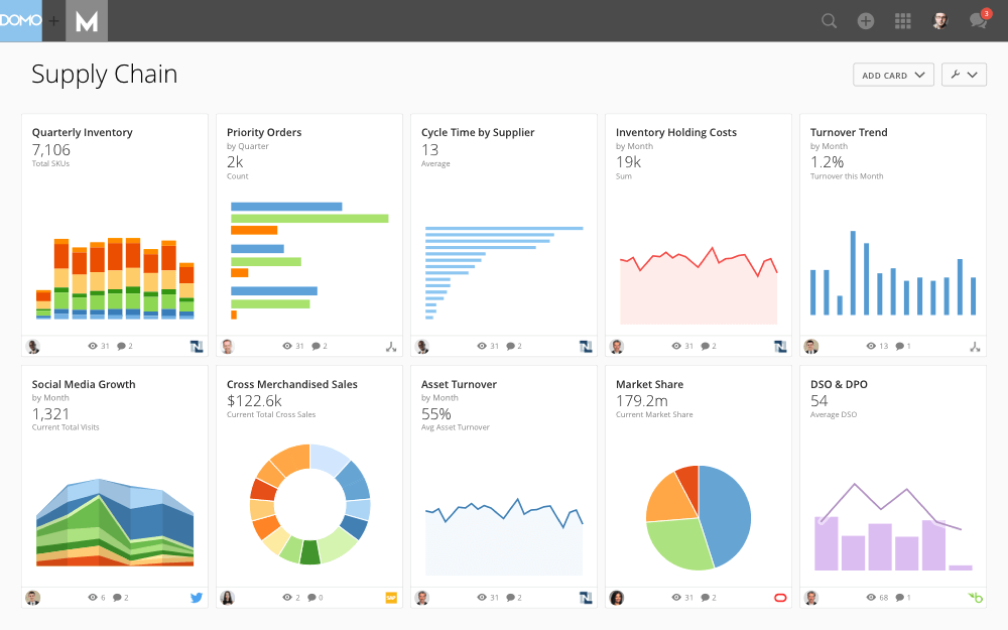
The Domo Business Cloud is a platform that lets you aggregate data from multiple sources and build custom workflow apps. Their features include dashboards and reporting, machine learning, predictive analytics, and external self-service reporting. For many organizations, Domo’s ability to step in when other tools fall short is a major advantage. Nicola Leiper, the Director and Head of Project Management at Espresso Translations, shared her experience: “Excel crashed and Domo rescued our largest customer relationship. Domo not only organized our data but saved our reputation and exposed some of the underperforming parts of our operations that cost us thousands.”
I like the focus that Domo places on your external relationships with vendors and other stakeholders. The name is Domo Everywhere, and it’s a feature that lets you build portals for your external partners. Therefore, they can analyze the data you decide to share with them on their own and draw their own insights.
Further, the data visualization boards are independent widgets that can be edited, filtered, and resized with a couple of clicks. Lastly, the platform allows you to set permissions on both internal and external users, regardless of the account (Domo or not Domo).
Domo integrates with external data sources through their 1000+ pre-built connectors, which include Shopify, Salesforce, Amazon S3, Adobe Analytics, Sharepoint, and Survey Monkey.
Domo has a free trial available, and prices can be quoted upon request.

Sisense
Best business intelligence API for building analytics into your products and tools

A hybrid-cloud platform built to leverage all of your data together and make it available to you through interactive dashboards, self-service analytics, and/or white-labeled BI apps. They offer support, analytics, and reporting for business areas such as customer service measurables, digital marketing, finances, human resources, retail and eCommerce, IT analytics, and more.
As far as our usability and UI evaluation criteria expectations, I found that Sisense is easy to use, easy to instal and setup, and sports an intuitive interface and streamlined UX. The customer service team is responsive and adaptive so this would be a decent choice for companies with lower levels of technology experience who might need some extra assistance.
A few cons include that the marketing connector could be more robust. Also, some functions are so simplified that they get in the way, for example not having to write a query seems like a time saving mechanism until your needs don’t match their pre-existing data and you have to jump through hoops to find a creative solution to get what you need.
Use ODBC to connect directly to Sisense’s powerful back-end from any third party application you like, from Excel to popular data visualization and reporting tools. They also offer a marketplace for extensions and plug-ins that they or their partners provide for use. Some are available free and others are only available with a premium account.
Sisense offers custom pricing and has a free demo as well as a free trial.

Best for integrating over 150 data sources

Supermetrics is a powerful data integration tool that simplifies the collection and analysis of marketing data, making it an essential resource for business intelligence (BI). By enabling users to aggregate data from over 150 different sources, including major platforms like Google Ads, Facebook Ads, and LinkedIn Ads, Supermetrics ensures that businesses can compile comprehensive datasets for more informed decision-making. For example, Baris Zeren, CEO of Bookyourdata, explained how impactful the platform has been for his team: “Supermetrics has made reporting easier because it automatically pulls data on marketing and sales into one dashboard. It is unique in that it saved the team hours per week and provided us with a cohesive and consistent perspective on campaign efficacy.”
One of the standout features of Supermetrics as a BI tool is its automation capabilities. Users can set up automated data transfers, which ensure that their reports are always populated with the latest data without manual intervention. This automation extends to the scheduling of regular data imports,
Supermetrics also offers robust data transformation options. Users can filter, combine, and modify data before it reaches its final destination, allowing for customized reports that meet specific business requirements. These transformation capabilities are critical for BI, as they enable businesses to tailor their data to uncover precise insights and trends. The tool’s compatibility with leading BI platforms such as Google Data Studio and Power BI further enhances its utility, allowing for sophisticated data visualization and analysis.
Additionally, Supermetrics supports a wide array of integrations with various marketing and sales platforms, like Google Analytics, HubSpot, Shopify, and Salesforce, ensuring that all relevant data can be consolidated into a single source of truth.

Best for real-time cross-channel journey mapping
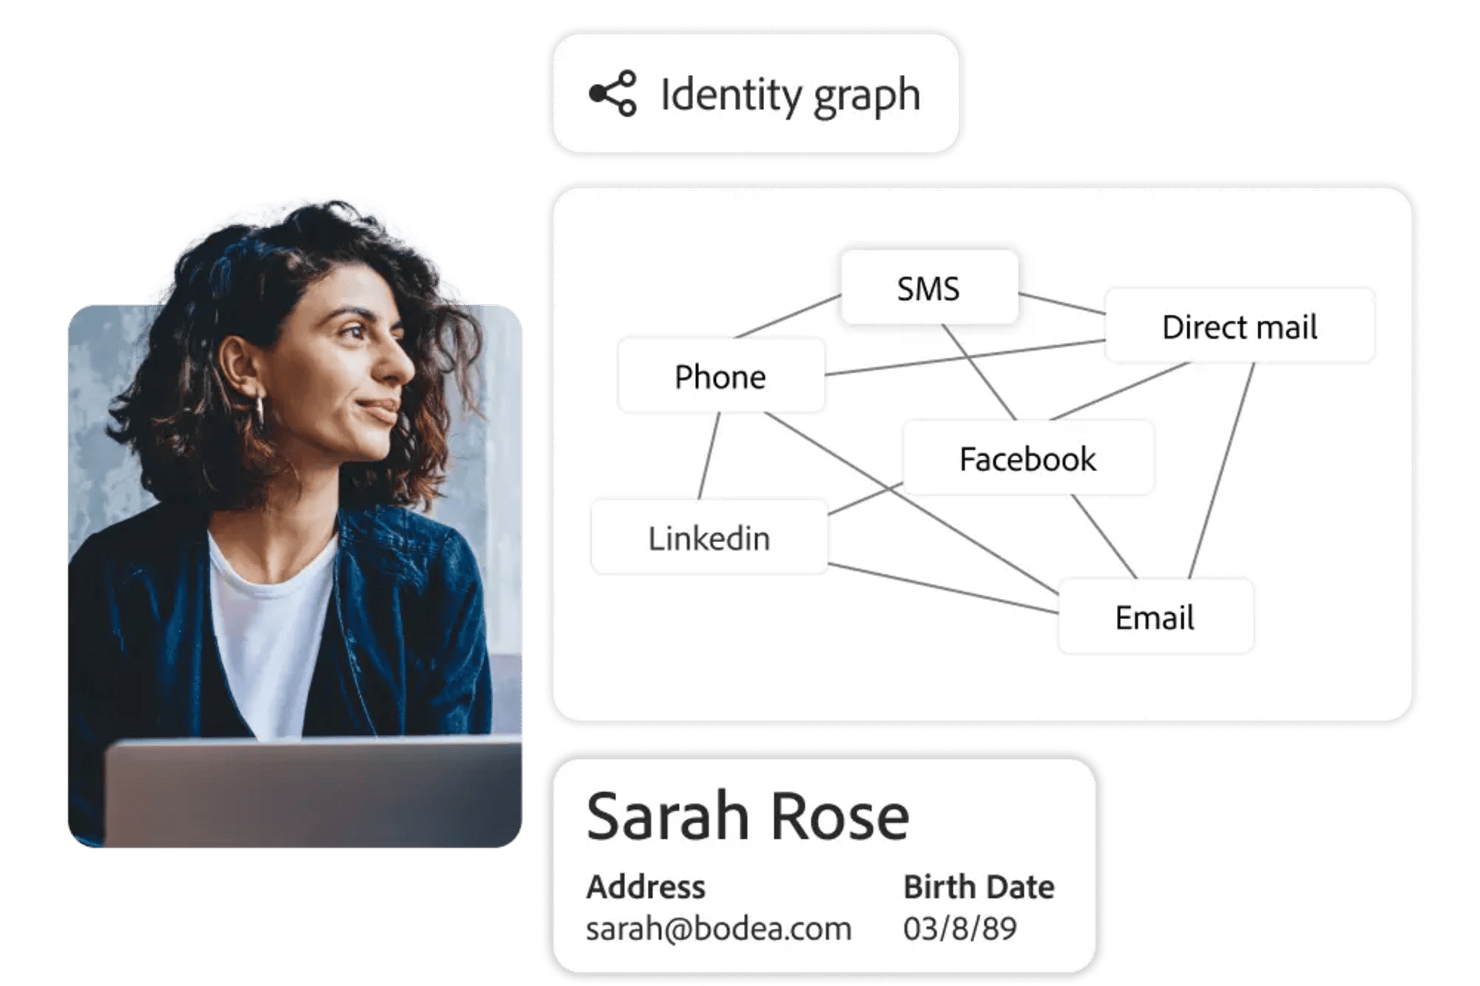
Adobe Customer Journey Analytics is a business intelligence tool that lets you analyze and visualize customer journeys across multiple channels using real-time data, customizable dashboards, and advanced analytics features.
Who Is Adobe Customer Journey Analytics Best For?
Marketing and analytics teams at large enterprises who need to analyze complex, multi-channel customer journeys.
Why I Picked Adobe Customer Journey Analytics
I picked Adobe Customer Journey Analytics as one of the best because I can map customer journeys across web, mobile, and offline channels in real time. I use its visual flow analysis to see how users move between touchpoints and spot drop-off points instantly. My team relies on its unified data model to blend data from multiple sources, so we always have a complete view of the customer experience.
Adobe Customer Journey Analytics Key Features
- Customizable dashboards: Build interactive dashboards to visualize and share key metrics with your team.
- Advanced segmentation: Create granular audience segments based on behavior, demographics, or custom criteria.
- Scheduled reporting: Automate report delivery to stakeholders on a set schedule.
- Data connectors: Import and unify data from CRM, ecommerce, and other external systems.
Adobe Customer Journey Analytics Integrations
Adobe Customer Journey Analytics offers native integrations with Adobe Experience Platform, Adobe Analytics, Adobe Target, Adobe Audience Manager, and Adobe Campaign. It also provides an API for custom integrations and supports connections to external data sources through Adobe Experience Platform connectors.
Pros and Cons
Pros:
- Flexible calculated metrics and custom data views
- Deep integration with Adobe Experience Platform
- AI-powered anomaly detection and root cause analysis
Cons:
- Advanced features may require technical expertise
- Limited native integrations outside Adobe products

ClicData
Best for building and embedding dashboards in your applications

ClicData is a data aggregation platform with over 250 connectors. This allows you to bring data from anywhere in the company. After, a data warehouse stores that information and makes it available for you to design real-time dashboards.
The last step is for you to design your dashboard. ClicData's dashboard designer has a drag-and-drop functionality that makes it easy to build your data visualizations. Add elements like annotations, Gauges, maps, audio, tables, and any graph you can think of. After that, you can embed your charts in a website, portal or ERP using its API.
Although the platform does not offer any out-of-the-box, prebuilt integrations, its API is available for your IT team to do it. The API enables integrated software to send information to ClicData as soon as it’s received, so you can always see real-time updated information.
ClicData paid plans start at $75/month and offer a 15-day free trial.

Visor
Best for Jira integration & custom views
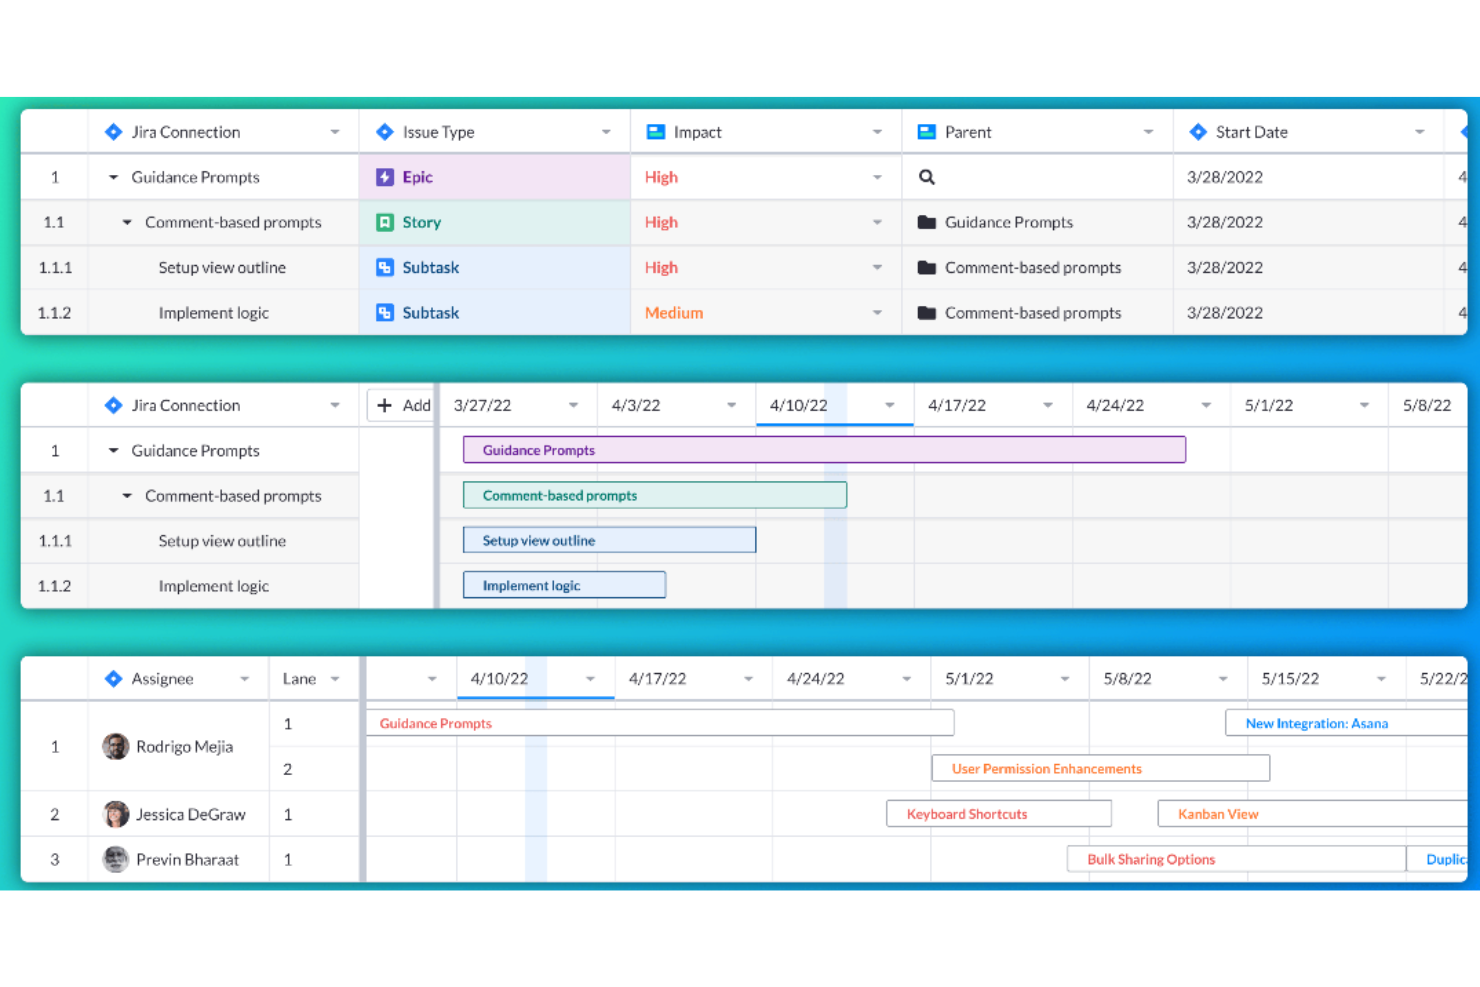
Visor is a workspace tool that connects to various SaaS applications, aiming to bring people together with data for a more collaborative work environment. It allows users to create custom views and visualizations of their nested Jira data, offering bi-directional integration with Jira for accurate and customizable sharing.
Visor operates as a workspace tool that enhances the functionality of SaaS applications by providing users with a unified view of their data. Visor also emphasizes secure sharing, featuring a straightforward drag-and-drop interface for ease of use. It additionally includes an advanced JQL importer and supports over 75 Jira field types, catering to a wide range of data management needs.
Moreover, Visor facilitates collaboration and communication among team members, with features such as Gantt charts, roadmaps, and the ability to customize views with colors and conditional formatting. This can save time and improve the efficiency of project planning and reporting processes.
Visor integrates with Salesforce, Jira, and HubSpot.
Pricing for Visor starts from $9/user/month.


This is a business analytics solution that lets you connect, model, and then explore raw data in order to create reports using built-in or from-scratch visuals and learn from actionable insight. Power BI features interactive data visualizations, robust semantic models, an application lifecycle management (ALM) toolkit, an open connectivity framework, and more.
As far as out value for cost evaluation criteria goes, Power BI stands out. Why? Paginated and interactive reports can be made available for personnel inside or outside your organization without having to purchase additional licenses. Power BI Desktop is also free to use.
A few notes: Jumping into Power BI with limited Excel experience/skill will result in a steep learning curve for the user. Also, note that a Pro Account dashboards can only be shared with and viewed by other Pro Account holders within your organization.
As you can imagine, this Microsoft owned software integrates well with other Microsoft products like Excel, as well as Salesforce CRM, SQL Server Database, Oracle Database, IBM databases, Amazon Redshift, Google BigQuery, Google Analytics, Adobe Analytics, Facebook analytics, and others.
Power BI starts at $9.99/user/month and has a free 60-day trial.
Outras opções
Na minha pesquisa, encontrei algumas ferramentas que não chegaram a entrar na lista, mas que ainda assim merecem uma menção.
- Logi Analytics
Out-of-the-box embedded business analytics tool for software teams
- Coefficient
For integrating data into spreadsheets
- InetSoft
Data intelligence tool for scalable architecture and advanced modeling
- Metric Insights
Enterprise BI portal builder
- Exago BI
Business intelligence reporting tool for beginners and non-technical folks
- Izenda
Business intelligence software for embedding in web-based applications
- ClickUp
For BI tool integrations
- Klipfolio
Intuitive data visualization software for companies of all sizes.
- Funnel
Easy to understand and manipulate marketing and advertising data.
- Improvado
150+ integrations – like Facebook Ads, Google Analytics, YouTube and LinkedIn – to plot all marketing initiatives on one dashboard.
- AgencyAnalytics
SEO, PPC, social, email, review and call tracking dashboards all-in-one system.
- AnswerRocket
A searchable database of statistics and reports that is designed to answer questions of the everyday user.
- Tray
An iPaaS solution with API integration, CSV automation and an easy drag-and-drop workflow.
- ClicData
A business intelligence platform complete with a data warehouse, processing and management, dashboard designer and automation.
- BrightFunnel
Easy to understand and manipulate marketing and advertising data.
- Adaptive Insights
Modernized planning, modeling, budgeting, and forecasting tools.


How I Evaluate Business Intelligence Tools
I look at every BI tool through two lenses: the baseline requirements—connectors, dashboards, self-service reporting—and the differentiators that matter for PMO teams managing portfolio-level data.
Core Functionality (Table Stakes For This List)
When I'm selecting tools for my list, I rank each one on a scale from 0 (does not offer the functionality) to 5 (excels in this area) for each core functionality listed below. Then, I calculate the tool's total score into a percentage. Each tool needs to achieve a minimum total score of 65% to be considered for inclusion.
- Data Connectors & Integrations: I check whether a tool can pull directly from PM platforms like Jira, Asana, or Smartsheet, plus databases and spreadsheets, without manual exports.
- Interactive Dashboards: Each tool should let you build filterable, drill-down dashboards—like clicking a red-flagged project to see which tasks are driving the delay.
- Data Visualization Options: I evaluate the range of chart types available, from Gantt-style timelines and heatmaps to burndown charts that map delivery against sprint targets.
- Ad Hoc Report Building: Project stakeholders constantly need one-off reports. I look for drag-and-drop builders with scheduling, so a PMO lead can set up a weekly status report once.
- Data Modeling & Transformation: Combining data from multiple sources matters. I evaluate whether you can blend, say, Jira velocity data with budget actuals from a spreadsheet into one model.
- Self-Service Analytics: The best BI tools let non-technical project managers explore data on their own. I look for guided exploration, governed datasets, and low-barrier entry points.
Once I have a list of tools that meet the criteria, I consider what sets each platform apart.
Differentiating Factors (What Sets Vendors Apart)
Here's how I compare and contrast different vendors:
Standout Features
AI-powered insights can flag budget overruns or delivery risks before a PMO lead spots them manually, so I evaluate how well each tool surfaces anomalies and forecasts trends. Embedded analytics also matter—being able to view a portfolio health dashboard inside Jira or Confluence keeps teams from context-switching. I look for collaborative annotations too, where stakeholders tag each other on a metric and trigger follow-up tasks directly from the dashboard.
Beyond Features
Total cost of ownership is a big one—I evaluate whether licensing separates viewers from creators, since a PMO with 50 report consumers and 3 builders shouldn't pay the same per-seat rate for everyone. Governance matters just as much, especially row-level security that restricts portfolio data by business unit or client. I also consider time-to-value: tools with pre-built project management dashboard templates get teams reporting weeks faster than platforms that require everything from scratch.
Como escolhi as melhores ferramentas de BI
Comecei por selecionar uma lista extensa de ferramentas populares com base em avaliações e classificações de utilizadores. Depois, reduzi a lista analisando as principais funcionalidades que a minha experiência me mostrou serem necessárias numa ferramenta de BI. Por fim, selecionei os critérios abaixo como base da minha avaliação.
Interface do utilizador (UI)
A sua plataforma de BI é um espaço onde analisa dados empresariais e, através da modelação de dados, os consulta sob a forma de gráficos e outras representações visuais que melhoram a tomada de decisões. Por isso, a interface deve ser simples, intuitiva e utilizar adequadamente os espaços em branco.
Facilidade de utilização
A ferramenta deve ser fácil de aprender e dominar. Ferramentas como o Microsoft Power BI, por exemplo, têm uma interface de arrastar e largar que pode utilizar nos elementos gráficos para alterar as informações analisadas. A ferramenta de BI deve ter funcionalidades deste tipo, bem como documentação de apoio adequada, formação e vídeos tutoriais para o ajudar a utilizar a ferramenta mais rapidamente.
Funcionalidades e capacidades
Quantas das principais funcionalidades e funções das ferramentas de elaboração de relatórios para a gestão disponibiliza e quão poderosas são? Especificamente, procurei:
- Painéis personalizáveis: As melhores soluções de BI oferecem uma apresentação num único ecrã com várias visualizações, juntamente com a possibilidade de interligar as visualizações (para que quaisquer filtros ou seleções afetem todas as visualizações) ou manter cada uma como independente. Deve refletir as alterações em tempo real e permitir-lhe criar apresentações personalizadas dos dados principais.
- Exploração detalhada e filtros de dados: Analisar informações detalhadas é fundamental. Isto inclui funcionalidades como menus pendentes, filtros de pesquisa e segmentadores, bem como a possibilidade de explorar os detalhes e regressar aos resumos dos dados.
- Interface baseada na Web para clientes: É mais simples quando as soluções de elaboração de relatórios destinadas aos clientes disponibilizam interfaces de cliente baseadas na Web, uma vez que são mais eficientes e fáceis de administrar do que as interfaces de cliente baseadas no ambiente de trabalho.
- Relatórios agendados e automatizados: A ferramenta deve ajudá-lo a monitorizar facilmente o progresso. Isto inclui a possibilidade de agendar atualizações automáticas para serem enviadas às equipas, enviar relatórios automáticos aos clientes e configurar notificações automáticas para tomar conhecimento de datas ou limites importantes.
- Criação de diagramas de elevada qualidade: As ferramentas básicas incluem tipos de gráficos de barras, linhas, circulares, de áreas e de radar, enquanto os diagramas mais avançados incluem mapas de calor, gráficos de dispersão, gráficos de bolhas, histogramas e mapas geoespaciais. As melhores ferramentas de elaboração de relatórios permitem combinar diferentes opções para criar diagramas que utilizam uma combinação destas visualizações.
Integrações
Os conectores de dados ajudá-lo-ão a tirar o máximo partido de uma plataforma de BI. Uma forma de o conseguir é através de integrações de dados com outro software baseado na nuvem, como o SAP ou o SAS. Por isso, procuro integrações pré-criadas, agregadores de software de terceiros, como o Zapier, e integrações personalizadas que utilizem APIs.
Preços
Um dos maiores fatores de influência nas decisões empresariais relacionadas com ferramentas é o preço. Por isso, procuro informações sobre casos de utilização, planos de preços mensais e quaisquer outras informações que possam ser úteis. Por exemplo, se existe uma versão gratuita que possa experimentar, um período de avaliação gratuito ou se está disponível como solução no local.
Perguntas frequentes sobre ferramentas de BI
Encontre respostas a perguntas comuns que outras pessoas fazem sobre este tema.
Como podem as ferramentas de inteligência empresarial ajudar os gestores de análise a tomar decisões estratégicas?
As ferramentas de inteligência empresarial ajudam os gestores de análise ao automatizar a recolha de dados e fornecer informações em tempo real através de painéis e visualizações. Pode comparar rapidamente as vendas entre regiões, acompanhar orçamentos e detetar problemas operacionais sem relatórios manuais. Muitas plataformas disponibilizam modelação preditiva e planeamento de cenários para prever resultados e orientar a estratégia. Com a narrativa de dados — que combina elementos visuais e narrativa — pode influenciar as decisões da direção e alinhar as equipas em torno de objetivos orientados por informações.
Quais são os desafios comuns de integração ao implementar ferramentas de BI em ambientes empresariais estabelecidos?
Os desafios de integração resultam frequentemente de sistemas informáticos desatualizados, dados isolados e formatos inconsistentes. Os ERP antigos ou as bases de dados desenvolvidas internamente podem ter dificuldades em estabelecer ligação a ferramentas de BI na nuvem, provocando erros de sincronização ou perda de dados. Dados de baixa qualidade podem distorcer os relatórios, enquanto protocolos de segurança rigorosos podem atrasar o acesso. Para resolver esta situação, audite os seus dados, envolva o departamento de TI desde o início, normalize os formatos e selecione plataformas de BI com forte interoperabilidade, como conectores nativos, suporte de API e capacidades de transformação de dados.
Como apoiam as ferramentas de BI a colaboração entre departamentos para os gestores empresariais?
As ferramentas de BI simplificam a colaboração entre equipas ao disponibilizarem uma única fonte de informação acessível a todos. Em vez de gerir várias versões de folhas de cálculo, os gestores podem criar painéis interativos que são atualizados automaticamente com os dados mais recentes. Os departamentos financeiro e comercial podem analisar previsões de receitas partilhadas, enquanto as operações e os recursos humanos acompanham as necessidades de pessoal. Funcionalidades como anotações em gráficos, atribuição de tarefas e alertas de KPI reduzem os mal-entendidos, tornam as reuniões mais eficientes e ajudam os departamentos a manter o alinhamento relativamente a objetivos partilhados.
Que métricas de desempenho devem os gestores empresariais acompanhar utilizando software de BI?
A escolha das métricas depende dos objetivos da sua empresa, mas algumas das mais comuns incluem o crescimento das receitas, a margem de lucro líquido, o custo de aquisição de clientes, o valor do ciclo de vida do cliente, a taxa de abandono e as despesas operacionais. Para equipas orientadas para projetos, pode também acompanhar as taxas de entrega atempada ou a utilização de recursos. As ferramentas de BI facilitam a criação de painéis automatizados para monitorizar estas métricas em tempo real. Defina limiares personalizados para acionar notificações caso uma métrica fique fora do intervalo pretendido. Ao longo do tempo, o acompanhamento destes KPI ajuda a identificar rapidamente as áreas que necessitam de atenção e a medir a eficácia de novas iniciativas.
Como se mede o ROI de uma plataforma de inteligência empresarial numa organização média ou de grande dimensão?
Comece por medir as poupanças diretas, como a redução do trabalho associado aos relatórios manuais. Por exemplo, se o departamento financeiro poupar 20 horas por mês, isso representa uma redução clara dos custos gerais. Em seguida, estime os ganhos de receita resultantes de decisões mais rápidas e precisas — como conquistar novas vendas ou reduzir custos através de melhores previsões. Acompanhe métricas como a redução dos erros nos relatórios, a obtenção mais rápida de informações e uma maior adoção dos dados. Compare estes benefícios com os custos totais — subscrições, integração, formação e suporte — para calcular o ROI e justificar o investimento contínuo.