

Le 10 migliori alternative a ThoughtSpot per l’analisi basata sull’IA nel 2026

Le migliori alternative a ThoughtSpot


Le migliori alternative a ThoughtSpot offrono strumenti di reportistica flessibili, analisi in tempo reale ed esplorazione autonoma dei dati senza una curva di apprendimento ripida. Se cerchi piattaforme di reportistica più performanti di ThoughtSpot, per adattarle al tuo flusso di lavoro, soddisfare requisiti di dati insoliti o contenere i costi, sei nel posto giusto.
Qui troverai opzioni affidabili che aiutano il tuo team ad analizzare i dati, creare pannelli di controllo interattivi e ottenere più rapidamente informazioni utili per prendere decisioni. Usa questa guida per confrontare funzionalità, punti di forza e motivi per cui ogni strumento potrebbe rappresentare il miglioramento di cui il tuo processo di reportistica ha bisogno.
Che cos'è ThoughtSpot?
ThoughtSpot è una piattaforma di analisi e reportistica autonoma che consente agli utenti di interrogare i dati utilizzando ricerche in linguaggio naturale. È progettata per aiutare i team aziendali a creare rapidamente report, analizzare le tendenze e visualizzare i dati senza dipendere da esperti di dati.
L'interfaccia intuitiva di ThoughtSpot consente agli utenti di esplorare grandi insiemi di dati, creare pannelli di controllo e condividere informazioni tra i team, rendendola popolare tra le organizzazioni che desiderano un accesso diretto e su richiesta all'intelligence aziendale.
Tabella di confronto delle alternative a ThoughtSpot
Questa tabella di confronto riassume i dettagli dei prezzi delle mie principali alternative a ThoughtSpot:
| Tool | Best For | Trial Info | Price | ||
|---|---|---|---|---|---|
| 1 | Ideale per la libreria di visualizzazioni metriche predefinite | Prova gratuita di 14 giorni | Da $120/mese (fatturazione annuale) | Website | |
| 2 | Ideale per la progettazione di dashboard interattive | Piano gratuito disponibile | Da $15/utente/mese (fatturazione annuale) | Website | |
| 3 | Ideale per dashboard esecutive automatizzate | Piano gratuito + prova gratuita + demo gratuita disponibili | Da $64/mese (fatturazione annuale) | Website | |
| 4 | Ideale per la connessione a fonti dati di app cloud | Prova gratuita di 30 giorni + demo gratuita disponibile | Prezzo su richiesta | Website | |
| 5 | Ideale per l’incorporamento personalizzato all’interno dei prodotti | Prova gratuita di 7 giorni + demo gratuita disponibile | Prezzo su richiesta | Website | |
| 6 | Miglior analytics cloud in stile foglio di calcolo | Demo gratuita disponibile | Prezzo su richiesta | Website | |
| 7 | Ideale per l'integrazione con gli strumenti Microsoft 365 | Prova gratuita + piano gratuito disponibili | Da $14/utente/mese (fatturazione annuale) | Website | |
| 8 | La migliore per flessibilità di visualizzazione open-source | Gratis per sempre | Gratis per sempre | Website | |
| 9 | Ideale per capacità di esplorazione associativa dei dati | Prova gratuita di 30 giorni + demo gratuita disponibile | Da $300/mese (fatturazione annuale) | Website | |
| 10 | Ideale per l’analisi in linguaggio naturale potenziata dall’AI | Demo gratuita disponibile | Prezzo su richiesta | Website |
Perché fidarsi dei nostri consigli sui software
Il nostro team testa e recensisce software dal 2012. In quanto project manager noi stessi, sappiamo quanto sia difficile — e importante — scegliere il software giusto.
Per questa guida, abbiamo valutato gli strumenti attraverso test pratici e ricerche indipendenti, assegnando un punteggio agli strumenti in base ai nostri criteri di selezione. Ci basiamo inoltre sulle competenze di leader di pensiero del settore e di professionisti attivi nella gestione dei progetti.
Le nostre recensioni riflettono il nostro giudizio editoriale umano, non un discorso di vendita.
Revisori esperti:
Recensioni delle migliori alternative a ThoughtSpot
Di seguito trovi i miei riepiloghi dettagliati delle migliori alternative a ThoughtSpot incluse nella mia selezione. Le mie recensioni offrono una panoramica approfondita delle funzionalità, delle integrazioni e dei migliori casi d’uso di ogni piattaforma di reportistica, per aiutarti a trovare quella più adatta a te.

Ideale per la libreria di visualizzazioni metriche predefinite
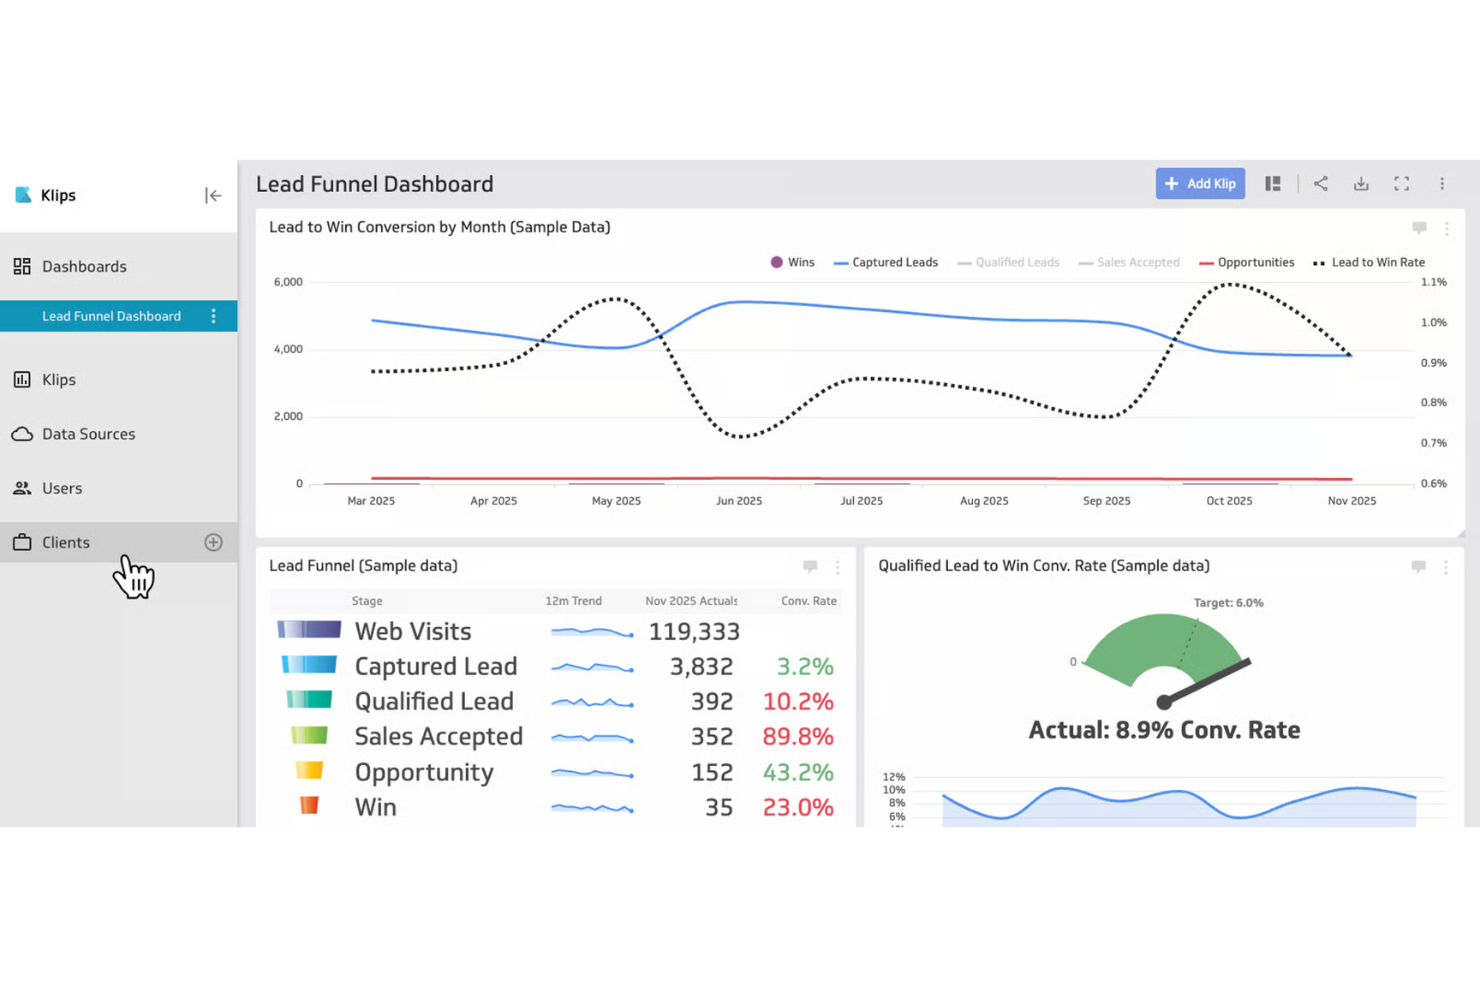
Klipfolio è una piattaforma di analisi basata su cloud per team che desiderano centralizzare le metriche e visualizzare dati provenienti da più fonti. È molto usata dai team di marketing, vendite e operations che hanno bisogno di accedere rapidamente a dashboard già pronte e insight condivisibili.
Per Chi è Ideale Klipfolio?
Team di marketing, vendite e operations di piccole e medie imprese che necessitano di visualizzazioni di dati predefinite e dashboard centralizzate, pronte all’uso e rapide da implementare.
Perché Klipfolio è una Buona Alternativa a ThoughtSpot
Ho scelto Klipfolio perché la sua libreria di Klip predefiniti offre ai team un punto di partenza concreto invece di una pagina bianca. Quando configuro una nuova dashboard di marketing o vendite, posso selezionare un Klip predefinito per metriche come spesa Google Ads o ricavi mensili e ottenere qualcosa di significativo online in pochi minuti.
Apprezzo anche il Klip Editor, che utilizza formule simili a quelle di Excel e consente agli analisti di trasformare e filtrare i dati senza dover scrivere SQL. In pratica, questo permette al mio team di creare e condividere dashboard avanzate in tempo reale tra dipartimenti, senza dipendere da pipeline di ingegneria dei dati.
Funzionalità Chiave di Klipfolio
- Condivisione delle dashboard: Pubblica dashboard come URL pubblici o incorporale in piattaforme esterne per la reportistica agli stakeholder.
- Connessioni alle fonti dati: Importa dati in tempo reale da fogli di calcolo, database e API in un unico spazio di lavoro.
- Aggiornamento programmato dei dati: Imposta intervalli di aggiornamento automatici dei dati per mantenere le dashboard sempre attuali senza aggiornamenti manuali.
- PowerMetrics: Definisci e monitora le metriche aziendali in modo centralizzato affinché ogni team faccia riferimento agli stessi numeri.
Integrazioni di Klipfolio
Klipfolio offre oltre 100 integrazioni native, inclusi Google Analytics, Salesforce, HubSpot, Shopify, Xero, QuickBooks, Google Sheets, Facebook Ads, database SQL, Mailchimp e Zapier. È disponibile un'API per integrazioni personalizzate.
Pros and Cons
Pros:
- Sincronizzazione dati in tempo reale con più fonti
- Creazione di metriche personalizzate tramite PowerMetrics
- Dashboard incorporabili per uso pubblico o privato
Cons:
- Nessun supporto avanzato per le query in linguaggio naturale
- Query ad hoc limitate per utenti non tecnici

Tableau
Ideale per la progettazione di dashboard interattive
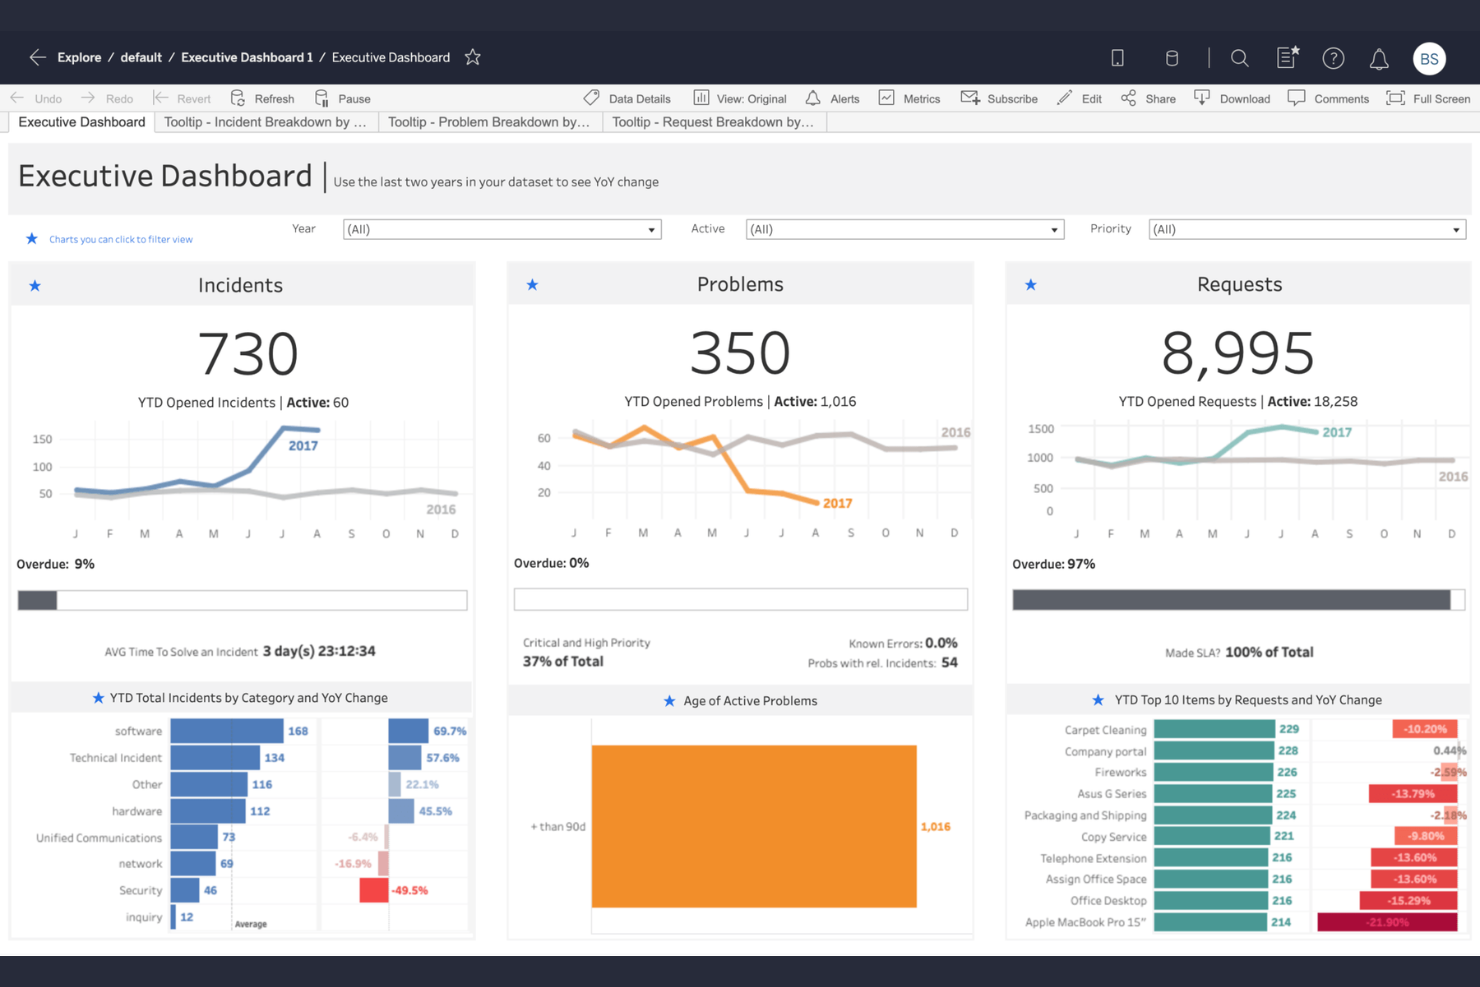
Tableau è una piattaforma di analisi per professionisti che desiderano trasformare dati complessi in dashboard visive e interattive. È particolarmente indicata per i team di finanza, operations e analytics che devono presentare approfondimenti sui dati in tempo reale agli stakeholder aziendali.
Per chi è ideale Tableau?
Analisti di dati e team di business intelligence in grandi organizzazioni che devono fornire dashboard personalizzate e interattive alla dirigenza e agli stakeholder.
Perché Tableau è una buona alternativa a ThoughtSpot
Ho scelto Tableau perché la sua area di lavoro drag-and-drop permette al mio team di passare dai dati grezzi a una dashboard completamente interattiva senza scrivere una sola riga di codice. Mi piace in particolare come le schede Marks offrano un controllo preciso su colore, dimensione, forma e dettaglio di qualsiasi visualizzazione—un livello di granularità che non ho riscontrato nella maggior parte delle alternative.
La funzionalità Actions delle dashboard di Tableau mi consente di collegare filtri, evidenziazioni e navigazione tra fogli tramite URL, così gli stakeholder possono esplorare autonomamente i dati. In pratica, significa che posso consegnare una dashboard finita e fidarmi che i dirigenti siano in grado di trovare da soli risposta alle domande successive.
Funzionalità principali di Tableau
- Campi calcolati: Crea metriche e formule personalizzate direttamente nella tua fonte dati senza modificare il dataset sottostante.
- Story points: Crea narrazioni guidate sui dati, slide dopo slide, che accompagnano gli stakeholder nei risultati principali in sequenza.
- Ask Data: Digita domande in linguaggio naturale sul tuo insieme di dati e ottieni automaticamente visualizzazioni generate in risposta.
- Pianificazione estrazione dati: Definisci orari di aggiornamento automatico per recuperare dati aggiornati dalle fonti collegate a intervalli definiti.
Integrazioni di Tableau
Tableau offre integrazioni native con Salesforce, Google Sheets, Microsoft Excel, Amazon Redshift, Snowflake, Oracle, Microsoft SQL Server, SAP, Google BigQuery e Databricks, con un'API disponibile per integrazioni personalizzate.
Pros and Cons
Pros:
- Ampio supporto ai connettori dati in tempo reale
- Ottimi controlli di governance
- Strumenti avanzati per la visualizzazione geospaziale
Cons:
- La combinazione dei dati può richiedere una preparazione dei dati
- È necessario il client desktop per alcune fasi di authoring

Databox
Ideale per dashboard esecutive automatizzate

Databox porta la reportistica automatizzata ai team che desiderano monitorare i KPI da più fonti in tempo reale. È una scelta ideale per i responsabili marketing e vendite che necessitano di dashboard unificate e snapshot personalizzati delle prestazioni senza bisogno di programmare.
Per chi è più indicato Databox?
Team marketing e vendite di aziende di medie dimensioni che vogliono un modo automatizzato per visualizzare e condividere i KPI aziendali tra diversi reparti.
Perché Databox è una valida alternativa a ThoughtSpot
Ho scelto Databox perché automatizza il lavoro di reportistica che di solito ricade su qualcuno che ogni settimana deve preparare manualmente i rapporti. Mi piace particolarmente la funzione Scorecards, che invia riepiloghi programmati dei KPI direttamente agli stakeholder tramite email o Slack, così i dirigenti hanno sempre una visione aggiornata senza dover accedere a una dashboard.
Il mio team utilizza anche la funzione Goals per impostare obiettivi sui dati live, facilitando l’evidenziazione dei progressi durante le revisioni senza dover estrarre dati da fonti diverse. In pratica, significa che posso dedicare meno tempo ad assemblare report e più tempo a discutere il vero significato dei numeri.
Funzionalità principali di Databox
- Builder dashboard senza codice: Trascina e rilascia metriche su dashboard completamente personalizzabili senza scrivere codice.
- Rilevamento anomalie: Databox segnala quando una metrica si discosta dal suo andamento tipico, consentendoti di intervenire prima che diventi un problema maggiore.
- Previsioni sulle performance: Visualizza scenari migliori e peggiori per qualsiasi metrica sulla base dei dati storici.
- Data Stories: Inserisci dinamicamente elementi come metriche live, periodi di tempo e variazioni percentuali direttamente nel testo dei report.
Integrazioni di Databox
Databox offre oltre 130 integrazioni native, inclusi Google Analytics, HubSpot, Salesforce, Google Ads, Mailchimp, Shopify, QuickBooks, Freshdesk e Stripe. Sono disponibili Zapier e un’API per ulteriori integrazioni.
Pros and Cons
Pros:
- Dashboard in tempo reale con sincronizzazione automatica dei dati
- App mobile per accedere alle dashboard ovunque
- Builder dashboard drag-and-drop senza codice
Cons:
- White-labeling richiede piani più costosi
- Nessuna modellazione di dati relazionali come ThoughtSpot
Domo
Ideale per la connessione a fonti dati di app cloud
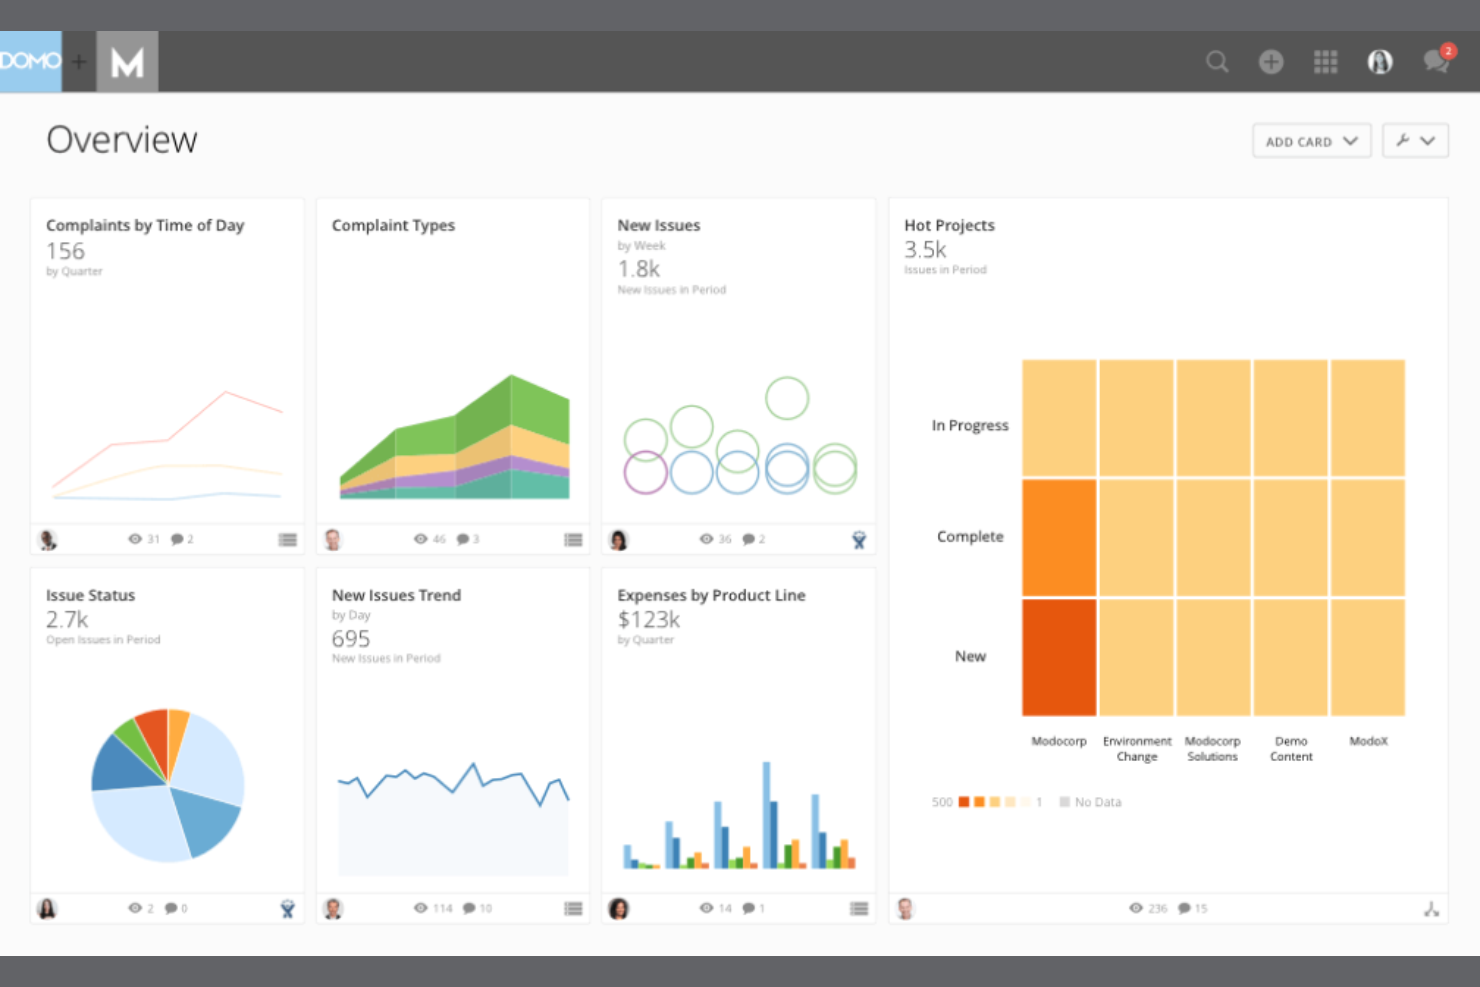
Domo è una piattaforma di analisi cloud-native progettata per i team che devono unificare e analizzare dati provenienti da centinaia di applicazioni SaaS e aziendali. La considero adatta ad aziende in rapida crescita che vogliono mettere gli utenti business in condizione di creare dashboard e automatizzare i flussi di lavoro dei report senza colli di bottiglia IT.
Per chi è ideale Domo?
Team di operation aziendali e IT in aziende enterprise o di fascia media che hanno bisogno di centralizzare e automatizzare l’analisi dei dati in cloud.
Perché Domo è una valida alternativa a ThoughtSpot
Ho scelto Domo per la sua libreria di connettori, che include oltre 1.000 connettori preconfigurati per applicazioni cloud come Salesforce, Slack, Google Analytics e Facebook Ads—raccogliendo dati live senza pipeline ETL personalizzate. Trovo particolarmente utile la funzione Beast Mode di Domo, che mi permette di creare campi calcolati direttamente sui dataset collegati senza modificare i dati alla fonte.
In pratica, questo significa che il mio team può aggiungere metriche personalizzate specifiche per le nostre esigenze di reporting e condividerle tra le dashboard in modo immediato. Domo è inoltre progettato in ottica mobile-first, così gli stakeholder possono accedere alle dashboard live da qualsiasi dispositivo senza perdere interattività.
Funzionalità principali di Domo
- Tracciamento della provenienza dei dati: Traccia come i dati fluiscono dalla fonte attraverso le trasformazioni fino all’output finale della dashboard.
- Consegna programmata dei report: Invia automaticamente screenshot delle dashboard agli stakeholder via email secondo una pianificazione definita.
- Creazione di dashboard basata su card: Assembla dashboard utilizzando singole card di visualizzazione che possono essere filtrate e personalizzate per utente.
- Domo Everywhere: Incorpora dashboard live di Domo ed esperienze dati direttamente su siti web esterni o prodotti rivolti ai clienti.
Integrazioni di Domo
Domo offre integrazioni native con Salesforce, Google Analytics, Amazon Redshift, Snowflake, QuickBooks, Box, Microsoft 365, Shopify, Adobe Analytics e Zendesk.
Pros and Cons
Pros:
- Ampia libreria di connettori per dati nel cloud
- Strumenti avanzati per la gestione dei permessi e della governance dei dati
- Funzionalità di collaborazione in-app per i team
Cons:
- Insight guidati dall’AI limitati
- Le ETL personalizzate possono comunque richiedere l’aiuto di sviluppatori

Sisense
Ideale per l’incorporamento personalizzato all’interno dei prodotti

Sisense è una piattaforma di analisi dei dati progettata per team di prodotto e ingegneria che hanno bisogno di incorporare le analisi direttamente nelle proprie app o flussi di lavoro. Se desideri controllare l'intera esperienza dati per i tuoi utenti, questa piattaforma ti offre strumenti end-to-end per una consegna completamente personalizzata delle analytics.
Per chi è Sisense?
Team di prodotto di medie e grandi dimensioni che costruiscono funzionalità di analytics in soluzioni SaaS B2B, IoT o piattaforme software verticali.
Perché Sisense è una buona alternativa a ThoughtSpot
Ho scelto Sisense specificamente per i team che hanno la necessità di incorporare l'analisi dati direttamente nei propri prodotti. Il Compose SDK è lo strumento di punta qui: è un kit di sviluppo per sviluppatori che consente di costruire e integrare analytics in modalità code-first e modulare usando React, Angular, Vue o TypeScript, senza dipendere da dashboard predefiniti.
Apprezzo anche il fatto che Sisense.JS offra al mio team un controllo granulare sui singoli widget e filtri, permettendoci di adattare perfettamente l'aspetto grafico alla nostra app. Temi white-label, accesso basato sui ruoli e architettura multi-tenant ci consentono di distribuire il prodotto ai clienti evitando la condivisione di dati tra diversi account.
Funzionalità principali di Sisense
- Query in linguaggio naturale: Fai domande in linguaggio naturale utilizzando l'assistente integrato e ottieni visualizzazioni senza scrivere una sola riga di codice.
- Strumento di modellazione dei dati: Unisci e modella dati da più fonti direttamente nella piattaforma, senza la necessità di un team di data engineering dedicato.
- Oltre 400 connettori dati: Collegati a oltre 400 fonti di dati, con opzioni per consolidare i dati all'interno di Sisense o mantenere una connessione live con il tuo data warehouse.
- Connettività server MCP: Collega strumenti AI esterni ai tuoi modelli dati governati in Sisense tramite il server MCP per analisi trasversali guidate dall’intelligenza artificiale.
Integrazioni Sisense
Sisense offre integrazioni native con Salesforce, Snowflake, Google BigQuery, Amazon Redshift, Azure Synapse, PostgreSQL, MongoDB, Oracle, SAP HANA, Microsoft SQL Server e REST API per integrazioni personalizzate.
Pros and Cons
Pros:
- Funzionalità white-label per analytics integrati
- Controllo granulare dei permessi a livello di dati
- Supporto nativo multi-tenant per l’isolamento degli utenti finali
Cons:
- Il prezzo richiede una negoziazione diretta con il reparto vendite
- Configurazione complessa per la modellazione iniziale dei dati

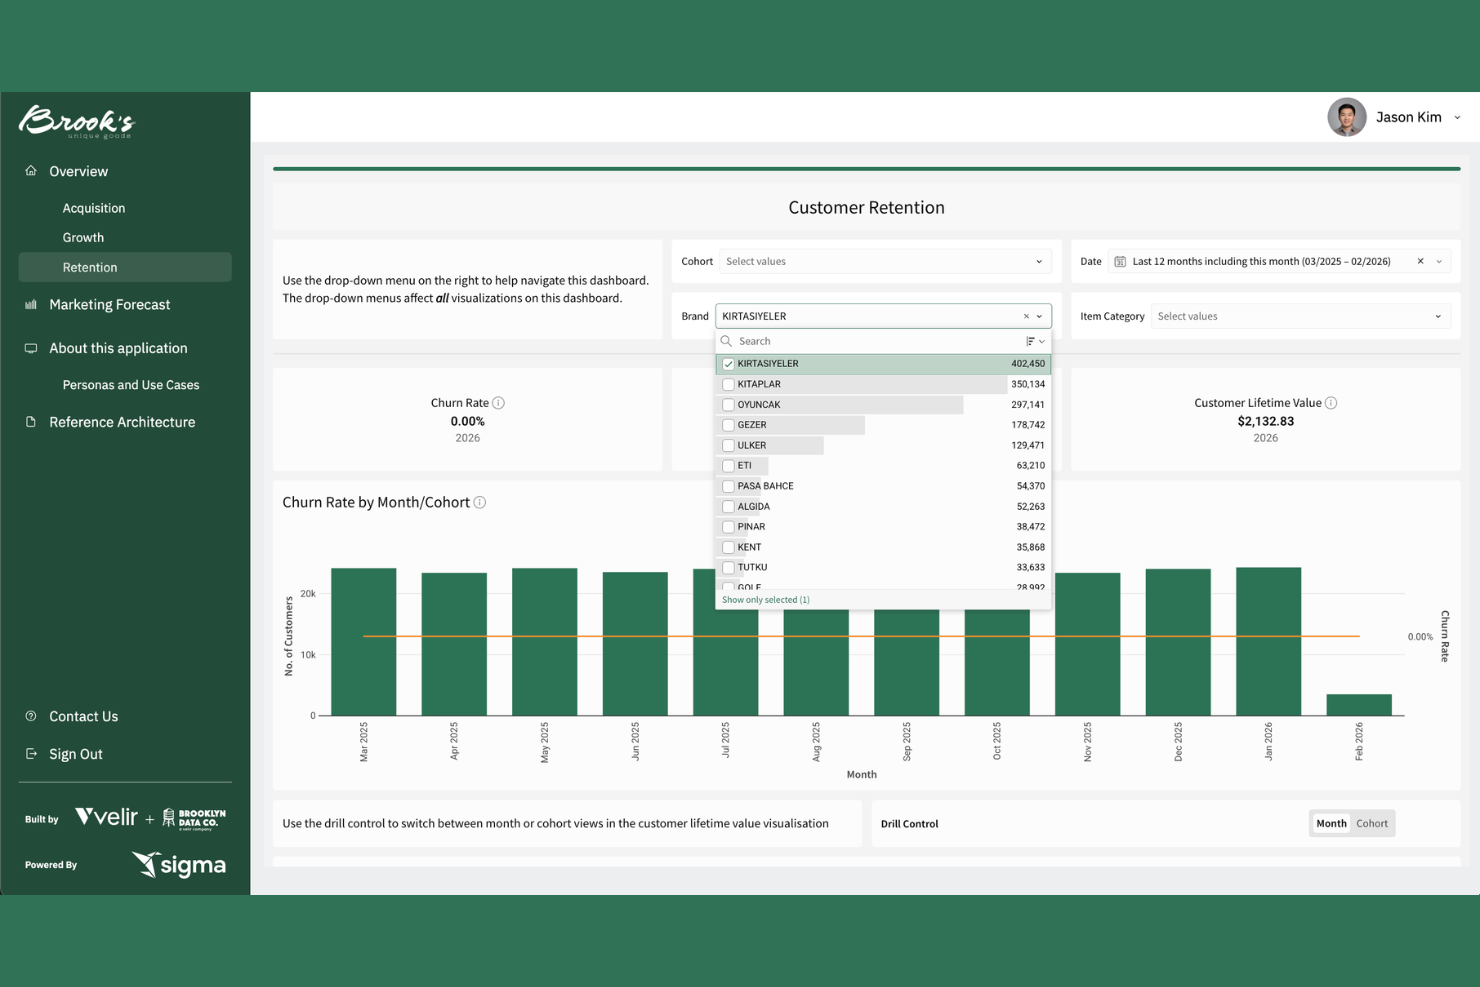
Sigma è una piattaforma di analytics cloud progettata per i team che preferiscono un'interfaccia in stile foglio di calcolo per un'esplorazione avanzata dei dati. È un'opzione interessante per analisti e utenti aziendali che vogliono accedere direttamente ai dati cloud governati senza dover dipendere dall'SQL.
Per chi è più indicata Sigma?
Analisti di dati e team aziendali in organizzazioni di medie e grandi dimensioni che cercano analisi in stile foglio di calcolo direttamente sui data warehouse cloud.
Perché Sigma è una valida alternativa a ThoughtSpot
Ho scelto Sigma perché consente agli analisti di lavorare direttamente sui dati live del data warehouse cloud utilizzando un'interfaccia familiare tipo foglio di calcolo, eliminando il collo di bottiglia dell'attesa che gli sviluppatori BI costruiscano le viste. Il mio team utilizza il modello workbook di Sigma per esplorare milioni di righe in tempo reale senza dover scrivere SQL, rendendo molto più veloce l'analisi ad hoc dei dati.
Apprezzo anche la funzione di analytics incorporata, che ci permette di pubblicare esperienze dati interattive direttamente negli strumenti interni e nei prodotti rivolti ai clienti. In pratica, questo significa che il mio team può offrire agli stakeholder accesso diretto ai dati live senza dover ricreare dashboard in un layer di reportistica separato.
Caratteristiche principali di Sigma
- Tabelle di input: Crea e scrivi dati direttamente nel tuo warehouse da un workbook di Sigma.
- Controllo delle versioni: Tieni traccia delle modifiche dei workbook e ripristina versioni precedenti senza uscire dalla piattaforma.
- Visualizzazioni personalizzate: Crea grafici e tabelle pivot sui dati live del warehouse tramite un'interfaccia drag-and-drop.
- Sicurezza a livello di riga: Controlla l'accesso ai dati a livello utente senza duplicare dataset o gestire insiemi di permessi separati.
Integrazioni Sigma
Sigma offre integrazioni native con Google Cloud, Snowflake, Databricks e Azure.
Pros and Cons
Pros:
- Interfaccia tipo foglio di calcolo per esplorazione diretta dei dati
- Controllo delle versioni dei workbook per audit
- Sicurezza e governance dei dati a livello di riga
Cons:
- Richiede una solida infrastruttura di data warehouse
- Nessun supporto a sorgenti dati on-premises

Power BI
Ideale per l'integrazione con gli strumenti Microsoft 365
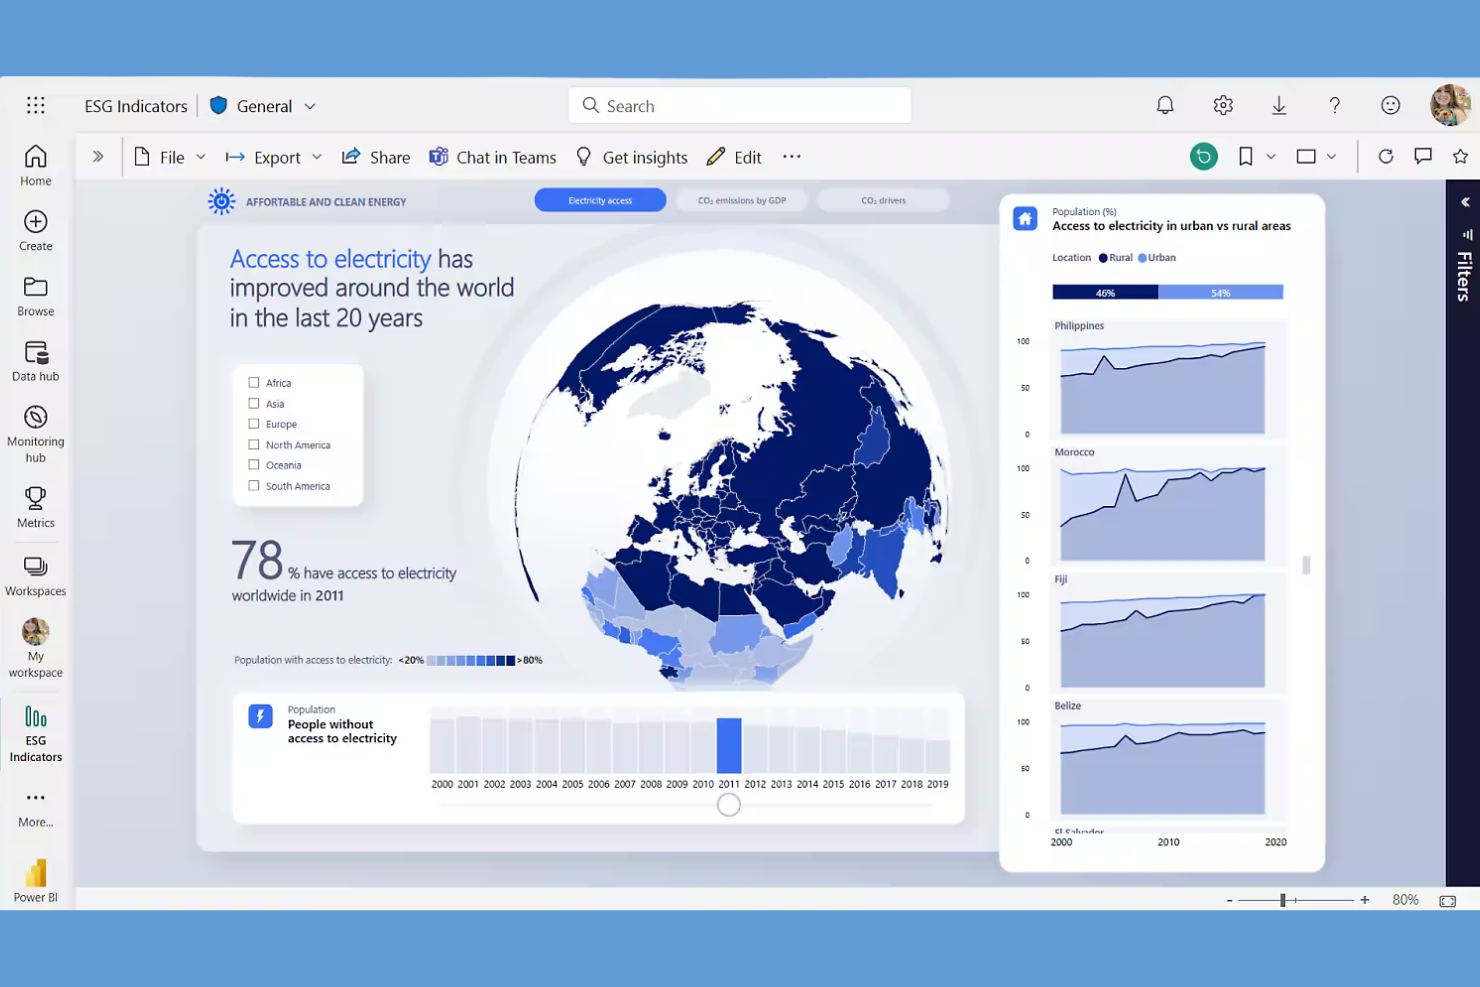
Power BI si distingue per i team che necessitano di dashboard in tempo reale e connessioni rapide ai dati presenti nell'organizzazione. Se lavori prevalentemente nell'ecosistema Microsoft, questa piattaforma ti aiuta a trasformare grandi quantità di dati aziendali in report azionabili senza una configurazione complessa.
Per Chi È Ideale Power BI?
Manager e analisti di aziende che utilizzano Microsoft 365 e desiderano visualizzazione e reportistica dei dati a livello aziendale.
Perché Power BI È Una Buona Alternativa a ThoughtSpot
Ho scelto Power BI per questa lista grazie all'integrazione naturale con l'ambiente Microsoft 365. Il mio team usa Power BI per estrarre dati in tempo reale direttamente da Excel, SharePoint e Teams, per poi costruire report senza mai uscire dall'ecosistema Microsoft. Mi piace in particolare la funzione DirectQuery, che permette di connettersi a fonti dati live così che le dashboard riflettano sempre i numeri aggiornati.
In pratica, ciò significa che il mio team può evitare le esportazioni manuali di dati che a volte sono necessarie con ThoughtSpot e passare direttamente alla creazione di report interattivi e condivisibili.
Funzionalità Principali di Power BI
- Q&A in linguaggio naturale: Fai domande sui tuoi dati in italiano e ottieni visualizzazioni immediate senza scrivere query.
- Dashboard personalizzate: Crea e organizza visualizzazioni interattive, KPI e grafici in un'unica schermata adattata alle tue necessità di reportistica.
- Sicurezza a livello di riga: Controlla quali utenti possono accedere a dati specifici all'interno di un report condiviso in base ai ruoli definiti.
- Report impaginati: Crea report pronti per la stampa e con struttura perfetta, progettati per output di dati strutturati e multi-pagina.
Integrazioni di Power BI
Power BI offre integrazioni native in tutto l'ecosistema Microsoft, inclusi Microsoft 365 e Azure. Puoi connetterlo a fonti di dati come Microsoft Access, SharePoint, SQL Server, Exchange Server e Microsoft Entra ID. È disponibile un'API per integrazioni personalizzate.
Pros and Cons
Pros:
- Integrazione profonda con gli strumenti Microsoft 365
- Connessione dati live con supporto DirectQuery
- Power BI Service consente la condivisione sul cloud
Cons:
- Prestazioni rallentate con grandi volumi di dati
- Personalizzazione limitata fuori dai prodotti Microsoft
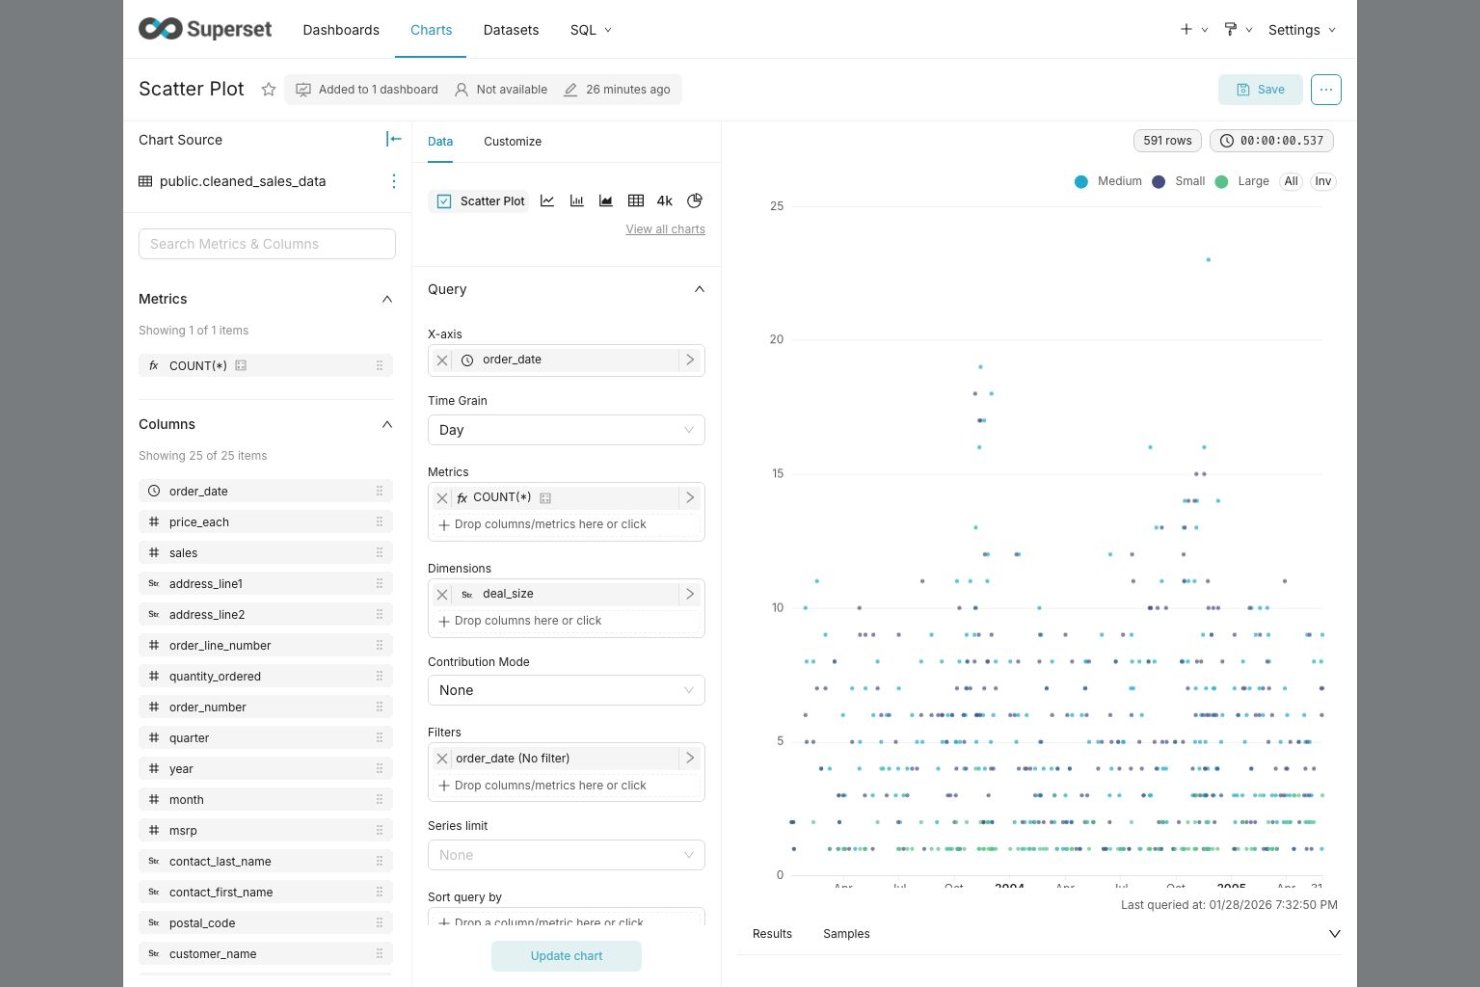
Apache Superset è una piattaforma BI open-source rivolta a team di dati e ingegneri che desiderano maggiore flessibilità nella progettazione e condivisione di dashboard. Se hai bisogno di totale controllo sulle visualizzazioni personalizzate e di una soluzione per la business intelligence senza costi, Superset è una scelta solida.
Per chi è più indicato Apache Superset?
Ingegneri dei dati e team di analisi in organizzazioni che cercano strumenti BI open-source con ampie opzioni di personalizzazione e possibilità di hosting autonomo.
Perché Apache Superset è una valida alternativa a ThoughtSpot
Ho scelto Apache Superset perché il modello open-source offre al mio team il pieno controllo su come costruire, distribuire ed estendere il nostro ambiente di analisi. Apprezzo il fatto che Superset supporti oltre 40 tipi di grafici e che posso creare visualizzazioni completamente personalizzate usando il framework dei plugin—cosa che la maggior parte degli strumenti BI ospitati semplicemente non consente.
Il mio team utilizza anche la funzionalità SQL Lab per scrivere ed eseguire query direttamente sui database collegati, mantenendo così l'analisi esplorativa vicina ai dati senza passare attraverso uno strato proprietario. Per i team che ospitano autonomamente sulle loro infrastrutture, questa flessibilità è difficilmente eguagliabile.
Funzionalità principali di Apache Superset
- Sicurezza a livello di riga: Limita l'accesso ai dati in base al ruolo dell'utente direttamente dalle dashboard.
- Connettività nativa ai database: Collega decine di database compatibili con SQL, tra cui PostgreSQL, MySQL, BigQuery e Snowflake.
- Controlli dei filtri delle dashboard: Aggiungi controlli interattivi di cross-filter che consentono agli utenti di segmentare i dati su più grafici contemporaneamente.
- Analitiche integrate: Incorpora le dashboard in applicazioni esterne usando il supporto nativo all'embedding di Superset.
Integrazioni di Apache Superset
Apache Superset offre integrazioni native con PostgreSQL, MySQL, Google BigQuery, Snowflake, Presto, Amazon Redshift, Apache Druid, Apache Hive e Microsoft SQL Server. È disponibile un'API per integrazioni personalizzate.
Pros and Cons
Pros:
- Controllo totale sui deployment self-hosted
- Ampie opzioni di interrogazione dati basate su SQL
- Comunità open-source attiva per il supporto
Cons:
- Richiede configurazione e manutenzione manuale
- Nessun hosting cloud gestito ufficiale disponibile


Qlik Cloud Analytics è una piattaforma di reportistica e analisi progettata per team e aziende che desiderano una scoperta dei dati più dinamica rispetto ai tradizionali dashboard. È particolarmente adatta ad analisti e decisori che necessitano risposte da grandi o complessi insiemi di dati senza colli di bottiglia.
Per chi è Qlik Cloud Analytics?
Data analyst e team di business intelligence in aziende di medie e grandi dimensioni che necessitano di un’esplorazione self-service avanzata attraverso molteplici fonti di dati.
Perché Qlik Cloud Analytics è una valida alternativa a ThoughtSpot
Ho scelto Qlik Cloud Analytics per il suo motore di analytics associativo, che lo distingue dalla maggior parte delle alternative a ThoughtSpot. A differenza degli strumenti basati su query, il motore di Qlik traccia le relazioni tra tutti i punti dati contemporaneamente—quindi quando clicco su un valore in un grafico, tutte le altre visualizzazioni si aggiornano per mostrare ciò che è associato e ciò che è escluso.
Questo livello di interattività fa emergere schemi che un approccio basato su ricerca o dashboard standard non rivelerebbe. Apprezzo anche le funzionalità di analytics predittivo integrate, che permettono al mio team di costruire e distribuire modelli di machine learning senza scrivere codice.
Funzionalità principali di Qlik Cloud Analytics
- Analytics aumentata: Il motore AI di Qlik fa emergere automaticamente insight e anomalie dai tuoi dati.
- Connettività dati multi-cloud: Collegati a data warehouse, database e fonti SaaS senza esportazioni manuali dei dati.
- Spazi di analisi collaborativa: Condividi e co-sviluppa app e report all’interno di spazi di lavoro di team organizzati.
- Preparazione dati senza codice: Trasforma, combina e pulisci le fonti di dati direttamente sulla piattaforma.
Integrazioni di Qlik Cloud Analytics
Qlik Cloud Analytics offre integrazioni native con Salesforce, Snowflake, Databricks, Google BigQuery, Amazon Redshift, Microsoft SQL Server, Oracle Database, SAP e si collega a fonti dati nell’ecosistema Microsoft, inclusi Microsoft 365 e Azure. È disponibile un’API per integrazioni personalizzate.
Pros and Cons
Pros:
- Supporta aggiornamenti dati in tempo reale dalle fonti
- Forti opzioni di implementazione multi-cloud e ibride
- Ampia connettività con fonti dati aziendali
Cons:
- Prezzo base elevato per team piccoli
- Le visualizzazioni personalizzate richiedono configurazioni avanzate

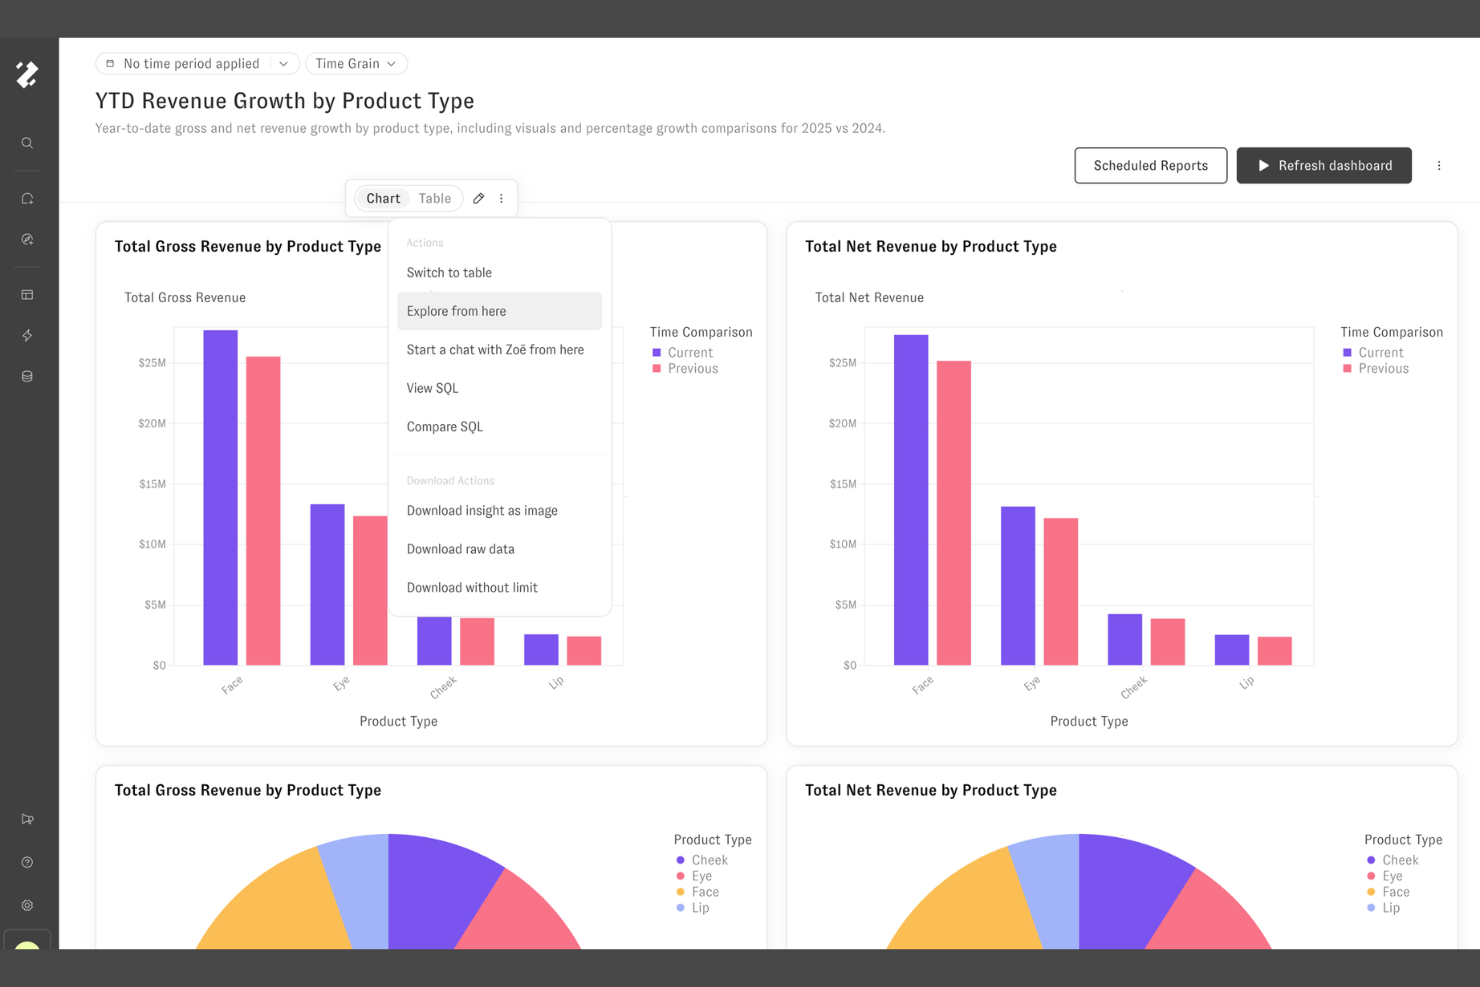
Zenlytic è una piattaforma di analisi potenziata dall'AI pensata per i team aziendali che desiderano porre domande in linguaggio naturale e ottenere risposte immediate dai dati. Se vuoi permettere agli utenti non tecnici di generare report in autonomia, Zenlytic rende accessibili gli insight sui dati in tempo reale a tutti.
A chi è più adatto Zenlytic?
Team di e-commerce o brand consumer che desiderano accedere direttamente alle risposte sui dati senza dipendere da analisti tecnici.
Perché Zenlytic è una valida alternativa a ThoughtSpot
Ho scelto Zenlytic proprio perché l'AI non è semplicemente integrata in uno strumento di BI tradizionale, bensì è il fondamento su cui si basa l'intera piattaforma. Zoë, l'analista AI di Zenlytic, comprende il contesto aziendale tramite uno strato semantico che impara le definizioni dei tuoi KPI man mano che il team pone domande. Ciò significa che, se faccio una domanda di approfondimento come 'perché c'è stato un calo martedì scorso?', Zoë mantiene il contesto dalla query precedente e non parte da zero. Inoltre, apprezzo il Clarity Engine, che collega ogni query a uno strato semantico governato per eliminare le allucinazioni—un problema che molti strumenti di analisi AI devono ancora risolvere. Per i team in cui la fiducia nei dati è imprescindibile, è un elemento di grande rilievo.
Funzionalità principali di Zenlytic
- Cruscotti dinamici: Suddividi, ruota e analizza i dati in tempo reale direttamente da qualsiasi dashboard.
- Permessi di accesso a livello di riga e colonna: Controlla esattamente quali utenti possono visualizzare determinati campi o record di dati.
- Integrazione con dbt: Collega Zenlytic direttamente al tuo progetto dbt esistente per mantenere sincronizzate le definizioni dei KPI.
- Invio programmato di dashboard: Imposta l'invio automatico dei dashboard agli stakeholder, secondo una pianificazione ricorrente.
Integrazioni di Zenlytic
Zenlytic offre integrazioni native con Snowflake, Google BigQuery, Amazon Redshift e Google Sheets. È disponibile una API per integrazioni personalizzate.
Pros and Cons
Pros:
- Le risposte AI seguono le domande successive mantenendo il contesto
- Lo strato semantico mantiene le definizioni di KPI aziendali
- Trasparenza delle query con tracciabilità completa SQL
Cons:
- La configurazione avanzata spesso richiede conoscenze SQL
- Personalizzazione limitata dei dashboard in modalità self-service
Altre alternative a ThoughtSpot
Ecco alcune ulteriori alternative a ThoughtSpot che non sono state incluse nella mia selezione, ma che vale comunque la pena prendere in considerazione:
- Embeddable
Ideale per analytics low-code per piattaforme SaaS
- BlazeSQL
Ideale per query SQL dirette e report veloci
- Grow
La migliore personalizzazione della dashboard senza codice


Come valuto le alternative a ThoughtSpot
Valuto ogni alternativa a ThoughtSpot attraverso due prospettive: i requisiti di base — interrogazioni in linguaggio naturale (NLQ), pannelli di controllo autonomi e connettori dati per PM — e gli elementi distintivi che rendono una piattaforma la scelta più adatta al tuo team.
Funzionalità principali (requisiti di base per questo elenco)
Quando seleziono gli strumenti per il mio elenco, assegno a ciascuno un punteggio su una scala da 0 (non offre la funzionalità) a 5 (eccelle in quest'area) per ogni funzionalità principale elencata di seguito. Quindi, calcolo il punteggio totale dello strumento e lo converto in una percentuale. Ogni strumento deve raggiungere un punteggio totale minimo del 65% per essere preso in considerazione.
- Analisi autonoma: verifico se un PM o un responsabile PMO può creare i propri report — ad esempio, un andamento della velocità dello sprint o un'analisi degli scostamenti dal budget — senza aprire una richiesta al team dati.
- Interrogazioni in linguaggio naturale: valuto quanto bene ogni strumento gestisca domande formulate in linguaggio naturale come "quali progetti sono fuori budget in questo trimestre" e se le risposte siano accurate e contestualizzate.
- Pannelli di controllo interattivi: ogni piattaforma dovrebbe consentire di creare pannelli di controllo visivi e filtrabili con analisi di dettaglio — ad esempio, facendo clic su un riquadro di stato a livello di programma per visualizzare lo stato dei singoli progetti sottostanti.
- Connettività delle origini dati: cerco connettori nativi per strumenti di PM come Jira, Asana e Monday, oltre alla compatibilità con magazzini di dati come Snowflake o BigQuery, dove i team consolidano i dati operativi.
- Approfondimenti e avvisi automatizzati: lo strumento dovrebbe rilevare in modo proattivo anomalie o superamenti delle soglie, ad esempio segnalando un progetto il cui tasso di consumo del budget è appena aumentato significativamente rispetto alla sua media storica.
- Report incorporabili e condivisibili: valuto se sia possibile pianificare riepiloghi esecutivi del portafoglio, condividere pannelli di controllo aggiornati in tempo reale con le parti interessate tramite un link o incorporare report in strumenti come Confluence o SharePoint.
Una volta ottenuto un elenco di strumenti che soddisfano questi criteri, valuto ciò che distingue ogni piattaforma.
Fattori distintivi (ciò che differenzia i fornitori)
Ecco come confronto i diversi fornitori:
Caratteristiche distintive
L'analisi predittiva è un importante elemento distintivo. Cerco strumenti in grado di prevedere i ritardi dei progetti o gli sforamenti del budget sulla base dei dati storici del portafoglio, non solo di elaborare report su ciò che è già accaduto. È importante anche disporre di un livello semantico governato, perché mantiene coerenti KPI come "tasso di consegna puntuale" in ogni pannello di controllo prodotto dal PMO. Vale la pena valutare anche le funzionalità di aggiornamento diretto dei dati, poiché aggiornare lo stato di un progetto o riassegnare un'attività direttamente da un pannello di controllo evita al team di dover cambiare continuamente contesto.
Oltre le funzionalità
Valuto la rapidità con cui una piattaforma porta il tuo PMO dalla configurazione al primo risultato utile. Gli strumenti con modelli predefiniti di pannelli di controllo per la gestione dei progetti possono ridurre di settimane i tempi di implementazione rispetto alla creazione da zero. Le integrazioni con l'ecosistema PM sono altrettanto importanti: verifico la presenza di connettori nativi e bidirezionali per strumenti come Jira, Asana e Smartsheet, oltre che per i sistemi finanziari in cui risiedono i dati di budget. Il costo totale di proprietà completa la mia valutazione, in particolare per capire se la piattaforma richieda sviluppatori BI dedicati o se il team PM esistente possa gestirla in autonomia.
Perché cercare un'alternativa a ThoughtSpot?
Sebbene ThoughtSpot sia una buona scelta tra gli strumenti di reportistica, esistono diversi motivi per cui alcuni utenti cercano soluzioni alternative. Se vuoi migliorare la tua esperienza complessiva di analisi e consentire al tuo team di prendere decisioni basate sui dati per l'elaborazione di dati complessi, potresti cercare un'alternativa a ThoughtSpot perché…
- Hai bisogno di opzioni di distribuzione a codice aperto o ospitate autonomamente
- Il tuo team dipende fortemente da query SQL personalizzate o dal codice
- I costi delle licenze superano il tuo budget attuale
- La tua azienda richiede funzionalità avanzate di integrazione dei dati
- Desideri una maggiore varietà di opzioni di visualizzazione
- Operi in regioni con disponibilità limitata del supporto
Se ti riconosci in una di queste situazioni, sei nel posto giusto per aiutare la tua organizzazione a prendere decisioni informate. Il mio elenco contiene diverse opzioni di strumenti di reportistica più adatte ai team che affrontano queste difficoltà con ThoughtSpot e cercano soluzioni alternative.
Funzionalità principali di ThoughtSpot
Ecco alcune delle principali funzionalità di ThoughtSpot per aiutarti a mettere a confronto ciò che offrono le soluzioni alternative:
- Analisi basata sulle ricerche: ThoughtSpot consente agli utenti di digitare query in linguaggio naturale per generare istantaneamente analisi e report, rendendo l'esplorazione autonoma dei dati accessibile anche agli utenti non tecnici.
- Approfondimenti basati sull'IA: La piattaforma mette in evidenza tendenze, anomalie e approfondimenti automatizzati utilizzando algoritmi integrati di IA e apprendimento automatico, aiutando gli utenti a individuare proattivamente i modelli rilevanti nei propri dati. Per le organizzazioni che necessitano di una modellazione statistica approfondita, queste analisi avanzate sono fondamentali.
- Analisi in tempo reale sui dati nel cloud: ThoughtSpot si connette direttamente ai principali data warehouse nel cloud, come Snowflake, Google BigQuery e Amazon Redshift, consentendo agli utenti di eseguire query su dati aggiornati senza dover gestire estrazioni di dati. Piattaforme alternative come Qlik Sense offrono inoltre potenti motori associativi per gestire l'ottimizzazione delle query sui dati in tempo reale.
- Pannelli di controllo interattivi: Gli utenti possono creare pannelli di controllo interattivi in tempo reale che si aggiornano automaticamente al variare dei dati, con la possibilità di personalizzare le disposizioni, analizzare in dettaglio le metriche e condividere le visualizzazioni tra le squadre.
- Condivisione collaborativa: ThoughtSpot consente agli utenti di condividere in modo sicuro analisi in tempo reale, istantanee dei pannelli di controllo e risultati delle query con i colleghi, favorendo il lavoro di squadra e allineando il processo decisionale su un'unica fonte di verità.
- Analisi integrate: Le API della piattaforma consentono alle aziende di integrare le analisi e le visualizzazioni di ThoughtSpot all'interno di app web, prodotti o portali, estendendo le funzionalità di analisi a clienti e partner.
- Controlli di sicurezza avanzati: La gestione granulare degli accessi basata sui ruoli garantisce la protezione dei dati sensibili e ne limita l'accesso agli utenti autorizzati, supportando le esigenze di governance su scala aziendale.
- Accesso mobile: ThoughtSpot offre applicazioni mobili ottimizzate per iOS e Android, consentendo agli utenti di visualizzare pannelli di controllo, eseguire ricerche e ricevere avvisi ovunque si trovino.
- Connettori dati personalizzati: I connettori per diversi database, servizi SaaS e piattaforme aziendali consentono di integrare ThoughtSpot con un'ampia varietà di fonti dati per un'analisi unificata. Molte squadre cercano una piattaforma tutto-in-uno che garantisca l'integrazione con i sistemi CRM esistenti e l'infrastruttura cloud, come le pipeline di dati AWS.
- Reportistica programmata: Gli utenti possono automatizzare la distribuzione di report e istantanee dei pannelli di controllo a intervalli prestabiliti, assicurando che le parti interessate ricevano sempre le informazioni più recenti nella propria casella di posta o attraverso i canali preferiti.