13 migliori alternative a Looker Studio recensite nel 2026

Migliori alternative a Looker Studio - Sintesi


Se gestisci progetti, conosci bene la pressione di dover prendere decisioni basate sui dati. In situazioni difficili, Looker Studio potrebbe non essere sempre la soluzione ideale, soprattutto se hai esigenze specifiche di settore o necessiti di un’integrazione migliore con gli strumenti già in uso.
Per mia esperienza, il giusto strumento di Business Intelligence Software-as-a-Service (SaaS BI) può semplificare notevolmente il lavoro grazie a soluzioni su misura. Si tratta di trovare ciò che funziona meglio per te e il tuo team.
In questo articolo condividerò le mie principali scelte di alternative a Looker Studio. Ho testato e recensito ciascuna soluzione per aiutarti a trovare lo strumento che meglio si adatta alle tue esigenze. Troverai approfondimenti su funzionalità, usabilità e vantaggi distintivi, così la tua decisione sarà più semplice.
Cos'è Looker Studio?
Looker Studio è uno strumento di business intelligence che aiuta le organizzazioni a trasformare i dati in informazioni utili e azionabili. È generalmente utilizzato da analisti di dati, manager aziendali e professionisti IT che devono analizzare grandi insiemi di dati e prendere decisioni consapevoli. Tu e il tuo team potete beneficiare delle sue funzioni di visualizzazione dati, dashboard collaborativi e analisi in tempo reale, elementi che facilitano decisioni basate sui dati e migliorano la collaborazione. Nel complesso, Looker Studio offre una piattaforma BI efficace per trasformare dati complessi e potenti in indicazioni chiare e pratiche.
Sintesi delle migliori alternative a Looker Studio
Questa tabella di confronto riassume i dettagli sui prezzi delle principali alternative a Looker Studio per aiutarti a trovare la soluzione più adatta al tuo budget e alle esigenze della tua azienda.
| Tool | Best For | Trial Info | Price | ||
|---|---|---|---|---|---|
| 1 | Ideale per controlli di governance dei dati flessibili | Piano gratuito disponibile | Da $29/mese | Website | |
| 2 | Ideale per lo storytelling visivo | Piano gratuito disponibile | A partire da $15/utente/mese (fatturato annualmente) | Website | |
| 3 | Ideale per l’integrazione dei dati potenziata dall’IA | Prova gratuita di 30 giorni + demo gratuita disponibile | Da $300/mese (fatturato annualmente) | Website | |
| 4 | Ideale per la pianificazione aziendale | Demo gratuita disponibile | Prezzo su richiesta | Website | |
| 5 | Ideale per l'integrazione con Microsoft | Piano gratuito disponibile | Da £10.80/utente/mese (fatturazione annuale) | Website | |
| 6 | Ideale per la flessibilità open-source | Piano gratuito disponibile | Da $100/mese (fatturato mensilmente) + $6/utente/mese | Website | |
| 7 | Ideale per analytics integrato | Piano gratuito disponibile | Prezzo su richiesta | Website | |
| 8 | Ideale per insight guidati dall’IA | Prova gratuita di 14 giorni + demo gratuita disponibile | A partire da $25/utente/mese (fatturazione annuale) | Website | |
| 9 | Ideale per dashboard interattivi abilitati all'AI | Prova gratuita di 30 giorni + demo gratuita disponibile | Prezzo su richiesta | Website | |
| 10 | Ideale per soluzioni no-code | Prova gratuita disponibile | Prezzo su richiesta | Website |
Perché puoi fidarti di noi
Testiamo e recensiamo software di project management dal 2012. Come project manager, sappiamo quanto sia fondamentale (e difficile) fare la scelta giusta quando si seleziona un software. Investiamo molte risorse nella ricerca per aiutare la nostra audience a scegliere meglio. Abbiamo testato più di 2.000 strumenti per diversi casi d’uso e scritto oltre 1.000 recensioni dettagliate. Scopri come restiamo trasparenti & la nostra metodologia di recensione del software.
-

Celoxis
Visit WebsiteThis is an aggregated rating for this tool including ratings from Crozdesk users and ratings from other sites.4.4 -
Accelo
Visit WebsiteThis is an aggregated rating for this tool including ratings from Crozdesk users and ratings from other sites.4.4 -
Wrike
Visit WebsiteThis is an aggregated rating for this tool including ratings from Crozdesk users and ratings from other sites.4.3


Recensioni delle migliori alternative a Looker Studio
Qui sotto trovi i miei riassunti dettagliati delle migliori alternative a Looker Studio che ho selezionato. Nelle recensioni troverai le principali caratteristiche, pro e contro, integrazioni native e casi d’uso ideali di ciascun tool, per aiutarti a trovare la soluzione migliore per te.
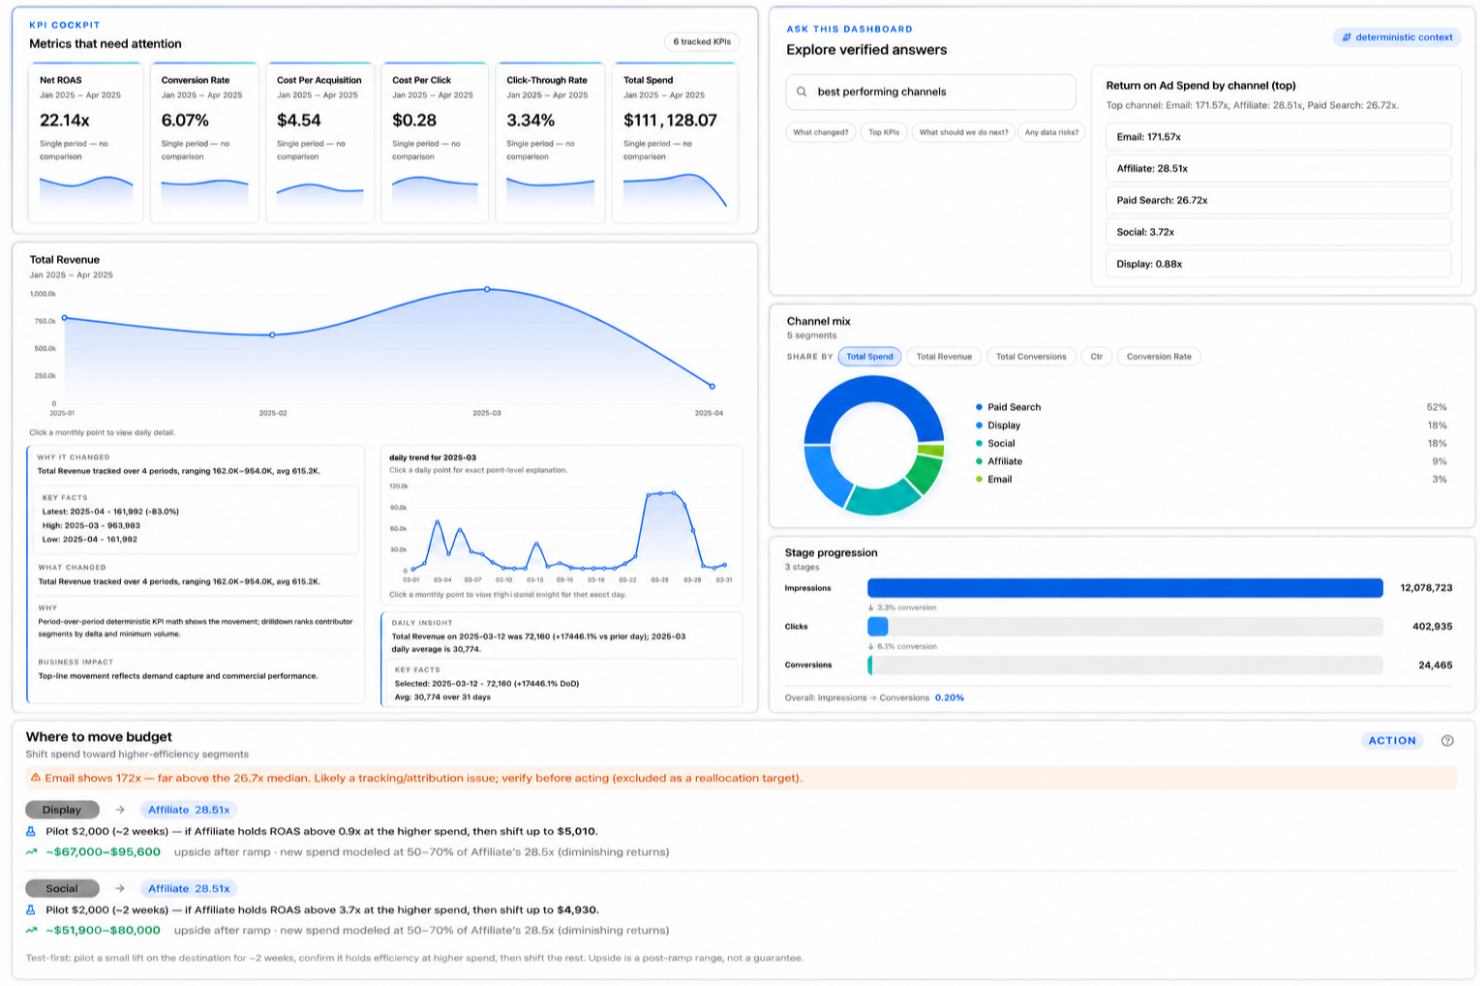
Signara è una piattaforma di analisi automatizzata alimentata dall'IA per team di marketing che genera dashboard, report sui KPI, analisi guidate dall'IA, approfondimenti e raccomandazioni utilizzando un motore di calcolo deterministico collegato a fonti come HubSpot, BigQuery, Snowflake e Google Sheets.
Per chi è ideale Signara?
Signara è adatta a team di marketing e agenzie che necessitano di report automatizzati da più fonti di dati senza dover creare report manualmente.
Perché ho scelto Signara
Ho incluso Signara nella mia selezione per l'attenzione che dedica alla governance dei dati senza richiedere configurazioni complesse. I dati aziendali grezzi non vengono mai archiviati lato server. Sono elaborati in memoria solo per generare il report e poi eliminati, il che significa che non restano esposti dopo la fine della sessione. Mi piace anche che i dati dell'account siano isolati a livello di infrastruttura, così non è possibile alcun accesso tra tenant. Per i team che necessitano di tracciabilità, ogni KPI è collegato a una formula deterministica e bloccata, mai a una stima dell'IA.
Caratteristiche principali di Signara
- Query sui dati in sola lettura: Signara si collega alle fonti dati con accesso in sola lettura, così lo strumento non può mai modificare o sovrascrivere i dataset di origine.
- Approfondimenti e raccomandazioni generate dall'IA: Signara individua variazioni nei KPI, evidenzia tendenze e suggerisce azioni in base ai dati collegati.
- Analisi 'chiedi alla dashboard': Gli utenti possono porre domande sui dati della dashboard in linguaggio naturale e ricevere risposte senza dover creare report personalizzati.
- Mapping dello schema e rilevamento dei campi: Quando colleghi una fonte dati, Signara mappa automaticamente lo schema e identifica i campi rilevanti, eliminando la necessità di configurazioni manuali.
Integrazioni di Signara
Le integrazioni includono HubSpot, Excel, Google Sheets, Snowflake, BigQuery, PostgreSQL, Databricks e MySQL.
Pros and Cons
Pros:
- Le narrazioni IA spiegano in automatico il cambiamento dei KPI
- L’analisi dei driver individua variazioni sulle metriche
- Report automatizzati senza configurazione dell'analista
Cons:
- Connettori nativi limitati alle fonti dati principali
- Nessuna personalizzazione di grafici o visualizzazioni

Tableau è uno strumento di visualizzazione dei dati progettato per la business intelligence e l’analisi dei dati. Gli analisti e i professionisti aziendali lo utilizzano principalmente per creare dashboard interattive e condivisibili.
Perché Tableau è una valida alternativa a Looker Studio: Tableau eccelle nello storytelling visivo, rendendolo ideale per chi deve presentare i dati in modo coinvolgente. Puoi anche esplorare dinamicamente i dati e scoprire rapidamente nuove informazioni. L’attenzione di Tableau per il design intuitivo ti aiuta a comunicare efficacemente la storia dei tuoi dati.
Funzionalità principali e integrazioni:
Le funzionalità includono un’interfaccia drag-and-drop che semplifica il processo di creazione delle visualizzazioni. Inoltre, gli strumenti di analisi in tempo reale di Tableau consentono al tuo team di ricavare approfondimenti non appena i dati sono disponibili. Hai anche dashboard interattive che permettono agli utenti di esplorare i dati e ottenere informazioni in tempo reale.
Le integrazioni comprendono Salesforce, Google Analytics, Microsoft Excel, Amazon Redshift, Google BigQuery, Microsoft SQL Server, Oracle, SAP HANA, Dropbox, Box e molti altri.
Pros and Cons
Pros:
- Funzionalità avanzate di visualizzazione
- Interfaccia drag-and-drop intuitiva
- Capacità di storytelling coinvolgente
Cons:
- Modellazione dei dati debole
- Processo di preparazione dei dati complesso

Qlik è una piattaforma di analisi dei dati progettata per creare visualizzazioni e dashboard interattive. Gli utenti aziendali e i team di dati la utilizzano per esplorare e analizzare i dati.
Perché Qlik è una valida alternativa a Looker Studio: Qlik offre forti capacità di integrazione dei dati, rendendolo ideale per i team che necessitano di collegare più fonti di dati. È anche possibile costruire dashboard personalizzati che aiutano a scoprire informazioni utili. Le funzionalità analitiche basate sull’intelligenza artificiale della piattaforma supportano sia l’analisi guidata che quella self-service.
Caratteristiche principali e integrazioni:
Le funzionalità includono un motore dati associativo che aiuta a vedere le connessioni tra i dati. Inoltre, le sue analisi self-service permettono al tuo team di prendere decisioni basate sui dati senza dover dipendere dall’IT. La piattaforma supporta sia il deployment in cloud che on-premises, offrendo flessibilità alle esigenze aziendali.
Le integrazioni comprendono Microsoft Office e altro ancora.
Pros and Cons
Pros:
- Supporta analisi self-service
- Opzioni di deployment flessibili
- Dashboard personalizzabili
Cons:
- Linguaggio di scripting specifico per la preparazione dei dati
- Estensioni fragili

SAP Analytics Cloud (SAC) è una soluzione cloud di nuova generazione che unifica business intelligence, analytics aumentati e pianificazione collaborativa in un'unica interfaccia. A differenza degli strumenti tradizionali che mostrano solo il passato, SAC è progettato per aiutare i team di leadership a modellare il futuro attraverso scenari integrati 'what-if' e previsioni finanziarie.
Perché SAP Analytics Cloud è una buona alternativa a Looker Studio: SAC va oltre i semplici dashboard, permettendo agli utenti di agire sui dati—consentendo ai team di svolgere attività di budgeting, forecasting e modellazione predittiva direttamente all'interno dei propri report. È lo standard d'eccellenza per le organizzazioni che necessitano di una 'single source of truth' su tutti i loro dati SAP e non-SAP.
Funzionalità e integrazioni distintive:
Le funzionalità includono Integrated Planning & Analysis (xP&A), che consente di combinare pianificazione finanziaria, operativa e HR per creare budget aziendali unificati. Le sue capacità di Augmented Analytics utilizzano 'Smart Discovery' e 'Smart Predict' per identificare automaticamente i principali driver di business e prevedere le tendenze future tramite machine learning. Inoltre, la Live Data Connection consente di collegarsi direttamente a SAP S/4HANA, BW/4HANA e Datasphere senza spostare i dati, garantendo sicurezza e conformità in tempo reale.
Le integrazioni includono S/4HANA, SuccessFactors, Ariba, Google BigQuery, Salesforce, Snowflake, Microsoft Outlook, OData e altri ancora.
Pros and Cons
Pros:
- Strumenti AI integrati che non richiedono formazione
- Sicurezza tramite connessione live
- Integra completamente BI e pianificazione finanziaria
Cons:
- Rallentamenti delle prestazioni
- Vincolo all'ecosistema SAP
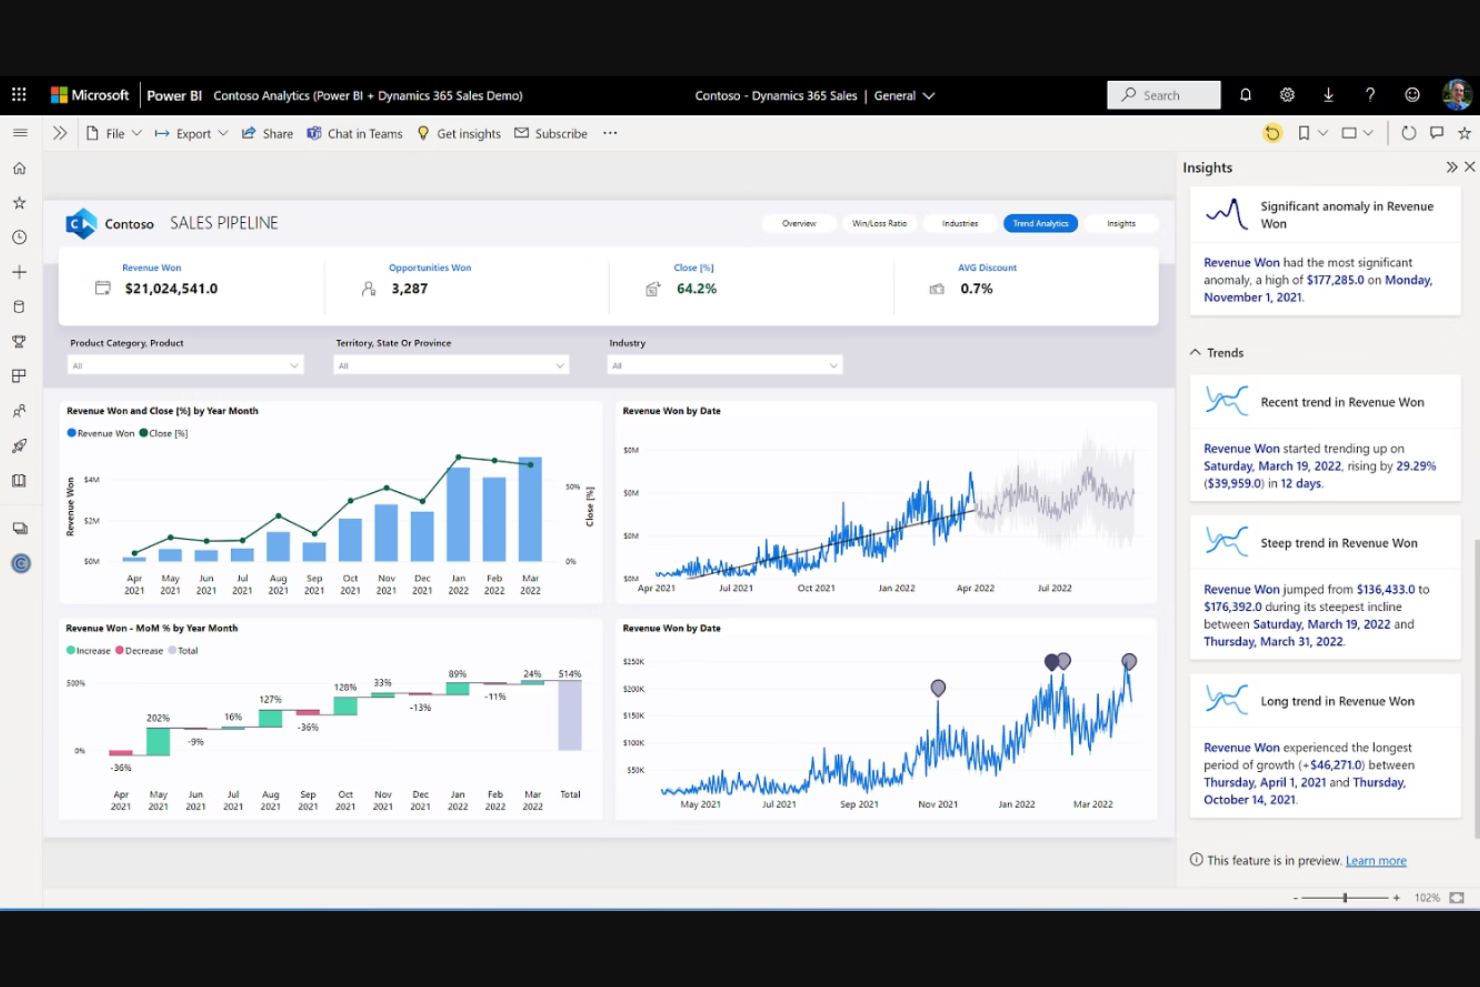
Microsoft Power BI è un servizio di analisi aziendale che offre visualizzazioni interattive e funzionalità di business intelligence. Viene utilizzato principalmente da analisti aziendali e professionisti IT per creare dashboard, grafici e report.
Perché Microsoft Power BI è una valida alternativa a Looker Studio: L'integrazione di Microsoft Power BI con i prodotti Microsoft lo rende ideale per i team che già utilizzano servizi Microsoft. Puoi collegarlo facilmente a varie fonti di dati, inclusi i fogli di calcolo, e condividere informazioni all'interno della tua organizzazione. Questo lo rende una scelta adatta sia per grandi che per piccole aziende che cercano una soluzione dati familiare e integrata.
Funzionalità e integrazioni principali:
Le funzionalità includono strumenti di visualizzazione dei dati che aiutano a creare report dettagliati. Inoltre, le analisi in tempo reale permettono al tuo team di accedere a dati aggiornati. L'interfaccia intuitiva facilita anche l'adozione e l'utilizzo da parte dei membri del team.
Le integrazioni includono Microsoft Dynamics 365, SharePoint, Google Analytics, GitHub e altre ancora.
Pros and Cons
Pros:
- Integrazione semplice con l'ecosistema Microsoft
- Analisi dei dati in tempo reale
- Ampia connettività alle fonti dati
Cons:
- Dipendenza da Windows
- Interattività delle tabelle rigida
Metabase è uno strumento di business intelligence open-source progettato per un'analisi dei dati e una visualizzazione semplici. Analisti dei dati, startup e aziende utilizzano Metabase per creare report e dashboard senza la necessità di una programmazione complessa.
Perché Metabase è una valida alternativa a Looker Studio: Metabase offre la flessibilità dell'open-source, ideale per i team che cercano soluzioni personalizzabili. La sua interfaccia intuitiva consente di creare query e visualizzazioni, e puoi configurare dashboard per condividere approfondimenti in tutta l'organizzazione. La piattaforma supporta analisi self-service, permettendo al tuo team di esplorare i dati in modo indipendente.
Caratteristiche Distintive e Integrazioni:
Le caratteristiche includono layout personalizzati delle dashboard che ti permettono di adattare la presentazione dei dati alle tue esigenze. Inoltre, il costruttore di query ti aiuta a porre domande sui dati senza conoscere SQL. Metabase può anche programmare e condividere report tramite email o Slack per aiutare il tuo team a rimanere aggiornato sulle ultime informazioni.
Le integrazioni includono MySQL, DuckDB, Databricks, Google BigQuery e molto altro.
Pros and Cons
Pros:
- Flessibilità open-source
- Interfaccia intuitiva
- Supporta l'analisi self-service
Cons:
- Governance enterprise debole
- Nessun ESL integrato

Sisense è un software di business intelligence specializzato in analisi e visualizzazione dei dati. Viene utilizzato da analisti di dati e sviluppatori per creare dashboard e report interattivi.
Perché Sisense è una valida alternativa a Looker Studio: Sisense offre solide funzionalità di analytics integrato, permettendo di incorporare l’analisi dati nelle tue applicazioni. La piattaforma supporta una modellazione dati complessa e offre flessibilità nell’implementazione. Queste caratteristiche la rendono adatta alle aziende che desiderano potenziare le loro applicazioni con analytics.
Funzionalità distintive e integrazioni:
Le funzionalità includono la tecnologia In-Chip che accelera l’elaborazione dei dati. Inoltre, gli avanzati strumenti di modellazione dati consentono al tuo team di gestire in modo efficiente set di dati complessi. La piattaforma supporta anche formati di implementazione in cloud, on-premises e ibridi.
Le integrazioni includono Google Maps, Microsoft Excel e altri.
Pros and Cons
Pros:
- Analytics integrato avanzato
- Elaborazione dati rapida
- Opzioni di implementazione flessibili
Cons:
- Non è uno strumento 'plug-and-play'
- Documentazione carente
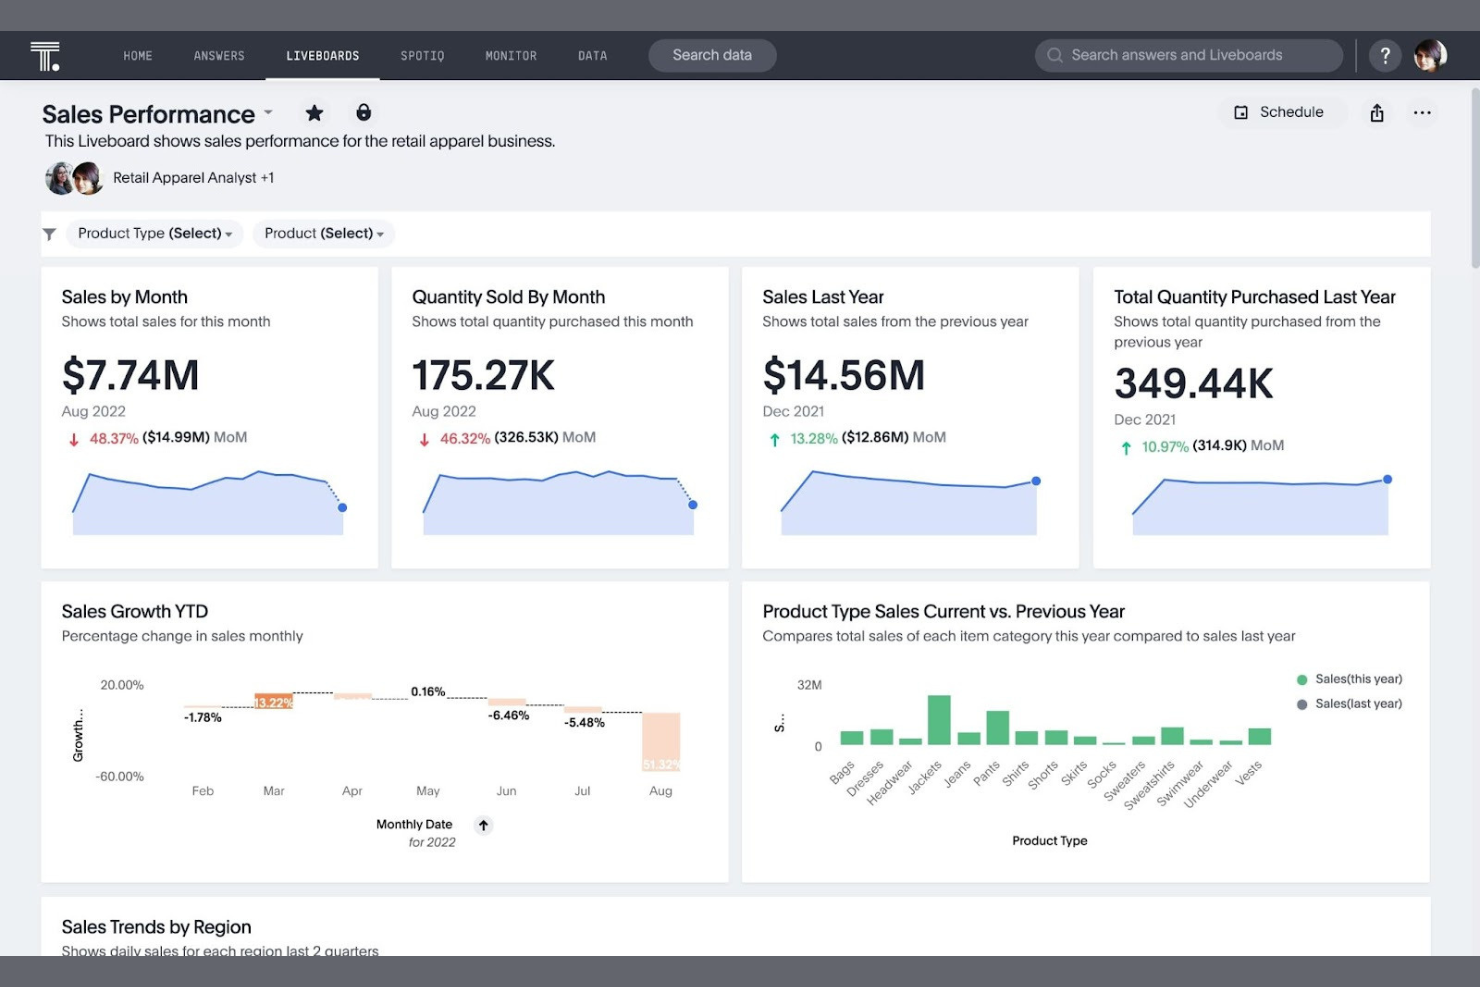
ThoughtSpot è una piattaforma di analisi progettata per eseguire ricerche e fornire approfondimenti su grandi insiemi di dati. Data analyst e professionisti del business che necessitano di accesso rapido agli insight dei dati utilizzano questo software.
Perché ThoughtSpot è una valida alternativa a Looker Studio: Gli insight basati sull’intelligenza artificiale di ThoughtSpot lo rendono ideale per i team che desiderano sfruttare analisi avanzate. Inoltre, è possibile scoprire insight senza necessità di competenze tecniche approfondite e l’interfaccia facile da usare della piattaforma supporta l’esplorazione e la visualizzazione dei dati in modo intuitivo.
Caratteristiche principali e integrazioni:
Caratteristiche includono una funzionalità di ricerca in linguaggio naturale che permette al tuo team di interrogare i dati in modo intuitivo. Sono inoltre disponibili insight automatizzati che aiutano a scoprire trend e anomalie. L’architettura scalabile della piattaforma supporta enormi quantità di dati e query complesse.
Integrazioni includono Google Cloud, VitaraCharts, Snowflake, Fivetran e altre ancora.
Pros and Cons
Pros:
- Insight guidati dall’IA
- Ricerca in linguaggio naturale
- Architettura conveniente e scalabile
Cons:
- Progettato per la ricerca, non per il design dei layout
- Richiede una configurazione complessa

Yellowfin è una piattaforma di business intelligence e analisi che offre strumenti di visualizzazione e trasformazione dei dati. I professionisti aziendali e gli analisti dei dati la utilizzano per individuare insight azionabili dai propri dati.
Perché Yellowfin è una valida alternativa a Looker Studio: Yellowfin si concentra su dashboard interattivi con funzionalità AI, aiutando il tuo team a individuare e agire rapidamente sugli insight. La flessibilità della piattaforma supporta una vasta gamma di esigenze e casi d'uso aziendali.
Funzionalità e integrazioni eccezionali:
Le funzionalità includono capacità di narrazione che ti permettono di costruire storie attorno ai tuoi dati. Yellowfin offre anche strumenti di collaborazione che permettono al tuo team di discutere gli insight direttamente all’interno della piattaforma.
Le integrazioni includono Salesforce, Google Analytics e altro ancora.
Pros and Cons
Pros:
- Dashboard interattivi
- Capacità di narrazione
- Strumenti di collaborazione
Cons:
- La creazione o modifica di report complessi su dispositivi mobili può essere difficile
- Difficoltà nell'elaborazione di dashboard complesse e multilivello

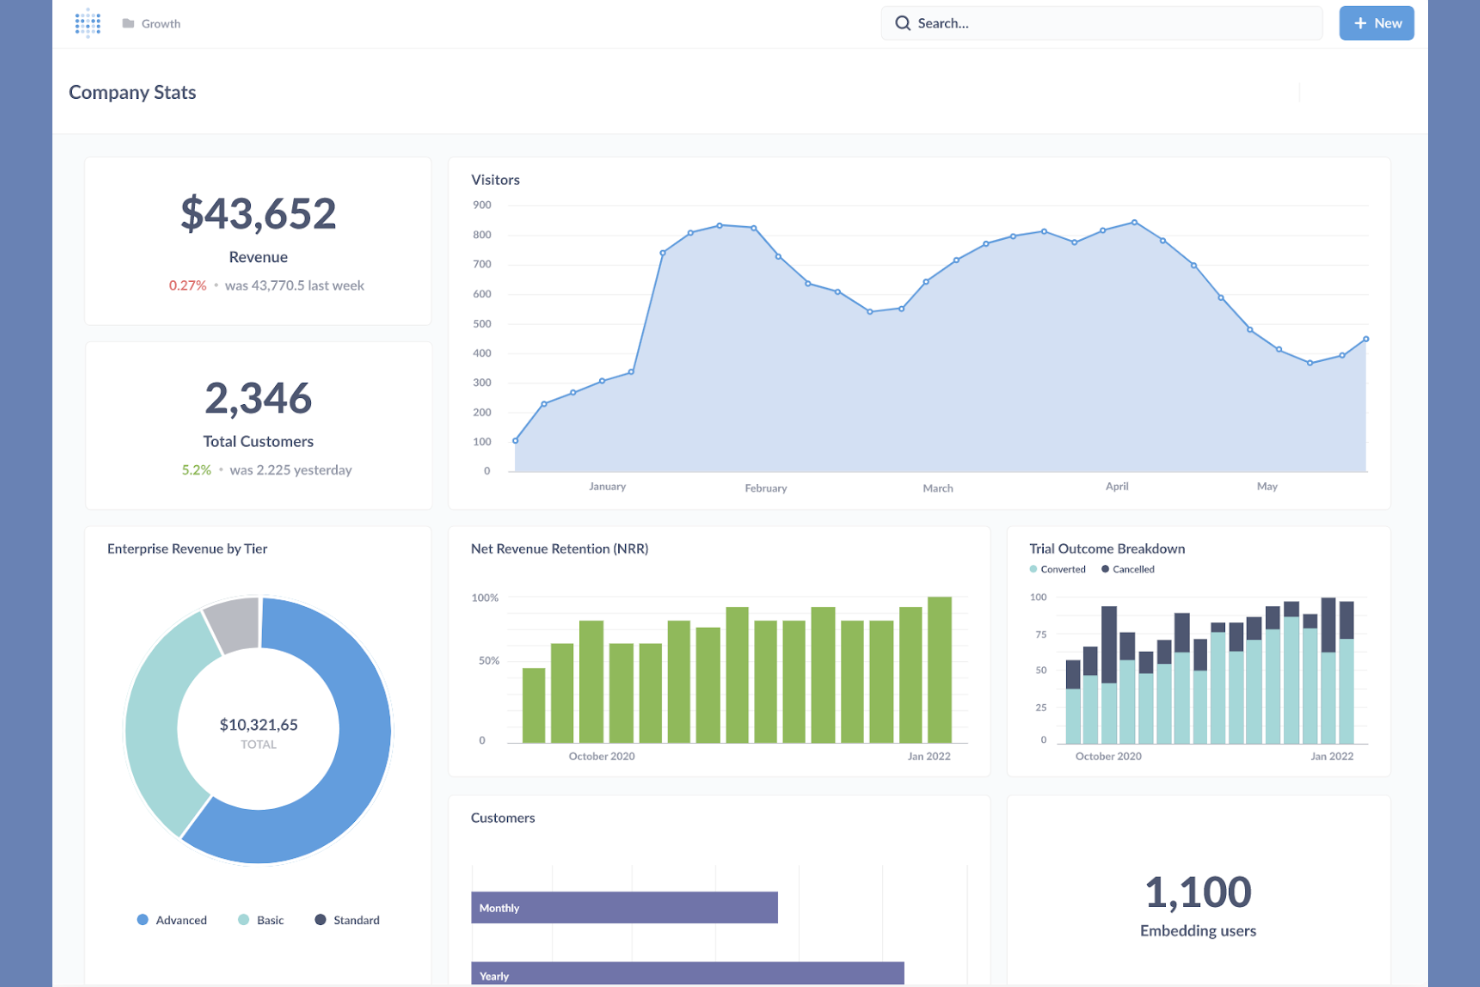
Grow è una piattaforma di business intelligence che aiuta i team a visualizzare i dati e monitorare le metriche di performance. Le piccole e medie imprese utilizzano questo strumento per prendere decisioni basate sui dati.
Perché Grow è una valida alternativa a Looker Studio: Grow offre flussi di lavoro senza codice, rendendolo ideale per i team che desiderano creare dashboard senza competenze di programmazione. La sua interfaccia intuitiva consente inoltre di costruire e personalizzare dashboard in modo efficiente.
Funzionalità principali e integrazioni:
Le funzionalità includono il monitoraggio dei dati in tempo reale che aiuta il tuo team a rimanere aggiornato con le ultime metriche. L'interfaccia drag-and-drop semplifica la creazione e la personalizzazione delle dashboard. Le sue capacità di data blending consentono di combinare dati provenienti da più fonti per una visione olistica.
Le integrazioni includono HubSpot, Google Sheets, QuickBooks, Salesforce, Shopify, Zendesk e altri.
Pros and Cons
Pros:
- Soluzioni senza codice
- Monitoraggio dei dati in tempo reale
- Capacità di data blending
Cons:
- Tipi di metriche limitati
- La pulizia complessa può comunque richiedere SQL
Altre alternative a Looker Studio
Ecco alcune altre alternative a Looker Studio che non sono entrate nella mia lista principale, ma che meritano comunque attenzione:
- Zoho Analytics
Ideale per BI e analisi end-to-end
- KNIME
Ideale per l'analisi open-source
- Jaspersoft
Ideale per la reportistica incorporata


Criteri di selezione delle alternative a Looker Studio
Nella selezione delle migliori alternative a Looker Studio per questa lista, ho considerato i bisogni comuni degli acquirenti e i punti critici relativi ai prodotti BI, come la visualizzazione dei dati e le capacità di integrazione. Ho inoltre utilizzato la seguente griglia di valutazione per mantenere il mio giudizio strutturato ed equo:
Funzionalità Principali (25% del punteggio totale)
Per essere inclusa in questa lista, ogni soluzione doveva coprire questi casi d’uso comuni:
- Visualizzazione dei dati
- Creazione di dashboard
- Reporting e analisi
- Integrazione dei dati
- Aggiornamenti dati in tempo reale
Funzionalità Distintive Aggiuntive (25% del punteggio totale)
Per restringere ulteriormente il campo, ho ricercato anche caratteristiche uniche, come:
- Analisi supportate da intelligenza artificiale
- Elaborazione del linguaggio naturale
- Analytics integrati
- Accesso da mobile
- Avvisi personalizzabili
Usabilità (10% del punteggio totale)
Per valutare l'usabilità di ciascun sistema, ho preso in considerazione i seguenti aspetti:
- Interfaccia intuitiva
- Navigazione semplice
- Opzioni di personalizzazione
- Velocità e prestazioni
- Accessibilità
Onboarding (10% del punteggio totale)
Per valutare l'esperienza di onboarding di ogni piattaforma, ho considerato i seguenti aspetti:
- Disponibilità di video formativi
- Tour interattivi del prodotto
- Template per l'onboarding
- Webinar e workshop
- Chatbot di assistenza
Assistenza clienti (10% del punteggio totale)
Per valutare i servizi di assistenza clienti di ogni fornitore di software, ho considerato i seguenti aspetti:
- Disponibilità di supporto 24/7
- Molteplici canali di supporto
- Tempo di risposta
- Risorse del centro assistenza
- Account manager dedicato
Rapporto qualità-prezzo (10% del punteggio totale)
Per valutare il rapporto qualità-prezzo di ciascuna piattaforma, ho tenuto conto dei seguenti aspetti:
- Trasparenza dei prezzi
- Rapporto tra funzionalità e costo
- Opzioni di scalabilità
- Sconti per utilizzo a lungo termine
- Disponibilità di trial o demo
Recensioni dei clienti (10% del punteggio totale)
Per comprendere il livello di soddisfazione generale dei clienti, ho valutato i seguenti punti leggendo le recensioni:
- Soddisfazione degli utenti
- Feedback sulle funzionalità
- Esperienza con il supporto
- Facilità d'uso
- Percezione complessiva del valore
Perché cercare un'alternativa a Looker Studio?
Sebbene Looker Studio sia uno strumento valido di business intelligence, ci sono diversi motivi per cui alcuni utenti cercano soluzioni alternative. Potresti voler trovare un'alternativa a Looker Studio per uno dei seguenti motivi:
- Hai bisogno di opzioni migliori per la visualizzazione dei dati
- Il tuo team richiede un'integrazione più fluida con gli strumenti esistenti
- Stai cercando piani tariffari più convenienti
- La tua organizzazione esige una maggiore protezione dei dati
- Hai bisogno di uno strumento che supporti set di dati più grandi
- Il tuo team desidera una migliore accessibilità da mobile
Se ti riconosci in uno di questi punti, sei nel posto giusto. La mia lista comprende diverse opzioni di BI Tools più adatte ai team che affrontano queste sfide con Looker Studio e sono alla ricerca di soluzioni alternative.
Funzionalità chiave di Looker Studio
Ecco alcune delle principali funzionalità di Looker Studio per aiutarti a confrontare e valutare le soluzioni alternative:
- Interfaccia intuitiva: Un design semplice con funzionalità drag-and-drop permette al tuo team di creare report rapidamente.
- Template per i report: Modelli personalizzabili consentono di visualizzare i dati secondo le tue necessità specifiche.
- Connettori dati: Oltre 800 connettori ti permettono di integrare facilmente molteplici fonti di dati senza bisogno di programmare.
- Accesso API: L'automazione e la gestione tramite API consentono di gestire le risorse all'interno di Google Workspace o Cloud Identity.
- Incorporamento dei report: Incorpora i report su pagine web o intranet per migliorare la condivisione e la collaborazione all'interno della tua organizzazione.
- Aggiornamento dati in tempo reale: Mantieni dashboard e report sempre aggiornati attraverso il refresh automatico.
- Metriche personalizzate: Crea metriche specifiche per soddisfare le esigenze di reportistica del tuo team.
- Campi calcolati: Aggiungi nuove informazioni creando campi a partire dai dati già presenti, senza modificare la fonte dati.
- Data blending: Combina dati da varie fonti per avere una panoramica dettagliata dei KPI aziendali.
- Dashboard interattive: Interagisci con i tuoi dati grazie ad elementi che consentono filtri ed esplorazioni approfondite.
Cosa succede ora:
Se stai cercando strumenti di business intelligence, collegati gratuitamente con un consulente SoftwareSelect per ricevere raccomandazioni.
Compila un modulo e fai una breve chiacchierata in cui si approfondiscono le tue esigenze specifiche. Poi riceverai una lista ristretta di software da valutare. Ti supporteranno anche durante l’intero processo d’acquisto, incluse le negoziazioni sul prezzo.