10 Die beste gantt chart software im Überblick
Here's my pick of the 10 best software from the 20 tools reviewed.


Gantt Chart FAQ
Wenn du ein Projektmanager bist, dann hast du wahrscheinlich schon einmal nach einer Möglichkeit gesucht, ein Gantt-Diagramm online zu erstellen. Das Ding ist… nicht nur PMs brauchen einen Gantt Chart Maker. Praktisch jede Aufgabe, jedes Projekt, jede Abteilung oder jeder koordinierte Arbeitsaufwand könnte davon profitieren, wenn man ein einfaches Gantt-Diagramm zur Skizzierung des Ausgangspunktes, des Fortschritts und des vorgesehenen Ziels nutzt./
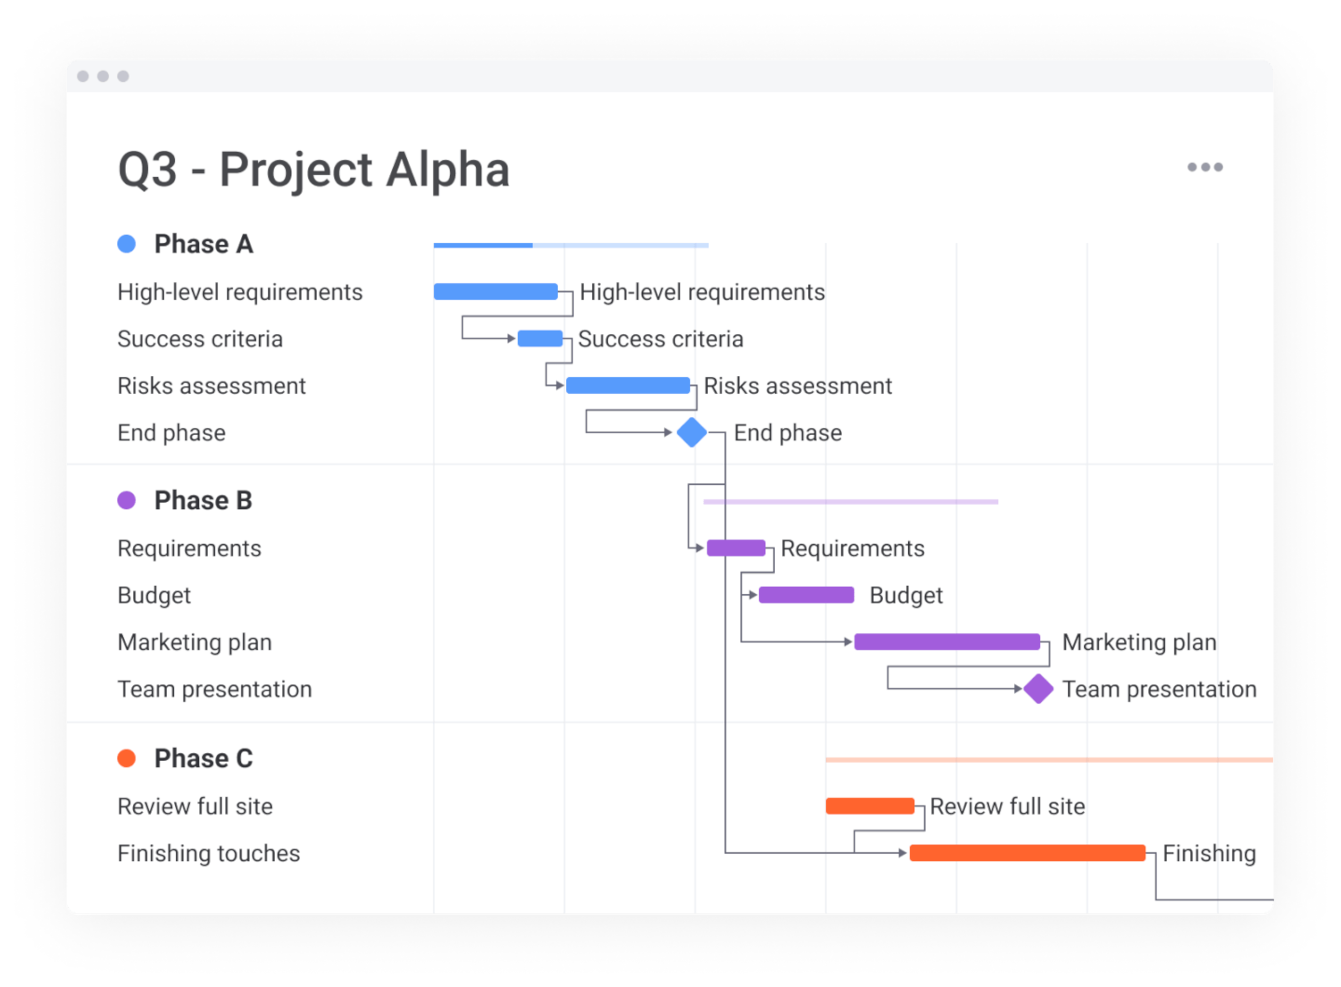
Was sollte ein Gantt-Diagramm beinhalten?
Die beste gantt chart software beinhaltet die Timeline des Projektplans, die Überlagerung von voneinander abhängigen Aufgaben (d.h. Aufgabe B kann erst beginnen, wenn Aufgabe A abgeschlossen ist), Zeitschätzungen, einen Zeitplanstatus, Teamzuweisungen und mehr.
Welche Vorteile hat ein Gantt-Diagramm?
Die Hauptvorteile eines Gantt-Diagramms sind die Vogelperspektive auf jedes Projekt, die Möglichkeit, eine Zeitleiste von Aufgaben schnell zu bewerten und die Möglichkeit, das Diagramm anzupassen und die neuen Endergebnisse zu sehen.
Beinhaltet Trello Gantt-Diagramme?
Gängige Trello Power-Ups, wie TeamGantt, können in Trello integriert werden, um bestehenden Trello-Kunden Gantt-Diagrammfunktionen zur Verfügung zu stellen. Die Basis-App von Trello nutzt Bretter, Listen und Karten und unterstützt den Kanban-Stil in der Organisation.
Beinhaltet Asana Gantt-Diagramme?
Ja, Asana unterstützt die Erstellung von Gantt-Diagrammen. Dies ist Bestandteil sämtlicher kostenpflichtiger Pakete. Du kannst auch kostenlose, in Asana integrierte Apps wie Instagantt verwenden.
Was ist die beste Gantt-Diagramm Freeware?
Es gibt viele kostenlose Optionen für gantt chart software, die online verfügbar sind, einschließlich RedBooth, GanttProject, Bitrix24, Agantty, Teamweek und Instagantt für Asana.
Du interessierst dich für mehr als nur einen Gantt-Diagramm-Maker? Schau dir unsere anderen Listen mit Projektplanungs-Tools an, um Teams, Ressourcen und Projekte zu verwalten:
- Nicht 100% begeistert von Gantt-Diagrammen allein? Wir haben auch die besten agilen Tools des Jahres 2019 getestet.
- Jeder, der auf der Suche nach dem “besten Gantt-Diagramm” ist, muss auch die Bedeutung großartiger Projektmanagement-Tools im Allgemeinen kennen, von denen viele Gantt-Diagramme nur als ein Element einer kompletten Projektplanungs-Suite beinhalten.
- Auf der Suche nach einer robusteren Alternative zu Gantt-Diagrammen für Zeitpläne und Planung? Wir stellen auch einige der besten Projektplanungs-Software des Jahres 2019 vor.
Ich habe diesen Artikel geschrieben, um dir zu helfen, die beste gantt chart software und Projektplan-Tools schnell zu vergleichen und zu bewerten.
Als Projektmanager hast du gute Chancen, ein oder zwei Gantt-Diagramme im Laufe der Zeit zu entdecken. Das von Henry Gantt in den frühen 1900er Jahren populär gewordene Gantt Chart ist seit langem ein beliebtes Tool für die Planung von Aktivitäten, den Aufbau von Zeitplänen und die Darstellung aller Aspekte eines Projekts aus einer Makroperspektive.
Gantt-Diagramme helfen dir bei der Planung, Verwaltung und Ausführung. Deshalb kannst du als PM nicht ohne sie auskommen – also nutze das Gantt Chart und lies weiter, um die wichtigsten Programme zu entdecken, die ich dir empfehle, um diese zu erstellen, zu teilen und zu verwenden.
Abhängig von deinen Bedürfnissen und deinem Budget gibt es Online-Tools zur Erstellung von Gantt Chart. Diese können speziell auf deine Bedürfnisse zugeschnitten werden. Hier fasse ich die Vor- und Nachteile der besten gantt chart software auf dem Markt zusammen.
In diesem Beitrag werde ich:
- Dir die Projektplanungs-Software vorstellen, die du in deine Auswahlliste für Gantt-Diagramm-Vorlagen aufnehmen kannst.
- Erklären, was Gantt-Diagramm-Tools sind.
- Erklären, wie Gantt-Diagramme dir helfen können, eine Timeline online zu erstellen.
- Einige FAQs über gantt chart software beantworten.
- Dir erklären, worauf du achten solltest, wenn du eine Timeline online machst.
- Die Bewertungskriterien für Gantt-Diagramm-Tools erläutern.
- Einen einfachen Vergleich von Gantt-Diagramm Vorlagen-Tools zur Verfügung stellen.
Bist du bereit, die gantt chart software zu finden, die deine Träume erfüllt? Kommen wir zur Sache.
The Digital Project Manager ist Reader-unterstützt. Wenn du durch Links auf unserer Website klickst, erhalten wir möglicherweise eine Provision. Mehr erfahren.
-

Hub Planner
Visit WebsiteThis is an aggregated rating for this tool including ratings from Crozdesk users and ratings from other sites.4.2 -
monday.com
Visit WebsiteThis is an aggregated rating for this tool including ratings from Crozdesk users and ratings from other sites.4.7 -
Jira Software
Visit WebsiteThis is an aggregated rating for this tool including ratings from Crozdesk users and ratings from other sites.4.2


Die ultimative Liste zum Erstellen von Gantt-Diagrammen
Vergleiche und bewerte die besten 10 Gantt Chart Software im Handumdrehen
monday.com is a work management platform that does many things related to project planning and resource tracking. Gantt charts are just one of the key features offered in this work management suite.
Why I picked monday.com: This platform's customizability is what ultimately earned its spot on my list. I admire how the plaform allows you to craft Gantt charts that display the specific information you need, and set them up for managing schedules, projects, product roadmaps, and more. In addition to Gantt charts, you can access Kanban, timeline, workload, and other views in the platform. And to get your Gantt chart set up quickly and use your existing data, you can import a spreadsheet from Excel and turn it into a Gantt chart, which I think makes this a great tool for teams just starting to use Gantt charts.
monday.com Standout Features & Integrations
Key standout features of the software include its built-in goal and resource management capabilities. You can set goals and objectives in the platform, and outline the strategy that will help you achieve them. Those goals can then be connected with various projects and tasks, helping everyone see the bigger picture. You can also track team workloads and assign tasks to specific team members.
Integrations include Dropbox, Excel, Google Calendar, Google Drive, Integromat, Slack, Trello, and even more through a paid plan with Zapier.
Pros and cons
Pros:
- Complete work management platform
- Free-forever plan available
- User-friendly and intuitive interface
Cons:
- Gantt charts not included in basic or free plan
- Limited storage in basic and free plans

ClickUp is a comprehensive work management solution that offers a Gantt chart maker among several other features like whiteboarding, goal setting, document management, and more.
Why I picked ClickUp: I chose GlickUp's Gantt chart maker for this list because it is friendly, intuitive, and comprehensive. It can help you manage deadlines and dependencies, mitigate bottlenecks, and outline tasks. It also lets you set cascading priorities and zoom in or out on the details of a project.
The other main reason I chose this software for my list is its team collaboration features. Whiteboards let your team brainstorm and map out their ideas, commenting and live chat keeps everyone in the loop, and proofing allows for feedback rounds and approvals. I think this is a great tool to supplement the Gantt chart maker and help your team create workflows that work for everyone.
ClickUp Standout Features & Integrations
Among this software's standout features for Gantt charts is its critical path tool. The feature provides intelligent dependency-path tracking, helping to reveal potential bottlenecks in your project plans and roadmaps. Another cool feature of this product is that it also acts as several other workplace tools you might need, and connects everything under one roof. Your projects, tasks, documents, ideas, and goals can all be connected in the system, creating a holistic overview of the work getting done across your organization.
Integrations include Slack, Google Workspace, Dropbox, Figma, Vimeo, Zoom, Box, and Microsoft Teams. You can also use Zapier for additional integrations, or build custom integrations using the software's API.
Pros and cons
Pros:
- Unlimited file storage with all paid plans
- 50+ widgets to customize your dashboard
- Unlimited users with free plan
Cons:
- Storage, projects, and custom fields limited in free plan
- Reporting not available in free plan

Think-cell is a software add-on for Microsoft PowerPoint and Excel that helps you easily create various types of charts for your presentations to stakeholders, including Gantt charts.
Why I picked Think-cell: For project managers who spend more than 2 hours per week preparing presentations in Excel or PowerPoint, I believe this software will save you tons of time and headaches. It lets you build adjustable calendar-based Gantt charts right inside of PowerPoint, with drag-and-drop capabilities for timelines, dependencies, and milestones. You can also link Excel sheets to PowerPoint charts so any data updates will carry-over to your Gantt chart.
think-cell Standout Features & Integrations
Standout features include 5- or 7-day weeks for your planning, and my favorite features are the ready-made labels and Harvey Balls that let you show responsibility and progress on each task. In addition to Gantt charts, the software makes it easier to build waterfall charts, bar charts, Mekko charts, pie charts, line graphs, butterfly graphs, and many more. In my opinion, Think-cell is a handy, accessible tool that can really speed up your process of developing presentations and reports.
Integrations include Microsoft PowerPoint and Microsoft Excel.
Pros and cons
Pros:
- User-friendly, even for non technical experts
- Automation to speed up repetitive tasks
- Elevates you capabilities with Microsoft products
Cons:
- Pricing is not transparent
- Difficult to shift data to a new chart once one is created

Zoho Projects is a project management software with a built-in Gantt chart maker. It's a highly detailed solution, helping you ensure no important information gets lost.
Why I picked Zoho Projects: In my experience, this platform's interactive Gantt charts are easy to create, manage, and update, but I added it to my list primarily because of how detail-oriented it is. I love that you can set up four different types of task dependencies, helping make it super clear how different aspects of your project are interconnected. These dependencies can also be given specific time delays between tasks, which I think makes it a great option for teams that want very precise, to-the-minute workflows. Your Gantt chart is also color-coded, helping you differentiate tasks and resources as needed. If you need to adjust something on the fly, it's easy to do with the drag-and-drop interface.
Zoho Projects Standout Features & Integrations
Standout features include the customization options in the Gantt chart maker. You can add custom colors for color-coding, arrange your view as you wish, and adjust the visibility of specific modules. Another useful feature is the ability to export Gantt charts as a PDF, which can help you out for presentations. You can also export task lists as XLS or CV files.
Integrations include all the Zoho apps, Google Workspace, Microsoft Suite, Jira, Basecamp, Box, Dropbox, GitHub, GitLab, Zendesk, and Slack, among others. You can also connect to Zapier for additional integrations.
Pros and cons
Pros:
- Free plan for up to 2 projects
- Task automation through the Blueprint feature
- Connects easily with the complete Zoho product suite
Cons:
- Takes time to learn the platform
- Subtasks not available in free plan
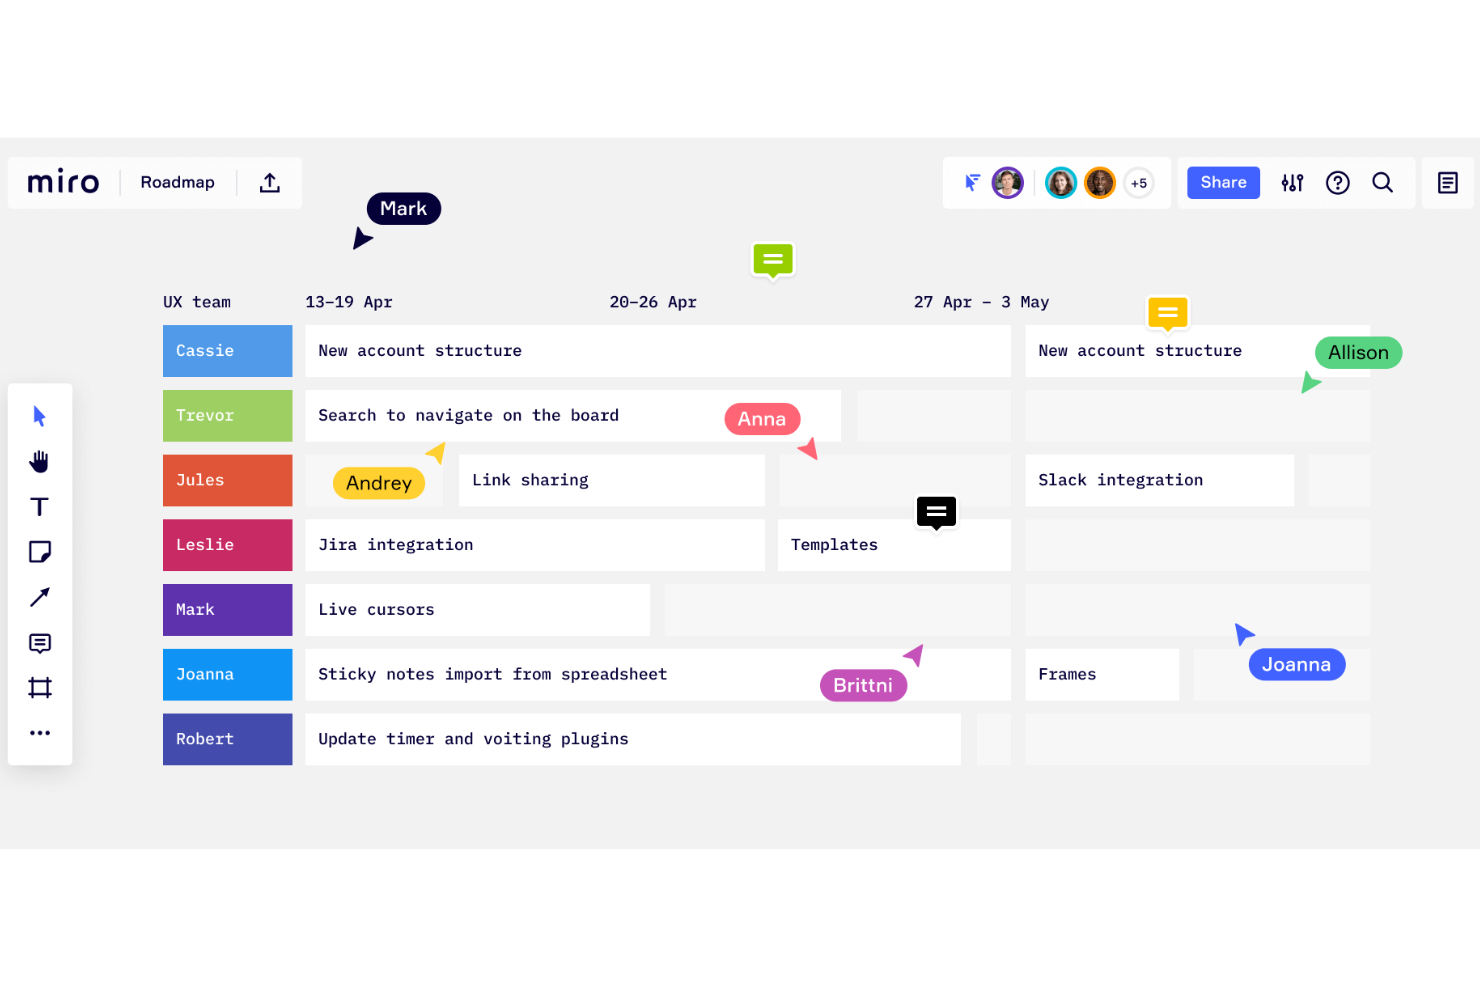
Miro is a collaborative online whiteboard with over 1,000 templates including mind maps, Kanban boards, Gantt charts, product wireframes, research boards, and flowcharts.
Why I picked Miro: This platform made it onto my list because of just how flexible it is. This flexibility shines with a variety of visual tools like flowcharts, tables, and mind maps. The platform allows for the inclusion of diverse content types—numerical data, images, and videos—on an infinite canvas.
Users can also import charts from other applications, like Visio, and utilize quick diagram tools for efficient modifications. Miro additionally integrates with key project documentation tools such as Notion, Confluence, Asana, and Monday.com, facilitating a seamless connection between planning and workflow management, making it a practical choice for collaborative project management.
Miro Standout Features & Integrations
Some of the standout features of this software are its built-in collaboration tools. Team members can work together on a whiteboard in real-time, and use video chat to collaborate live. Miro's TalkTrack feature also allows users to create videos explaining processes that can be viewed asynchronously. You can also set timers, voting, comments and stickies to help facilitate brainstorming and ideation. The interactive presentation mode is also good for sharing your Gantt chart with your team or stakeholders.
Integrations include Zoom, Figma, Asana, Microsoft Teams, Jira, Slack, Google Drive, Box, Confluence, monday.com, Airtable, Notion, Azure, and Webex. Some integrations are limited to paid plans only.
Pros and cons
Pros:
- Built-in communication features
- Free forever plan available
- Intuitive and easy setup
Cons:
- No high-quality PDF export with free plan
- Zooming can be jumpy on larger projects

Canva is an online design platform built to be user-friendly for non-design experts. It offers templates for all kinds of things, from Gantt charts to slide decks, infographics, social media assets, and more.
Why I picked Canva: I'm a big fan of this software's simple, straightforward drag-and-drop interface. It is easy to use, even for the least tech-savvy among us. Moreover, I chose Canva for this list because not only is it super intuitive, it also comes with a ton of templates that are ready to go. You can select from the hundreds of thousands of templates available, and then customize it to best meet your needs. In my opinion, Canva's free plan is a fantastic, quick way to create a presentation-ready Gantt chart at no added cost. Plus, you'll be able to use the platform for all kinds of other design needs, too.
Canva Standout Features & Integrations
Standout features include the range of design elements you can use in the platform. Shapes, patterns, text, photos, graphics, and more can all be used to craft your masterpiece. Your final result can also take shape in a number of formats. A simple, static image is one option, but you can also create videos, presentations, whiteboards, and even websites. It's a super flexible tool.
Integrations include WordPress, eClincher, Rippling, Sendible, Post Planner, and Viraltag.
Pros and cons
Pros:
- Presentable product, no designer needed
- Hundreds of thousands of templates
- Super user-friendly and intuitive
Cons:
- Limited download options with free plan
- Lacks advanced Gantt chart features
FigJam is an online whiteboard tool designed to facilitate real-time collaboration among team members, providing a dynamic platform for a variety of activities including brainstorming, diagramming, and strategic planning.
Why I Picked FigJam: I chose FigJam by Figma as a 'gantt chart maker' because of its capacity for real-time collaboration, which is crucial for maintaining up-to-date project timelines and ensuring team alignment. What makes FigJam different is its integration of AI features that can generate custom templates and automate repetitive tasks, which can be particularly useful when creating and updating Gantt charts.
I believe FigJam is best for real-time team collaboration because it not only allows team members to work together synchronously with audio and live chat but also supports asynchronous communication through comments and reactions, ensuring that all team members, regardless of their location or time zone, can contribute to the project planning process.
FigJam Standout Features & Integrations
Features include real-time brainstorming with audio, live chat, and comments, as well as the use of stamps and emotes for feedback. It offers over 300 templates and AI-generated custom visuals for diagramming, and supports strategic planning with tools like Jambot.
Integrations include Figma, Microsoft Teams, Asana, Jira, Mixpanel, and Github.
Pros and cons
Pros:
- User-friendly and intuitive interface
- Integrates with Figma for design collaboration
- Offers community templates for various uses
Cons:
- Onboarding and account support locked to enterprise plan
- No offline access available

Microsoft Project is a project management software developed and sold by Microsoft. It is designed to assist project managers in planning, tracking, and managing projects of various sizes and complexities, often through features such as its Gantt chart maker.
Why I picked Microsoft Project: If you're anything like me, you're almost too familiar with the Microsoft Office Suite. Microsoft Project Online turns this into an asset, as it uses familiar software UI to give you an intuitive way to visualize various project angles. I personally think that MS Project Online is a great example of Gantt chart template software, offering loads of built-in templates and familiar scheduling tools that make it easy to launch and navigate each assignment. The Gantt chart builder lets you select items for phase indicators, start and end dates, and RAG risk status.
Microsoft Project Standout Features & Integrations
Standout features include the ability to generate a Gantt chart from a spreadsheet. This is super helpful if you're trying to migrate from Excel or create something more presentation-worthy for your stakeholders. Meanwhile, the visual heatmaps are super helpful for identifying and avoiding over-allocation. Finally, I really appreciate the portfolio management capabilities, particularly for professional services businesses or enterprise organizations.
Integrations include other Microsoft software, like Outlook, Excel, Skype, and more.
Pros and cons
Pros:
- Integration with other Microsoft software
- Helpful project template descriptions for guidance
- Driver prioritization module for ranking strategies/objectives
Cons:
- Steep learning curve
- Limited customization options

Paymo is Gantt Chart software designed to help small and medium teams own their entire project cycle. But Paymo is not just a Gantt Chart maker, it’s a project management software offering task management, time tracking, resource scheduling, and invoicing modules.
Why I picked Paymo: I selected Paymo for this list because it comes with Gantt chart features that allow you to plan, schedule, and display your projects on a visual timeline and identify bottlenecks early on. Apart from the standard dependencies, you can set lead and lag time to account for overlaps or delays. I also like that you can even auto-schedule tasks based on those dependencies and constraints. Gantt chart-wise, click and drag on the timeline to estimate task duration, then pinch its ends to extend or shorten it. Add milestones, set up notifications, and monitor the progress of each project and adjust due dates when necessary.
Paymo Standout Features & Integrations
A standout feature of this product is the ability to export and share your Gantt charts. Once you're finished creating your Gantt chart, you can simply click the Export button to save the project timeline and send it over to a client or team member. The software also offers a Portfolio Gantt chart that caught my attention, as it acts as a pipeline with all project timelines on a single screen.
Integrations include popular apps such as Slack, Google Suite, Jotform and even accounting tools. Other integrations are available through Zapier or by syncing with their fully-documented API.
Pros and cons
Pros:
- Freemium plan with unlimited tasks
- Easy to use project filters
- Easy to share content with external stakeholders
Cons:
- Some data export limitations
- Gantt charts locked to higher-tier plan

Backlog is a cloud-based project management tool that I believe is perfect for developers and the teams with which they collaborate. Backlog provides a range of useful collaboration features including task management (including subtasks, checklists, and custom fields), milestones, burndown charts, file management, wikis, and most importantly, a Gantt chart maker. But my favorite feature is that Backlog is more than a collaboration and Gantt chart tool; it’s also a bug tracker and version control system in one.
For collaborating on code, Backlog provides SVN and Git repositories, a differences viewer and inline comments, plus pull requests, merge requests, and branches. Visually, the app provides burndown charts, Git graphs, and Gantt charts, so project managers and users alike can quickly assess projects at a glance.
Backlog allows you to assign, track, and release work, right in one app while ensuring transparency and accountability across teams. If you’re looking for a tool to help manage development projects or for working closely with a team of developers, I highly recommend this app.
Backlog works for a range of team sizes. They have a free account available to teams of up to 10, while also offering a self-hosted Enterprise option for larger companies. They also provide a mobile app on both iOS and Android for collaborating on-the-go. It integrates with Nulab’s other apps and provides both Redmine and Jira importers.
Backlog is free for up to 10 users with some feature limitations, or $35/month for up to 30 users. For $100/month, your team gets unlimited users, i.e. their Standard Plan.
Die beste Zusammenfassung zum Erstellen von Gantt-Diagrammen
| Tools | Price | |
|---|---|---|
| monday.com | From $8/user/month (billed annually, min 3 seats) | Website |
| ClickUp | From $7/user/month | Website |
| think-cell | Pricing upon request | Website |
| Zoho Projects | From $4/user/month (billed annually) | Website |
| Miro | From $10/user/month | Website |
| Canva | From $14.99/user/month | Website |
| FigJam by Figma | From $3/user/month | Website |
| Microsoft Project | $10/user/month | Website |
| Paymo | From $5.95/user/month | Website |
| Backlog | From $35/month for up to 30 users | Website |
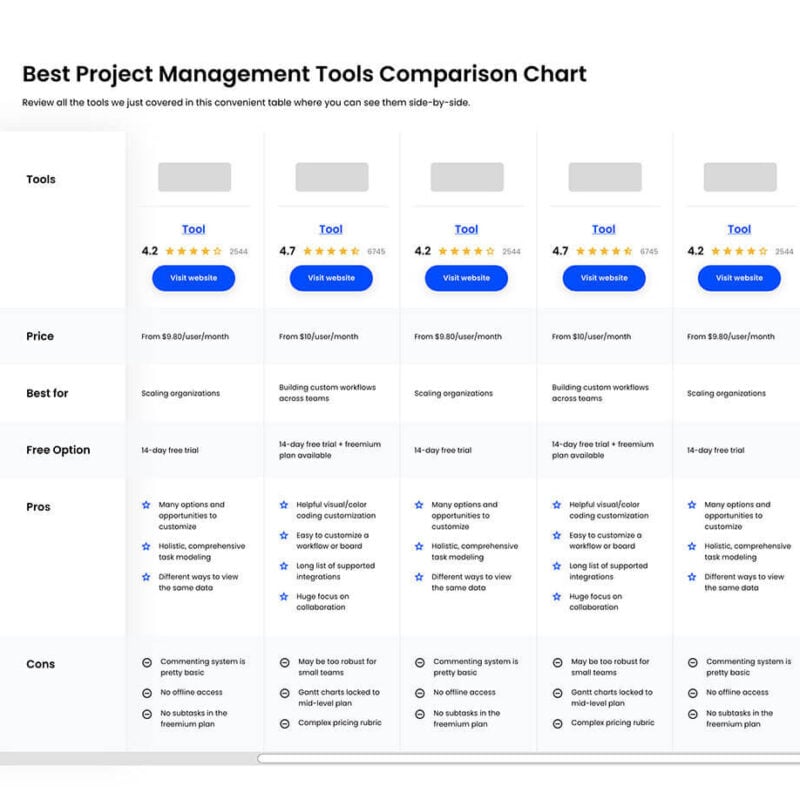
Compare Software Specs Side by Side
Use our comparison chart to review and evaluate software specs side-by-side.
Compare SoftwareVergleichskriterien für Online Gantt Tools
Worauf genau achte ich bei der “besten” gantt chart software? Hier sind einige der Punkte, die ich bei jeder Bewertung berücksichtige.
- Benutzeroberfläche (UI): Wie durchdacht ist sie? Bietet sie übersichtliche Anzeigen und intuitive Navigation?
- Benutzerfreundlichkeit: Ist es einfach zu verstehen und zu beherrschen? Gibt es Tutorials und Schulungen? Bietet das Unternehmen einen guten technischen und Anwender-Support?
- Merkmale & Funktionalität: Wie viele der wichtigsten Funktionen bietet das Zeitmanagement-Diagramm und wie leistungsfähig ist es? Konkret habe ich danach recherchiert:
- Zusammenarbeit & Freigabe: Die Möglichkeit, Rollen festzulegen, Aufgaben den Teammitgliedern zuzuweisen (Echtzeit-Zusammenarbeit zur gleichzeitigen Zusammenarbeit mit Kollegen in Gantt-Diagrammen ist ein Pluspunkt). Kommentarfunktion für Aufgaben und Anhängen von Dateien, Fotos, Videos, Notizen oder Dokumenten. Freigeben und Exportieren in gängige Formate wie PDF, PNG, XLSX und XML.
- Drag & Drop: Einfache Anordnung, Erweiterung und Verkürzung von Aufgaben durch einfaches Klicken und Ziehen. Ebenso sollte es die Software intuitiv machen, Aufgaben, Abhängigkeiten, Attribute, Einrückungen, Ausrückungen und Prioritäten schnell anzuklicken und hinzuzufügen.
- Benachrichtigungen & Warnmeldungen: Empfangen von Benachrichtigungen über Erwähnungen, Änderungen, anstehende Aufgaben und gefährdete Elemente, mit denen du Aufgaben effektiv neu priorisieren und die richtigen Updates mit den Beteiligten teilen kannst.
- Automatische Planung: auch als Dependency Tracking bezeichnet, was bedeutet, dass die Software automatisch nachgelagerte Aufgaben entsprechend den Abhängigkeiten anpasst und die kaskadierenden Aufgaben neu berechnet, wenn eine vorherige Aufgabe Änderungen erfährt.
- Integrationen: Ist es einfach, eine Verbindung mit anderen Tools herzustellen? Irgendwelche vorkonfigurierten Integrationen?
- Wert für $: Wie angemessen ist der Preis für die Funktionen, Fähigkeiten und den Anwendungsfall? Ist die Preisgestaltung klar, transparent und flexibel?
Andere Online Tools zur Erstellung von Timelines
Die oben aufgeführten Tools sind nicht die einzigen Gantt Chart Maker auf dem Markt. Hier sind noch einige weitere Gantt-Tools, die eine ehrenvolle Erwähnung bekommen haben.
- ProjectManager.com
Best Gantt chart maker for enterprises
- FunctionFox
Best for custom views and filtering capabilities
- Office Timeline
Best for timeline creation
- Visor
Best for spreadsheet integration
- Height
Best for providing guest access
- TeamGantt
Best Gantt chart to manage team, projects, & workloads
- Gantter
Best with a first-of-its-kind AI Recommendation Engine
- MindView
Best for its work breakdown structure modules
- GanttPRO
Best Gantt chart-oriented project management
- MeisterTask
Best Gantt chart tool for agile teams


Möchtest Du Die Optionen Eingrenzen?
Dieses Tool ist ziemlich nützlich. In Zusammenarbeit mit Crozdesk haben wir uns bemüht, dir Zugang zu dem „Software-Finder“ zu geben.
Wenn du einige der Details über dein Projekt und die Funktionen, die du in einem Projektmanagement-Tool suchst, eingibst, wird eine Liste von Tools erstellt, die deinen Präferenzen entsprechen. Du gibst deine E-Mail an das Team weiter und es schickt dir einen nützlichen PDF-Leitfaden mit einer Zusammenfassung deiner besten Übereinstimmungen.
Was hältst du von der besten gantt chart software?
Gantt Chart sind nur ein Weg, wie du deine Zeit aufzeichnen, Prioritäten setzen, vorausplanen, organisiert bleiben, Zeit planen und delegieren kannst – alle wichtigen Funktionen eines Master of Time Management. Welche gantt chart software ist dein ultimatives Ziel? Haben wir etwas übersehen, das deiner Meinung nach in die Liste hätte aufgenommen werden sollen? Lasst es uns in den Kommentaren unten wissen.