

2026’da İncelenen En İyi 10 Yapay Zeka Raporlama Aracı

En İyi Yapay Zekâ Raporlama Araçları Kısa Listesi


Proje raporlaması zaman alıcıdır, ayrıntı gerektirir ve hatalara yer bırakmaz. Sürekli analiz edilecek veriler, verilecek kararlar ve hazırlanacak sunumlar, işinizi daha karmaşık hâle getirmek yerine basitleştiren bir araca duyulan ihtiyacı ortaya çıkarır. İşte yapay zekâ raporlama araçları tam bu noktada devreye girer. Bu araçlar, sizin ve ekibinizin karmaşık verileri anlamlandırmasına yardımcı olmak için yapay zekânın gücünden yararlanır ve daha iyi kararlar almanızı sağlayan içgörüler sunar.
Size tarafsız ve kapsamlı araştırmalara dayanan seçenekler sunmak için çeşitli yapay zekâ raporlama araçlarını incelemeye zaman ayırdım. Deneyimlerime göre bu araçlar, günlük çalışmalarınızda gerçek bir fark yaratabilir.
Bu makalede, yapay zekâ raporlama araçları için en iyi önerilerimi paylaşacağım. Her birini farklı kılan özellikleri ve iş akışınıza nasıl uyabileceklerini öğreneceksiniz. Projelerinizi daha verimli bir şekilde yönetmenize yardımcı olabilecek çözümlere birlikte göz atalım.
Why Trust Our Software Recommendations
Our team has been testing and reviewing software since 2012. As project managers ourselves, we know how difficult—and important—it is to choose the right software.
For this guide, we evaluated tools using hands-on testing and independent research, scoring tools using our selection criteria. We also draw on insights from industry thought leaders and practicing project management experts.
Our reviews reflect our human editorial judgment, not a sales pitch.
Expert reviewers:
Yapay Zekâ Raporlama Araçları Karşılaştırma Tablosu
\u003cspan style=\u0022font-weight: 400;\u0022\u003eBu karşılaştırma tablosu, en iyi yapay zekâ raporlama araçları seçimlerimdeki fiyatlandırma ayrıntılarını özetlemektedir:\u003c/span\u003e
| Tool | Starting Price | Website | |
|---|---|---|---|
| Best for custom dashboards | 4.8 out of 5 | $44/mo Free trial available | Website |
| Best for real-time insights | 4.7 out of 5 | $120/month 14-day free trial | Website |
| Best for SEO tracking | 4.7 out of 5 | $20/client/month Free demo + 14-day free trial | Website |
| Best for interactive dashboards | 4.5 out of 5 | Pricing upon request 14-day free trial | Website |
| Best for data visualization | 4.4 out of 5 | $300/month 30-day free trial | Website |
| Best for marketing reports | 4.5 out of 5 | $812/month Free demo available | Website |
| Best for team collaboration | 4.4 out of 5 | Pricing upon request 30-day free trial | Website |
| Best with retroactive data transformation | 4.3 out of 5 | Pricing upon request Free trial available | Website |
| Best for Microsoft integration | 4.8 out of 5 | $14/user/month Free plan available | Website |
| Best for automated reporting | — | Pricing upon request Free demo available | Website |
En İyi Yapay Zekâ Raporlama Araçları İncelemeleri
\u003cspan style=\u0022font-weight: 400\u0022\u003eAşağıda, kısa listeme giren en iyi yapay zekâ raporlama araçlarına ilişkin ayrıntılı özetlerimi bulabilirsiniz. İncelemelerim, sizin için en iyi aracı bulmanıza yardımcı olmak amacıyla her aracın temel özelliklerine, artılarına \u0026 eksilerine, entegrasyonlarına ve ideal kullanım alanlarına ayrıntılı bir bakış sunar.\u003c/span\u003e

DashThis
Best for custom dashboards

DashThis is a reporting tool designed for marketers and agencies who need to create custom dashboards. It helps users consolidate marketing data into one place, making it easier to track performance and share insights with clients.
Why I picked DashThis: DashThis excels at providing AI-powered insights to help you quickly identify marketing wins and issues across your reports and dashboards. You can also create custom dashboards that allow you to present data in a way that suits your specific needs. The tool's drag-and-drop interface makes it easy to build dashboards without needing technical skills. You can automate data updates, ensuring your dashboards always reflect the latest information. DashThis also offers pre-set templates, which can save time for your team.
Standout Features & Integrations
Features include automated data updates that keep your dashboards current, pre-set templates for quick setup, and a drag-and-drop interface for easy customization. You can also schedule reports to be sent to clients automatically. The platform provides a variety of visualization options to suit different reporting needs.
Integrations include Google Analytics, Facebook Ads, Instagram, LinkedIn, Twitter, YouTube, Shopify, Mailchimp, HubSpot, and Google Ads.
Pros and Cons
Pros:
- Scheduled report delivery
- Automated data updates
- Customizable dashboard options
Cons:
- Not ideal for complex data analysis
- Requires learning for new users
- Limited advanced customization
New Product Updates from DashThis

DashThis Adds AI-Powered Custom Data Sources Through MCP
DashThis now lets you add custom data sources to dashboards using AI through Claude or ChatGPT via MCP, turning data from non-native tools, spreadsheets, emails, or screenshots into scheduled widgets. For more information, visit DashThis's official site.
 .

Best for real-time insights

Klips is a dashboard and reporting tool designed for businesses that need to monitor key performance indicators in real-time. It's used by business analysts and managers who require up-to-date data to make informed decisions quickly.
Why I picked Klips: Klips is ideal for real-time insights, offering live dashboards that keep you informed with the latest data. The tool's customizable dashboards let you tailor what metrics you monitor, ensuring they align with your business goals. You can set up alerts to notify your team of any significant changes. Klips also provides a wide range of visualization options to present data effectively.
Standout Features & Integrations
Features include customizable dashboards that let you focus on the metrics that matter most, real-time data updates for immediate insights, and alert notifications for significant changes. The tool offers a variety of visualization options to suit different reporting needs. You can also access historical data for trend analysis.
Integrations include Google Analytics, Salesforce, HubSpot, Dropbox, Mailchimp, QuickBooks, Shopify, Xero, Zendesk, and Twitter.
Pros and Cons
Pros:
- Historical data access
- Wide range of visualizations
- Alert notifications for changes
Cons:
- Limited offline access
- Requires data preparation skills
- Learning curve for new users

Best for SEO tracking

AgencyAnalytics is a reporting platform tailored for digital marketing agencies and SEO professionals. It provides tools to track and report on various marketing metrics, enabling users to create comprehensive SEO reports and dashboards.
Why I picked AgencyAnalytics: AgencyAnalytics excels in SEO tracking, offering features that let you monitor keyword rankings and website performance. You can customize dashboards to fit your clients' needs, which is perfect for agencies. The platform's automated report scheduling saves you time by keeping clients updated without manual effort. It also includes white-label options, allowing you to present reports under your brand.
Standout Features & Integrations
Features include customizable dashboards that let you tailor reports to your clients' needs, automated report scheduling to save time, and white-label options for agency branding. The platform also offers detailed SEO tracking tools to monitor keyword rankings and site performance. You can easily create comprehensive reports that combine multiple data sources.
Integrations include Google Analytics, Google Ads, Facebook Ads, Instagram, Twitter, LinkedIn, Mailchimp, Shopify, Moz, and Ahrefs.
Pros and Cons
Pros:
- Automated report scheduling
- Customizable client dashboards
- Strong SEO tracking tools
Cons:
- High cost for small teams
- Not ideal for non-marketing data
- Requires initial setup time

Tableau
Best for interactive dashboards

Tableau is a business intelligence tool designed for data visualization and analytics. It's popular among data analysts and business professionals who need to create interactive dashboards and reports. The tool excels in transforming complex data into visual insights, which helps in decision-making processes.
Why I picked Tableau: Tableau offers dynamic and interactive dashboards that make data exploration intuitive. You can drag and drop data to build visualizations without needing complex coding skills. Its ability to connect to various data sources sets it apart, allowing you to pull data from almost anywhere. Tableau's focus on visualization ensures you can create detailed and informative reports that engage your audience.
Standout Features & Integrations
Features include real-time data analytics, customizable dashboards, and a wide range of visualization options. You can easily connect to live data sources, ensuring your reports are always up-to-date. The drag-and-drop interface simplifies the process of creating complex data visualizations.
Integrations include Salesforce, Microsoft Excel, Google Analytics, Amazon Redshift, SQL Server, Oracle, SAP, Hadoop, Dropbox, and Box.
Pros and Cons
Pros:
- Real-time data updates
- Wide range of visual options
- Interactive dashboard creation
Cons:
- High cost for small teams
- Requires data preparation
- Steep learning curve

Qlik
Best for data visualization

Qlik is a data analytics platform designed for businesses that need to transform raw data into visual insights. It's popular among data analysts and business intelligence professionals who require powerful visualization tools to enhance decision-making.
Why I picked Qlik: Qlik specializes in data visualization, providing interactive dashboards that allow you to explore data from multiple angles. Its associative data model lets you see connections in your data that might not be obvious otherwise. The tool's drag-and-drop interface simplifies the process of creating complex visualizations. Qlik also offers advanced analytics capabilities that help in uncovering trends and patterns.
Standout Features & Integrations
Features include an associative data engine that helps you discover hidden insights, advanced analytics that enable trend analysis, and a user-friendly interface for building visualizations. The platform supports self-service data exploration, allowing you to dive into data without needing technical expertise. You can also customize dashboards to fit your specific needs.
Integrations include Salesforce, Microsoft Azure, SAP, Oracle, Amazon Redshift, Google BigQuery, Snowflake, Microsoft SQL Server, Dropbox, and Box.
Pros and Cons
Pros:
- Supports self-service exploration
- Associative data model
- Interactive data visualization
Cons:
- Limited offline functionality
- Requires data preparation
- Steep learning curve for beginners

Best for marketing reports

Whatagraph is a reporting tool tailored for marketing teams and agencies that need to create visual data reports. It simplifies data aggregation and presentation, making it easier for marketers to share insights with clients and stakeholders. The tool is designed to turn complex data into easily digestible visual reports.
Why I picked Whatagraph: Whatagraph is ideal for marketing reports due to its ability to pull data from multiple channels into one cohesive report. You can customize templates to fit your branding and reporting needs, which is perfect for agencies. The platform offers automation features that save time by scheduling regular report updates. It also provides white-label options, allowing you to present reports as your own.
Standout Features & Integrations
Features include customizable templates that let you tailor reports to your needs, automated report scheduling to save your team time, and white-label options for agency branding. The drag-and-drop interface makes report creation straightforward. You can also access historical data for trend analysis.
Integrations include Google Analytics, Facebook Ads, Instagram, LinkedIn Ads, Twitter, Shopify, HubSpot, Mailchimp, Google Ads, and YouTube.
Pros and Cons
Pros:
- White-label options for branding
- Automated report scheduling
- Customizable report templates
Cons:
- High cost for small teams
- Not ideal for non-marketing data
- May need tech support for setup
Domo
Best for team collaboration

Domo is a cloud-based business intelligence platform that caters to large enterprises and teams needing real-time data analytics. It supports data-driven decision-making by offering a suite of tools for data visualization, reporting, and collaboration.
Why I picked Domo: Domo excels in team collaboration, providing you with tools to share data insights across your organization effortlessly. Its platform allows users to create interactive dashboards that can be accessed from any device, enhancing team communication. Domo's ability to handle vast amounts of data and deliver insights in real-time is beneficial for large teams. It also offers customizable alerts to keep your team informed about critical changes.
Standout Features & Integrations
Features include real-time data updates that keep your team informed, customizable dashboards that cater to specific needs, and mobile access for on-the-go insights. The platform's drag-and-drop interface simplifies dashboard creation. Domo also offers predictive analytics to help you anticipate future trends.
Integrations include Salesforce, Google Analytics, Slack, Shopify, Amazon Redshift, Snowflake, Microsoft Excel, Box, Dropbox, and Twitter.
Pros and Cons
Pros:
- Predictive analytics capabilities
- Custom alerts for changes
- Mobile access for dashboards
Cons:
- Complex for non-technical users
- High cost for smaller teams
- High learning curve for new users

Best with retroactive data transformation
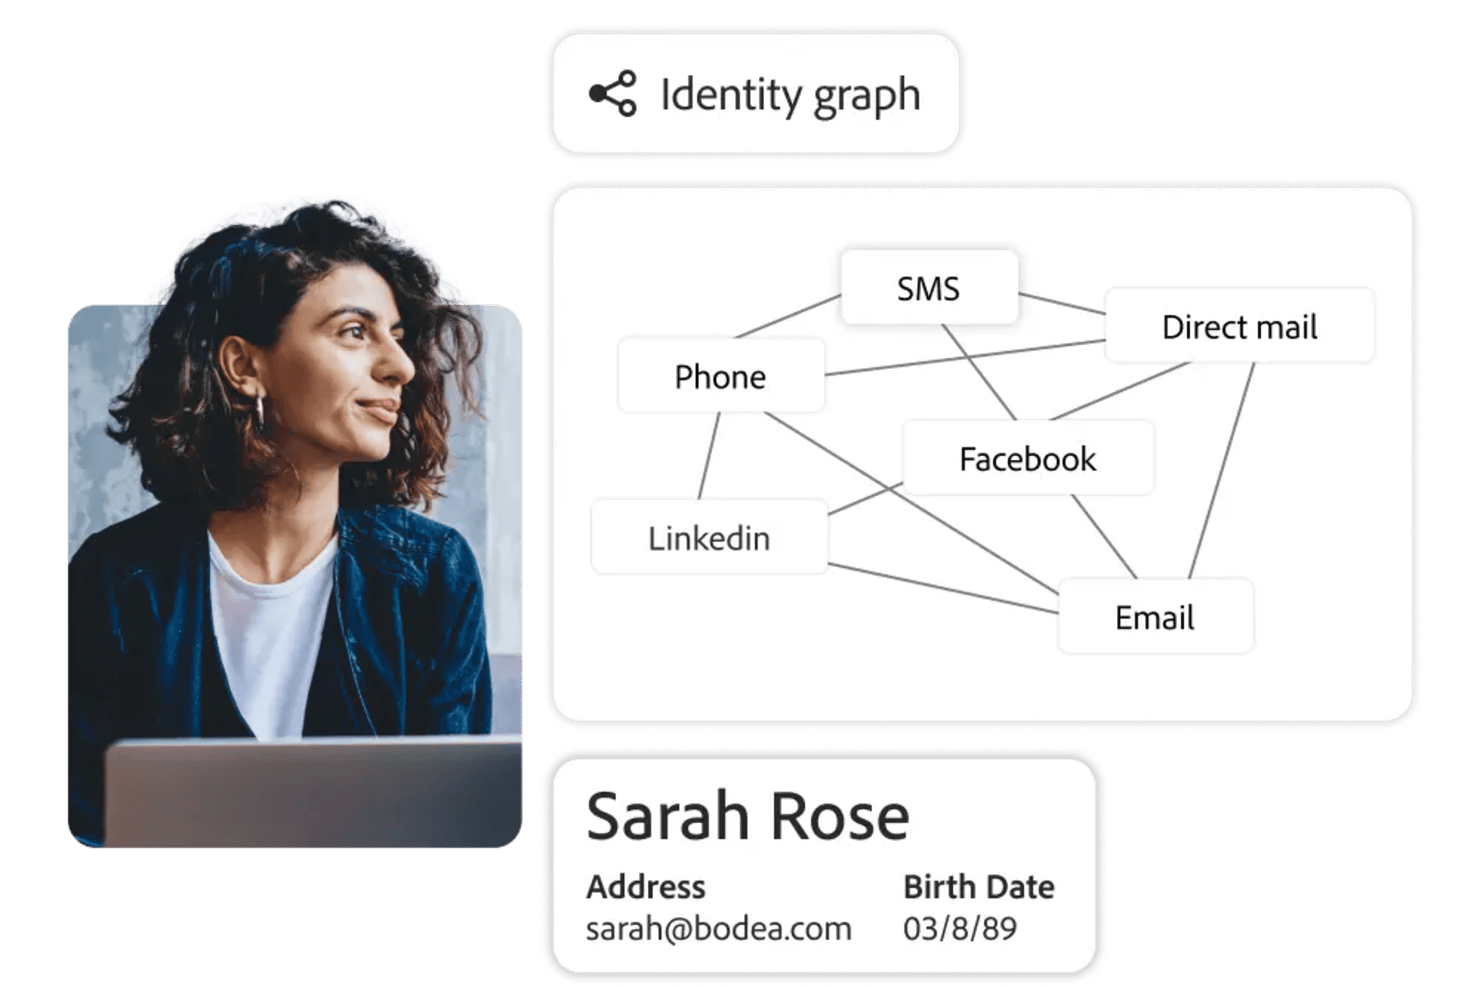
Adobe Customer Journey Analytics is an AI-powered analytics platform for tracking, visualizing, and reporting on customer journeys across multiple channels and data sources.
Who Is Adobe Customer Journey Analytics Best For?
Enterprise analytics teams in retail, finance, or media who need to unify and analyze customer data from multiple digital channels.
Why I Picked Adobe Customer Journey Analytics
I picked Adobe Customer Journey Analytics as one of the best because I can retroactively transform and reprocess historical data without losing fidelity. My team uses the data model editor to redefine dimensions and metrics after data collection, which lets us answer new business questions as they come up. I also like that we can apply new rules or segmentations to past data, so we’re not locked into decisions made at the time of implementation.
Adobe Customer Journey Analytics Key Features
- AI-powered anomaly detection: Automatically surfaces unexpected trends and outliers in your data.
- Cross-channel data stitching: Combines data from web, mobile, and offline sources into unified customer journeys.
- Custom dashboard builder: Lets you create and share interactive dashboards tailored to your reporting needs.
- Scheduled report delivery: Sends automated reports to stakeholders on a recurring schedule.
Adobe Customer Journey Analytics Integrations
Adobe Customer Journey Analytics offers native integrations with Adobe Experience Platform, Adobe Analytics, Adobe Target, Adobe Audience Manager, and Adobe Campaign. It also provides an API for custom integrations and supports connections to cloud data warehouses like Google BigQuery, Amazon Redshift, and Snowflake.
Pros and Cons
Pros:
- Advanced privacy and consent management controls
- Real-time segmentation updates as data streams in
- Retroactive data transformation for historical analysis
Cons:
- Complex setup for cross-channel data sources
- Limited native integrations outside Adobe ecosystem

Power BI
Best for Microsoft integration

Power BI is a business analytics tool designed for transforming raw data into actionable insights. It's widely used by business analysts and IT professionals who need to create reports and dashboards. The tool is known for its integration with Microsoft products, making it easy for teams already using Microsoft Office.
Why I picked Power BI: Power BI integrates smoothly with Microsoft Office applications, which is ideal if your team relies heavily on tools like Excel and SharePoint. This integration allows you to pull and analyze data directly from these sources without extra steps. Power BI's data modeling capabilities enable you to create detailed reports tailored to your needs. The tool's ability to handle large datasets ensures you can analyze your data efficiently.
Standout Features & Integrations
Features include a user-friendly interface that allows for quick report creation, data visualization options that cater to different analysis needs, and the ability to share insights across your organization. The tool offers a drag-and-drop functionality that simplifies the process of building dashboards. You can also customize your reports to match your specific requirements.
Integrations include Microsoft Excel, SharePoint, SQL Server, Azure, Dynamics 365, Google Analytics, Salesforce, Adobe Analytics, OneDrive, and GitHub.
Pros and Cons
Pros:
- Frequent updates and improvements
- Strong data modeling featuresc
- Handles large datasets
Cons:
- Requires data preparation skills
- Complex for non-technical users
- Requires Microsoft account


Rollstack is a platform that automates the creation and updating of presentations and documents, primarily serving data analysts and business teams. It enhances productivity by connecting to live data sources and offering AI-powered insights, making it suitable for various industries like finance and healthcare.
Why I picked Rollstack: Rollstack excels in automated reporting, saving users substantial time by reducing manual slide creation. It connects to multiple data sources, ensuring your presentations are always up-to-date. The platform's AI capabilities help analyze data for more informed decision-making. It also provides enterprise-grade security to protect your data.
Standout Features & Integrations
Features include live data connectivity that keeps your documents current, AI insights that improve data analysis, and enterprise-grade security to protect sensitive information. Scheduled updates ensure your presentations are always ready when you need them. The platform's user-friendly interface simplifies the reporting process.
Integrations include Tableau, Power BI, Looker, Metabase, Google Sheets, Microsoft Excel, Google Slides, Microsoft PowerPoint, Slack, and Dropbox.
Pros and Cons
Pros:
- Enhances data analysis
- Keeps data live and updated
- Reduces manual slide creation
Cons:
- Not ideal for small datasets
- May need tech support for setup
- Learning curve for beginners
Diğer Yapay Zekâ Raporlama Araçları
\u003cspan style=\u0022font-weight: 400\u0022\u003eKısa listeme giremeyen ancak yine de göz atmaya değer bazı ek yapay zekâ raporlama aracı seçenekleri şunlardır:\u003c/span\u003e
- Zoho Analytics
For small businesses
- Heap (by Contentsquare)
For user behavior analytics
- Venngage
For infographic creation


How I Evaluate Loyalty Management Software
I evaluate loyalty platforms on two layers: core functionality every tool must have—like earn/burn rules and omnichannel enrollment—and the differentiators that separate the best options.
Core Functionality (Table Stakes For This List)
When I'm selecting tools for my list, I rank each one on a scale from 0 (does not offer the functionality) to 5 (excels in this area) for each core functionality listed below. Then, I calculate the tool's total score into a percentage. Each tool needs to achieve a minimum total score of 65% to be considered for inclusion.
- Program & Rules Engine: I look for configurable earn-and-burn logic, tiered structures, and behavioral triggers that a loyalty manager can set up without filing dev tickets every time they want to reward a new action.
- Rewards & Redemption Management: The reward catalog should cover points, discounts, gift cards, and partner offers with redemption flows that work across both online checkout and in-store POS.
- Member Profiles & Segmentation: Unified member records matter here—I check whether profiles consolidate transaction history, tier status, and points balances into segments you can actually target with campaigns.
- Omnichannel Enrollment & Engagement: Members sign up through web, app, POS, and email, so I evaluate how each platform handles identity resolution to prevent duplicate accounts across those touchpoints.
- Integrations & APIs: Prebuilt connectors for ecommerce platforms like Shopify and Magento, plus CRM and ESP sync, determine how well the tool fits into an existing marketing stack without custom middleware.
- Analytics & Reporting: I look for dashboards that go beyond enrollment counts to show redemption rates, repeat purchase lift, and segment-level ROI so you can actually prove program value to leadership.
- Referral & Advocacy Tools: Referral mechanics like trackable invite links, configurable reward structures for both referrer and referee, and social sharing options extend the program's reach beyond your existing member base.
- Fraud Prevention & Compliance: Points abuse detection, expiration management, and built-in GDPR/CCPA compliance tools protect both your program economics and your customer data.
Once I have a list of tools that meet this criteria, I consider what sets each platform apart.
Differentiating Factors (What Sets Vendors Apart)
Here's how I compare and contrast different vendors:
Standout Features
Gamification mechanics like challenges, badges, and progress bars give members a reason to engage between purchases—I evaluate whether these elements are built in or require third-party workarounds. Rewarding non-transactional behaviors such as writing reviews or completing profile fields deepens engagement beyond spend-based programs. I also look for AI-powered reward recommendations that surface the right offer to the right member based on predicted behavior, helping retention marketers move past one-size-fits-all promotions.
Beyond Features
Pricing structure matters a lot in this space—some platforms charge per member while others bill on transactions or GMV, so I evaluate how costs scale as your program grows. Industry fit is another factor I weigh, since a platform proven in DTC ecommerce may lack the coalition program support a multi-brand retailer needs. Time-to-launch also varies widely; I check whether vendors offer pre-built templates and dedicated onboarding support to get a program live in weeks rather than months.
Yapay Zekâ Raporlama Aracı Nasıl Seçilir?
Uzun özellik listeleri ve karmaşık fiyatlandırma yapıları arasında kaybolmak kolaydır. Kendinize özgü yazılım seçim sürecinizde ilerlerken odaklanmanıza yardımcı olmak için göz önünde bulundurmanız gereken faktörleri aşağıda bir kontrol listesi hâlinde bulabilirsiniz:
| Faktör | Dikkat Edilmesi Gerekenler |
|---|---|
| Ölçeklenebilirlik | Araç işletmenizle birlikte büyüyebilir mi? Şirketiniz büyüdükçe artan veri hacmini ve kullanıcı sayısını işleyip işleyemeyeceğini değerlendirin. |
| Entegrasyonlar | Mevcut sistemlerinizle çalışıyor mu? Veri silolarını ve manuel veri girişini önlemek için mevcut yazılımlarınıza kolayca bağlanıp bağlanmadığını değerlendirin. |
| Özelleştirilebilirlik | İhtiyaçlarınıza göre uyarlayabilir misiniz? Gösterge panellerini ve raporları ekibinizin iş akışına ve tercihlerine uygun şekilde özelleştirme seçenekleri arayın. |
| Kullanım kolaylığı | Kullanıcı dostu mu? Arayüzün sezgisel olup olmadığını kontrol edin; bu, ekibinizin öğrenme sürecini kısaltır ve hızlı benimsemeyi mümkün kılar. |
| Uygulama ve işe alıştırma | Ne kadar hızlı başlayabilirsiniz? Kurulum ve eğitim için gereken zaman ile kaynakları göz önünde bulundurun. Rehberli işe alıştırma süreçleri sunan araçları tercih edin. |
| Maliyet | Bütçeniz dâhilinde mi? Fiyatlandırma planlarını karşılaştırın ve gizli ücretleri kontrol edin. Aracın ihtiyaç duyduğunuz özellikler için iyi bir değer sunduğundan emin olun. |
| Güvenlik önlemleri | Verileriniz ne kadar güvende? Aracın veri koruma standartlarına uyduğundan ve bilgilerinizi korumak için şifreleme ile erişim denetimleri sunduğundan emin olun. |
| Destek erişilebilirliği | Gerektiğinde yardım alabilir misiniz? Kolayca erişilebilen destek kanalları arayın ve incelemelere göre müşteri hizmetlerinin kalitesini değerlendirin. |
Yapay Zekâ Raporlama Araçları Nedir?
AI raporlama araçları, verilerin görsel bir biçimde toplanmasını, analiz edilmesini ve sunulmasını otomatikleştiren yazılım çözümleridir. Büyük veri kümelerini hızlı bir şekilde işleyerek, kalıpları belirleyerek ve içgörüler oluşturarak yardımcı olurlar. Bu otomasyon, manuel çalışmayı azaltır ve ekibinizin veri işlemek yerine stratejik kararlara odaklanmasını sağlar.
AI raporlama araçları genellikle veri analistleri, işletme yöneticileri ve pazarlama profesyonelleri tarafından bilinçli kararlar almak için kullanılır. Bu araçların özellikleri arasında gerçek zamanlı veri güncellemeleri, özelleştirilebilir panolar ve otomatik raporlama bulunur. Bunlar, kullanıcıların karmaşık verileri hızlı ve verimli bir şekilde anlamasına yardımcı olur.
Genel olarak bu araçlar, daha iyi karar almayı destekleyen ve işletme sonuçlarını iyileştiren değerli içgörüler sağlar.
AI Raporlama Araçlarının Özellikleri
AI raporlama araçlarını seçerken aşağıdaki temel özelliklere dikkat edin:
- Veri görselleştirme: Karmaşık verileri anlaşılması kolay görsellere dönüştürerek kullanıcıların içgörüleri hızlı bir şekilde kavramasına yardımcı olur.
- Gerçek zamanlı güncellemeler: Kararların en güncel bilgilere dayanmasını sağlamak için anlık veriler sunar.
- Özelleştirilebilir panolar: Kullanıcıların panoları belirli ihtiyaçlarına ve tercihlerine göre uyarlamasına olanak tanıyarak kullanılabilirliği artırır.
- Otomatik raporlama: Raporları otomatik olarak oluşturarak zaman kazandırır ve manuel çalışmayı azaltır.
- Entegrasyon özellikleri: Mevcut yazılım sistemlerine bağlanarak veri akışını kolaylaştırır ve manuel veri girişini azaltır.
- Tahmine dayalı analiz: Gelecekteki eğilimlerle ilgili içgörüler sunarak kullanıcıların değişiklikleri öngörmesine ve proaktif kararlar almasına yardımcı olur.
- Güvenlik önlemleri: Verileri şifreleme ve erişim denetimleriyle koruyarak hassas bilgilerin güvende kalmasını sağlar.
- Kullanıcı dostu arayüz: Gezinmeyi kolaylaştırır ve öğrenme süresini kısaltarak ekiplerin aracı daha hızlı benimsemesini sağlar.
- Özel markalama seçenekleri: Kullanıcıların raporları kendi markalarıyla sunmasına olanak tanır; bu özellik özellikle müşterilere sunum yapan ajanslar için kullanışlıdır.
- Uyarı bildirimleri: Ekipleri önemli değişikliklerden haberdar ederek kritik veri değişimlerine hızlı yanıt verilmesini sağlar.
AI Raporlama Araçlarının Faydaları
AI raporlama araçlarını uygulamak ekibiniz ve işletmeniz için çeşitli faydalar sağlar. Yararlanabileceğiniz birkaç fayda şunlardır:
- Daha iyi karar alma: Gerçek zamanlı verilere ve tahmine dayalı analizlere erişim, ekibinizin hızlı bir şekilde bilinçli seçimler yapmasına yardımcı olur.
- Zaman tasarrufu: Otomatik raporlama manuel çalışmayı azaltarak daha stratejik görevler için zaman kazandırır.
- Geliştirilmiş veri doğruluğu: Entegrasyon özellikleri platformlar arasında veri tutarlılığı sağlayarak hataları en aza indirir.
- Artan iş birliği: Özelleştirilebilir panolar ve paylaşılan içgörüler ekip çalışmasını teşvik eder ve hedefleri uyumlu hâle getirir.
- Daha iyi veri güvenliği: Güvenlik önlemleri hassas bilgileri koruyarak veri gizliliği konusunda içinizin rahat olmasını sağlar.
- Daha fazla esneklik: Kullanıcı dostu arayüzler ve özelleştirilebilir özellikler, aracı özel ihtiyaçlarınıza uyarlamanıza olanak tanır.
- Marka tutarlılığı: Özel markalama seçenekleri raporları markanız altında sunmanıza ve müşterileriniz karşısında profesyonel imajınızı korumanıza olanak tanır.
AI Raporlama Araçlarının Maliyetleri ve Fiyatlandırması
AI raporlama araçlarını seçmek, mevcut çeşitli fiyatlandırma modellerinin ve planların anlaşılmasını gerektirir. Maliyetler özelliklere, ekip büyüklüğüne, eklentilere ve diğer unsurlara göre değişir. Aşağıdaki tablo, AI raporlama aracı çözümlerinde yaygın planları, bunların ortalama fiyatlarını ve genellikle sunulan özellikleri özetlemektedir:
AI Raporlama Araçları için Plan Karşılaştırma Tablosu
| Plan Türü | Ortalama Fiyat | Yaygın Özellikler |
|---|---|---|
| Ücretsiz Plan | $0 | Temel raporlama, sınırlı panolar ve standart destek. |
| Kişisel Plan | $10-$30/kullanıcı/ay | Özelleştirilebilir panolar, e-posta desteği ve temel veri entegrasyonu. |
| İşletme Planı | $50-$100/ kullanıcı/ay | Gelişmiş analiz, ekip iş birliği özellikleri ve öncelikli destek. |
| Kurumsal Plan | $150-$300/ kullanıcı/ay | Tam veri entegrasyonu, özel hesap yöneticisi ve gelişmiş güvenlik özellikleri. |
Yapay Zekâ Raporlama Araçları SSS
Yapay zekâ raporlama araçları hakkında sık sorulan bazı soruların yanıtlarını burada bulabilirsiniz:
Bir yapay zekâ aracı kullanmadan önce nelere dikkat etmelisiniz?
Bir yapay zekâ aracı kullanmadan önce özel işletme ihtiyaçlarınızı ve veri kaynaklarınızı göz önünde bulundurun. Aracın mevcut sistemlerinizle iyi bir şekilde entegre olduğundan ve veri güvenliği standartlarına uygun olduğundan emin olun. Ekibinizin aracı etkili bir şekilde benimsemesine yardımcı olacak öğrenme sürecini ve mevcut desteği değerlendirin.
Yapay zekâ rapor doğruluğunu nasıl iyileştirebilir?
Yapay zekâ, veri işleme ve analizindeki insan hatalarını en aza indirerek rapor doğruluğunu artırır. Verilerdeki tutarsızlıkları ve anormallikleri belirlemek için algoritmalar kullanır ve böylece daha güvenilir çıktılar elde edilmesini sağlar. Bu doğruluk, ekibinizin sağlam verilere dayanarak daha bilinçli kararlar almasına yardımcı olur.
Yapay zekâ raporlama araçlarının sınırlamaları nelerdir?
Yapay zekâ raporlama araçları, veri kalitesine ve kullanılabilirliğine olan bağımlılıkları nedeniyle sınırlı olabilir. Veriler eksik veya hatalıysa oluşturulan içgörüler de kusurlu olabilir. Ayrıca bu araçlar, teknik bilgisi olmayan kullanıcılar için karmaşık olabilecek önemli miktarda ilk kurulum ve entegrasyon çalışması gerektirebilir.
Yapay zekâ raporlama araçları veri güvenliğini nasıl ele alır?
Yapay zekâ raporlama araçları, şifreleme, erişim kontrolleri ve veri koruma düzenlemelerine uyumluluk uygulayarak veri güvenliğini sağlar. Hassas bilgilerinizi yetkisiz erişimden veya veri ihlallerinden korumak için seçtiğiniz aracın güçlü güvenlik önlemlerine sahip olduğundan emin olun.