

2026’da Daha İyi Kararlar İçin En İyi 10 İş Zekâsı Aracı

10 En İyi BI Araçları Kısa Listesi


İş zekâsı araçları; bilgileri bir araya getirerek, eğilimleri görselleştirerek ve daha akıllı karar alma süreçlerini destekleyerek ekiplerin ham verileri eyleme geçirilebilir içgörülere dönüştürmesine yardımcı olur. İster KPI'ları takip ediyor, ister müşteri davranışlarını analiz ediyor, ister geliri tahmin ediyor olun, doğru BI aracı büyümeyi destekleyen ve kuruluşunuz genelinde performansı artıran kalıpları ortaya çıkarabilir.
Doğru platformu seçmenize yardımcı olmak için önde gelen iş zekâsı araçlarını veri entegrasyonu özellikleri, gösterge paneli işlevleri, kullanım kolaylığı ve ölçeklenebilirlik temelinde test edip inceledim. Bu kılavuz, 2026 yılında kullanılabilen en iyi BI araçlarını öne çıkararak ekibinizin veri ihtiyaçlarını karşılayan ve stratejik karar alma süreçlerini destekleyen bir araç bulmanıza yardımcı olur.
İş Zekâsı Araçları Nedir?
İş zekâsı araçları, kuruluşların daha akıllı ve veriye dayalı kararlar almasına yardımcı olmak için verileri toplayan, analiz eden ve görselleştiren yazılım uygulamalarıdır.
Veritabanları, elektronik tablolar ve bulut hizmetleri gibi kaynaklardaki bilgileri etkileşimli gösterge panelleri ve raporlarda bir araya getirirler. Gerçek zamanlı analiz, veri görselleştirme ve raporlama gibi özelliklerle BI araçları, ham verileri departmanlar genelindeki ekipler için eyleme geçirilebilir içgörülere dönüştürür.
Why Trust Our Software Recommendations
Our team has been testing and reviewing software since 2012. As project managers ourselves, we know how difficult—and important—it is to choose the right software.
For this guide, we evaluated tools using hands-on testing and independent research, scoring tools using our selection criteria. We also draw on insights from industry thought leaders and practicing project management experts.
Our reviews reflect our human editorial judgment, not a sales pitch.
Expert reviewers:
İş Zekâsı Araçları Karşılaştırma Tablosu
İhtiyaçlarınıza en uygun BI aracını bulmak için aşağıdaki tabloyu kullanabilirsiniz:
| Tool | Starting Price | Website | |
|---|---|---|---|
| Best business intelligence tool for small companies | 4.3 out of 5 | $30/month 15-day free trial | Website |
| Best enterprise business intelligence tool | 4.5 out of 5 | Pricing upon request 14-day free trial | Website |
| Best database BI reporting tool | 4.4 out of 5 | Pricing upon request Free trial + free demo available | Website |
| Best for sharing analytics with external vendor portals | 4.4 out of 5 | Pricing upon request 30-day free trial | Website |
| Best business intelligence API for building analytics into your products and tools | 4.4 out of 5 | Pricing upon request 7-day free trial | Website |
| Best for integrating over 150 data sources | 4.4 out of 5 | $39/user/month Free trial available | Website |
| Best for real-time cross-channel journey mapping | 4.3 out of 5 | Pricing upon request Free trial available | Website |
| Best for building and embedding dashboards in your applications | 4.4 out of 5 | $265/month Free trial + free demo available | Website |
| Best for Jira integration & custom views | 4.6 out of 5 | $18/user/month Free plan available | Website |
| Best business intelligence solution for Microsoft users | — | $14/user/month Free plan available | Website |
En İyi İş Zekâsı Araçlarına Genel Bakış
Bunlar, şu anda piyasadaki en iyi BI araçlarına genel bakışlardır:

Best business intelligence tool for small companies

Zoho Analytics is a great business intelligence tool for small businesses, given their large feature set, simple interface, and affordable pricing for a small number of users. For one tour operator managing 17 multi-day trips, Zoho Analytics proved invaluable: “I have used Zoho Analytics to monitor guide performance, guest ratings and trip logistics on all our 17 multi-day tours. Zoho Analytics assisted me in revealing the trends of guest behavior and trip flow in the rural areas. It allowed us to reduce overtime by monitoring inefficiencies that we could not see on spreadsheets.”
This tool lets you pull data from a wide range of sources and build out intuitive and functional reports in order to analyze the visualized data. AI assistant “Zia” will answer questions typed into a query box using the data collected, combined with machine learning and natural language processing technologies.
Zoho Analytics takes the prize for my favorite in features and functionality. While most of the software reviewed here can sport a robust BI system, Zoho goes above and beyond with features like their AI assistant, their focus on ease of collaboration, tons of third party integration options, and Android and iOS mobile apps.
A few minor cons for Zoho include that the SQL tutorials could be built out a little bit better. Additionally, the reporting pivot view/summaries would benefit from having an “OR” or “CONTAINS” command in order to better pull out the data that you need.
They have integrations with Zoho Analytics, SAlesforce CRM, Microsoft Dynamics CRM, Hubspot CRM, Mailchimp, Google Analytics, Bing Ads, Zoho Surveys, Survey Monkey, Facebook, TWitter, YouTube,QuickBooks, Xero, Shopify, Zendesk, and more.
Zoho Analytics starts from $24/month for 2 users and has a free 15-day trial.
New Product Updates from Zoho Analytics

Zoho Analytics Adds Exogenous Variables to Multivariate Forecasting
Zoho Analytics introduces exogenous variables for multivariate forecasting using the VARX model. This helps forecasts account for external drivers such as marketing spend, discounts, and seasonality. For more information, visit Zoho Analytics’ official site.
 .

Tableau
Best enterprise business intelligence tool

Tableau is a robust, scalable analytics platform with desktop, cloud, or on-site options. It boasts an interactive, visual analysis style and allows you to securely consume your data via browser, desktop, mobile, or embedded into any application. They offer over 900 learning resources, including over 100 training videos. For Gianluca Ferruggia, General Manager at DesignRush, Tableau’s impact was immediate: “Tableau transformed our unrefined data into graphic stories, its drag-and-drop dashboards changed the game by enabling us to see trends our spreadsheets were hiding.”
They excel in a specific area of the features and functions evaluations criteria section: flexibility. Tableau is easily scalable; offered by server, desktop and/or cloud; available on all device types, be it PC or smartphone; and they have free analytics resources for students, educators and smaller not-for-profits. Whatever your niche, you are sure to find something that fits.
Tableau can join with data collection systems like ServiceNow, Splunk, and Google Analytics. Other integrations, or “Technology Partners as they call them, include 0xdata, AIMMS, Aircloak, AllSight, Amazon Web Services, Astera, Axiomatics, Birst, Datawatch,
Element Analytics, Google Cloud Platform, IBM, Microsoft, and many, many more.
The pricing is a bit steep to begin with and costs go up at the end of the year long contract. Multi-year contracts are not available, so they got dinged in our value for cost section because of the high and shifting price schema, which can come across as predatory.
Tableau starts at $70/user/month and has a free 14-day trial.

Looker
Best database BI reporting tool

Create easy-to-read reports and visual-oriented interactive dashboards that display data-rich actionable insight for defining business metrics, locating value, and discovering interconnectivity between tables. Resources and features include custom applications, embedded visualizations, data science workflows, the ability to host on Public Clouds (like AWS and GCP), and more. For Amit Chandak, Chief Analytics Officer at Kanerika Inc, Looker proved to be a powerful solution for client data challenges: “We used Looker to deliver real-time, trusted insights for a client struggling with fragmented data—once implemented, reporting speed improved by 50% and decision-making accelerated significantly thanks to clear, actionable dashboards.”
They offer a free interactive training course and many other tutorial-like resources, which is why I was able to score them so highly in the usability section of the evaluation criteria. Beneath the “Getting Started” tab, you’ll notice that they have plenty of self-help resources for viewing raw data, building tools, and developing models.
The downfall of this software is that writing the queries is not incredibly user friendly. On top of that, data analytics tasks take a significant amount of time to render and run queries. When it comes to big data, it may get sluggish.
They connect with databases from Redshift, Snowflake, BigQuery, as well as 50+ supported SQL dialects like Amazon Redshift, Google BigQuery, Snowflake, MySQL, Oracle, Amazon Athena, Amazon Aurora, and more.
Looker starts at $3,000/month for 10 users ($50/additional user) and has a free demo.
Domo
Best for sharing analytics with external vendor portals
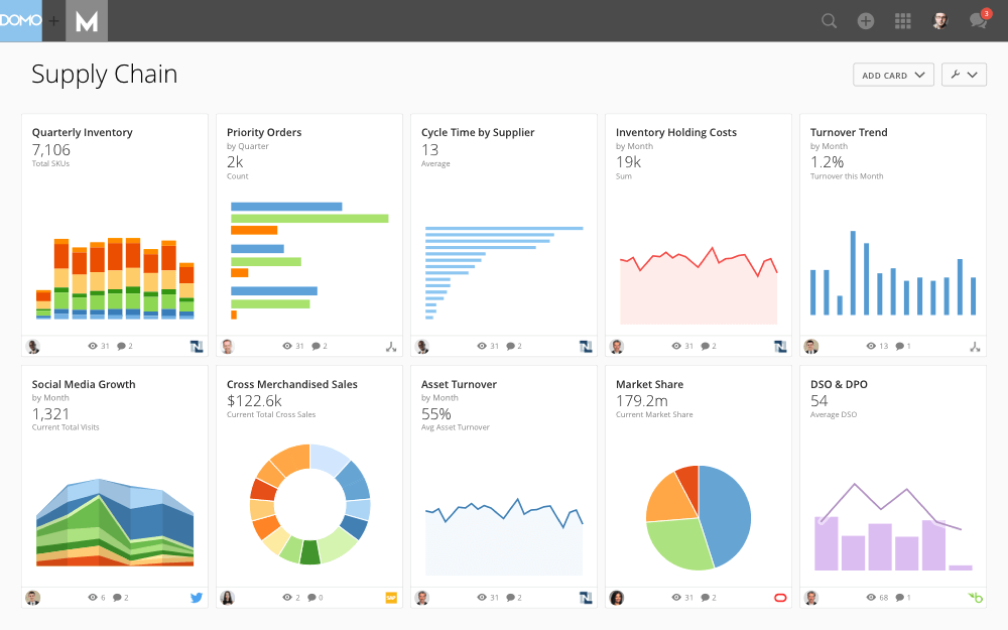
The Domo Business Cloud is a platform that lets you aggregate data from multiple sources and build custom workflow apps. Their features include dashboards and reporting, machine learning, predictive analytics, and external self-service reporting. For many organizations, Domo’s ability to step in when other tools fall short is a major advantage. Nicola Leiper, the Director and Head of Project Management at Espresso Translations, shared her experience: “Excel crashed and Domo rescued our largest customer relationship. Domo not only organized our data but saved our reputation and exposed some of the underperforming parts of our operations that cost us thousands.”
I like the focus that Domo places on your external relationships with vendors and other stakeholders. The name is Domo Everywhere, and it’s a feature that lets you build portals for your external partners. Therefore, they can analyze the data you decide to share with them on their own and draw their own insights.
Further, the data visualization boards are independent widgets that can be edited, filtered, and resized with a couple of clicks. Lastly, the platform allows you to set permissions on both internal and external users, regardless of the account (Domo or not Domo).
Domo integrates with external data sources through their 1000+ pre-built connectors, which include Shopify, Salesforce, Amazon S3, Adobe Analytics, Sharepoint, and Survey Monkey.
Domo has a free trial available, and prices can be quoted upon request.

Sisense
Best business intelligence API for building analytics into your products and tools

A hybrid-cloud platform built to leverage all of your data together and make it available to you through interactive dashboards, self-service analytics, and/or white-labeled BI apps. They offer support, analytics, and reporting for business areas such as customer service measurables, digital marketing, finances, human resources, retail and eCommerce, IT analytics, and more.
As far as our usability and UI evaluation criteria expectations, I found that Sisense is easy to use, easy to instal and setup, and sports an intuitive interface and streamlined UX. The customer service team is responsive and adaptive so this would be a decent choice for companies with lower levels of technology experience who might need some extra assistance.
A few cons include that the marketing connector could be more robust. Also, some functions are so simplified that they get in the way, for example not having to write a query seems like a time saving mechanism until your needs don’t match their pre-existing data and you have to jump through hoops to find a creative solution to get what you need.
Use ODBC to connect directly to Sisense’s powerful back-end from any third party application you like, from Excel to popular data visualization and reporting tools. They also offer a marketplace for extensions and plug-ins that they or their partners provide for use. Some are available free and others are only available with a premium account.
Sisense offers custom pricing and has a free demo as well as a free trial.

Best for integrating over 150 data sources

Supermetrics is a powerful data integration tool that simplifies the collection and analysis of marketing data, making it an essential resource for business intelligence (BI). By enabling users to aggregate data from over 150 different sources, including major platforms like Google Ads, Facebook Ads, and LinkedIn Ads, Supermetrics ensures that businesses can compile comprehensive datasets for more informed decision-making. For example, Baris Zeren, CEO of Bookyourdata, explained how impactful the platform has been for his team: “Supermetrics has made reporting easier because it automatically pulls data on marketing and sales into one dashboard. It is unique in that it saved the team hours per week and provided us with a cohesive and consistent perspective on campaign efficacy.”
One of the standout features of Supermetrics as a BI tool is its automation capabilities. Users can set up automated data transfers, which ensure that their reports are always populated with the latest data without manual intervention. This automation extends to the scheduling of regular data imports,
Supermetrics also offers robust data transformation options. Users can filter, combine, and modify data before it reaches its final destination, allowing for customized reports that meet specific business requirements. These transformation capabilities are critical for BI, as they enable businesses to tailor their data to uncover precise insights and trends. The tool’s compatibility with leading BI platforms such as Google Data Studio and Power BI further enhances its utility, allowing for sophisticated data visualization and analysis.
Additionally, Supermetrics supports a wide array of integrations with various marketing and sales platforms, like Google Analytics, HubSpot, Shopify, and Salesforce, ensuring that all relevant data can be consolidated into a single source of truth.

Best for real-time cross-channel journey mapping
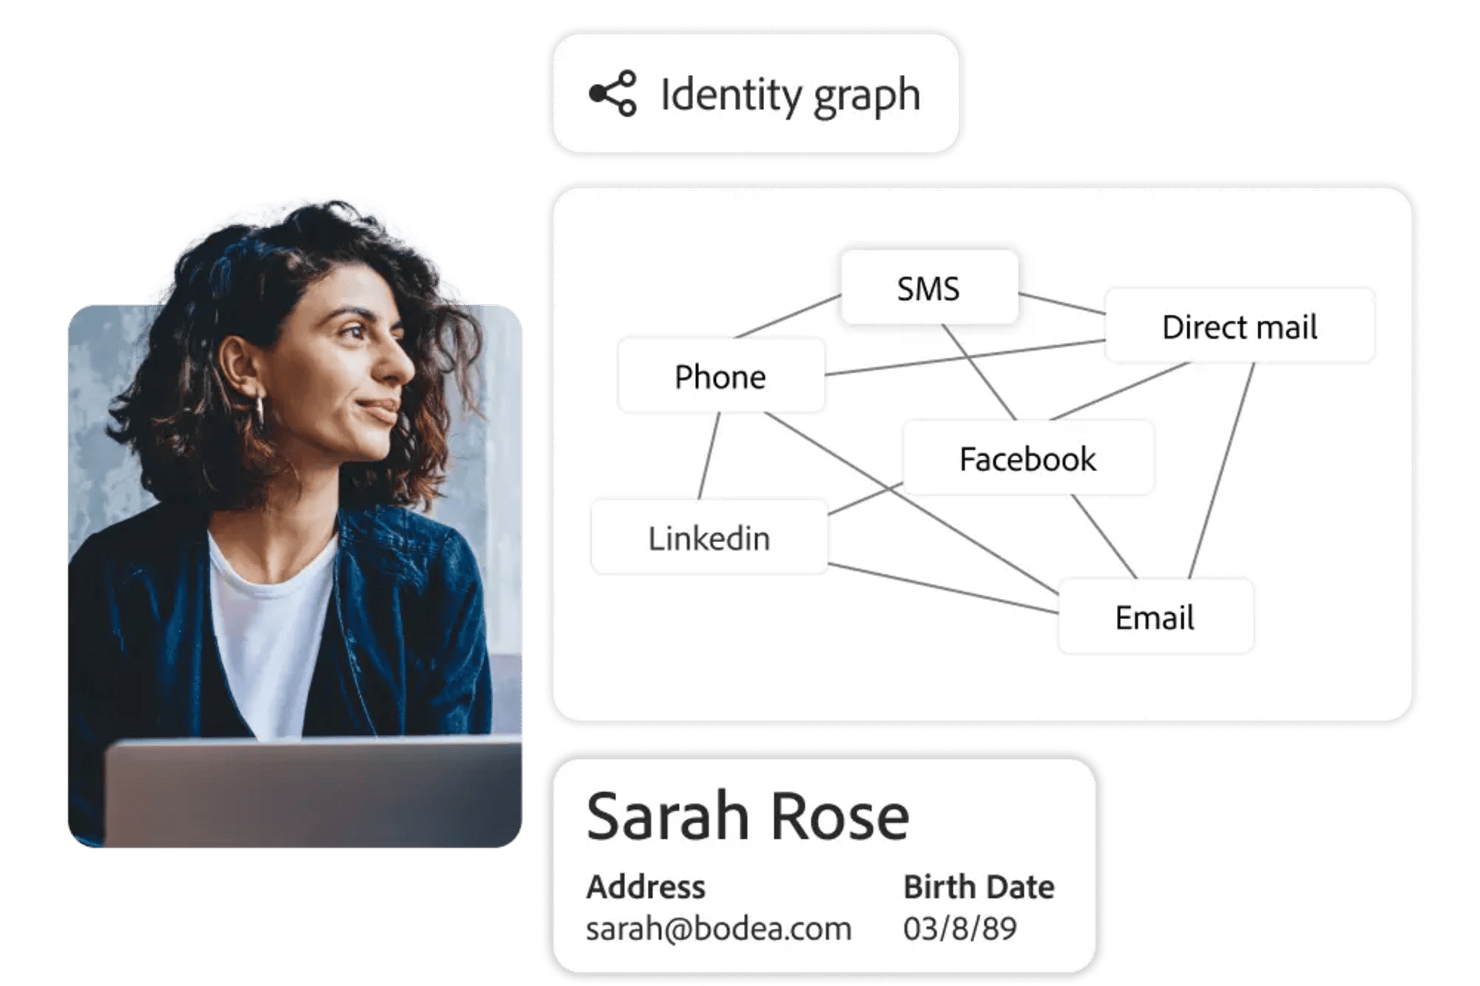
Adobe Customer Journey Analytics is a business intelligence tool that lets you analyze and visualize customer journeys across multiple channels using real-time data, customizable dashboards, and advanced analytics features.
Who Is Adobe Customer Journey Analytics Best For?
Marketing and analytics teams at large enterprises who need to analyze complex, multi-channel customer journeys.
Why I Picked Adobe Customer Journey Analytics
I picked Adobe Customer Journey Analytics as one of the best because I can map customer journeys across web, mobile, and offline channels in real time. I use its visual flow analysis to see how users move between touchpoints and spot drop-off points instantly. My team relies on its unified data model to blend data from multiple sources, so we always have a complete view of the customer experience.
Adobe Customer Journey Analytics Key Features
- Customizable dashboards: Build interactive dashboards to visualize and share key metrics with your team.
- Advanced segmentation: Create granular audience segments based on behavior, demographics, or custom criteria.
- Scheduled reporting: Automate report delivery to stakeholders on a set schedule.
- Data connectors: Import and unify data from CRM, ecommerce, and other external systems.
Adobe Customer Journey Analytics Integrations
Adobe Customer Journey Analytics offers native integrations with Adobe Experience Platform, Adobe Analytics, Adobe Target, Adobe Audience Manager, and Adobe Campaign. It also provides an API for custom integrations and supports connections to external data sources through Adobe Experience Platform connectors.
Pros and Cons
Pros:
- Flexible calculated metrics and custom data views
- Deep integration with Adobe Experience Platform
- AI-powered anomaly detection and root cause analysis
Cons:
- Advanced features may require technical expertise
- Limited native integrations outside Adobe products

ClicData
Best for building and embedding dashboards in your applications

ClicData is a data aggregation platform with over 250 connectors. This allows you to bring data from anywhere in the company. After, a data warehouse stores that information and makes it available for you to design real-time dashboards.
The last step is for you to design your dashboard. ClicData's dashboard designer has a drag-and-drop functionality that makes it easy to build your data visualizations. Add elements like annotations, Gauges, maps, audio, tables, and any graph you can think of. After that, you can embed your charts in a website, portal or ERP using its API.
Although the platform does not offer any out-of-the-box, prebuilt integrations, its API is available for your IT team to do it. The API enables integrated software to send information to ClicData as soon as it’s received, so you can always see real-time updated information.
ClicData paid plans start at $75/month and offer a 15-day free trial.

Visor
Best for Jira integration & custom views
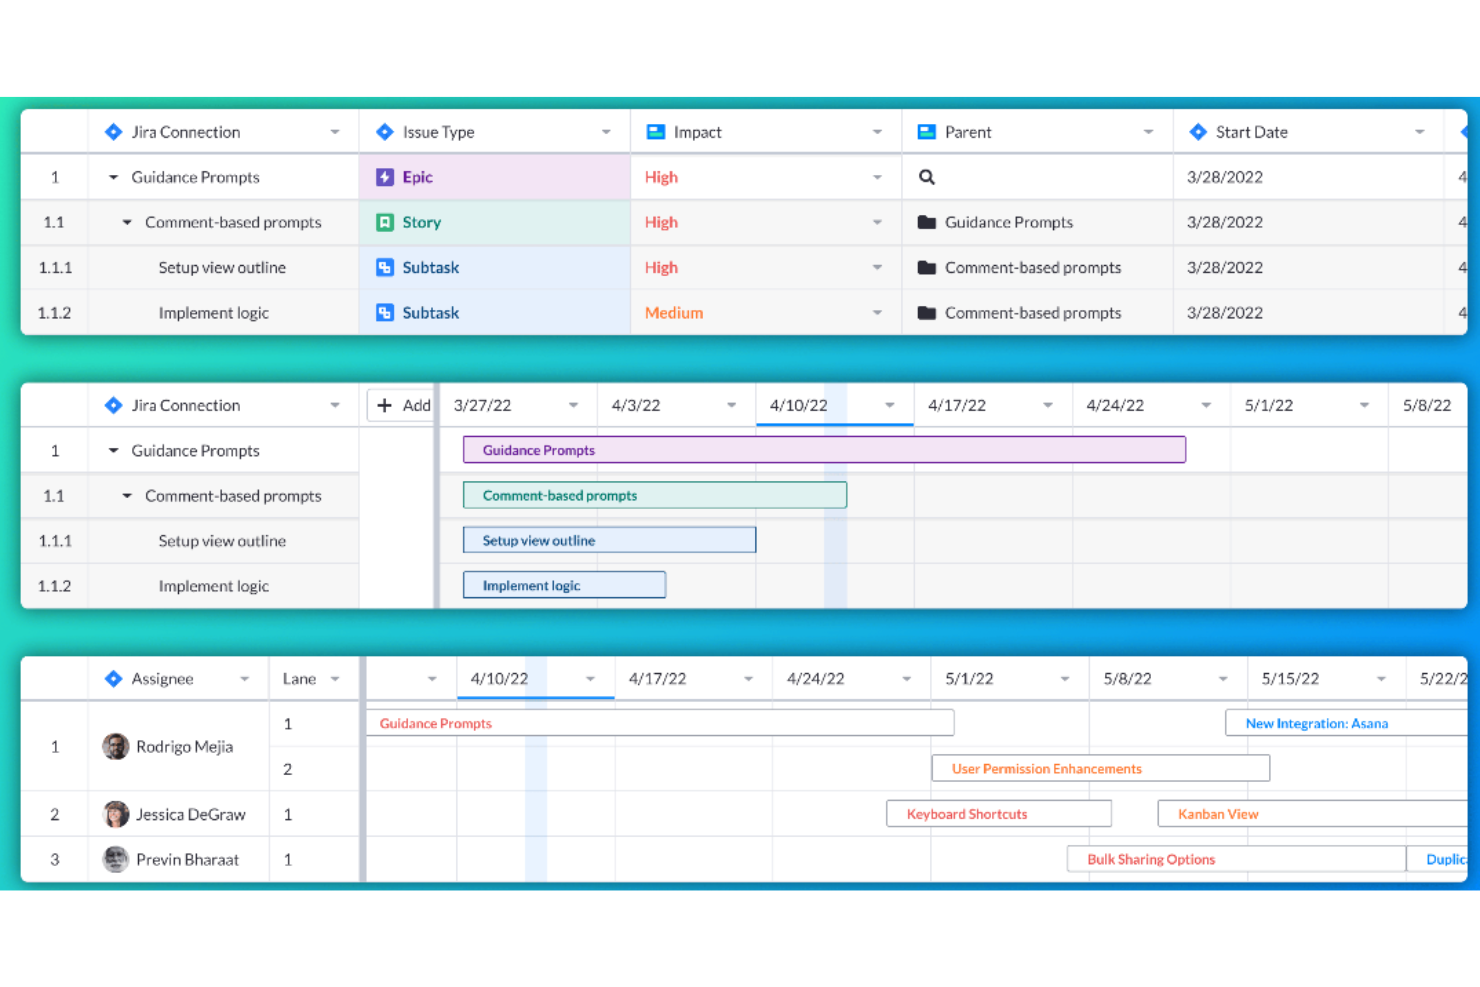
Visor is a workspace tool that connects to various SaaS applications, aiming to bring people together with data for a more collaborative work environment. It allows users to create custom views and visualizations of their nested Jira data, offering bi-directional integration with Jira for accurate and customizable sharing.
Visor operates as a workspace tool that enhances the functionality of SaaS applications by providing users with a unified view of their data. Visor also emphasizes secure sharing, featuring a straightforward drag-and-drop interface for ease of use. It additionally includes an advanced JQL importer and supports over 75 Jira field types, catering to a wide range of data management needs.
Moreover, Visor facilitates collaboration and communication among team members, with features such as Gantt charts, roadmaps, and the ability to customize views with colors and conditional formatting. This can save time and improve the efficiency of project planning and reporting processes.
Visor integrates with Salesforce, Jira, and HubSpot.
Pricing for Visor starts from $9/user/month.


This is a business analytics solution that lets you connect, model, and then explore raw data in order to create reports using built-in or from-scratch visuals and learn from actionable insight. Power BI features interactive data visualizations, robust semantic models, an application lifecycle management (ALM) toolkit, an open connectivity framework, and more.
As far as out value for cost evaluation criteria goes, Power BI stands out. Why? Paginated and interactive reports can be made available for personnel inside or outside your organization without having to purchase additional licenses. Power BI Desktop is also free to use.
A few notes: Jumping into Power BI with limited Excel experience/skill will result in a steep learning curve for the user. Also, note that a Pro Account dashboards can only be shared with and viewed by other Pro Account holders within your organization.
As you can imagine, this Microsoft owned software integrates well with other Microsoft products like Excel, as well as Salesforce CRM, SQL Server Database, Oracle Database, IBM databases, Amazon Redshift, Google BigQuery, Google Analytics, Adobe Analytics, Facebook analytics, and others.
Power BI starts at $9.99/user/month and has a free 60-day trial.
Diğer Seçenekler
Araştırmam sırasında listeye girememiş ancak yine de anılmayı hak eden birkaç araç buldum.
- Logi Analytics
Out-of-the-box embedded business analytics tool for software teams
- Coefficient
For integrating data into spreadsheets
- InetSoft
Data intelligence tool for scalable architecture and advanced modeling
- Metric Insights
Enterprise BI portal builder
- Exago BI
Business intelligence reporting tool for beginners and non-technical folks
- Izenda
Business intelligence software for embedding in web-based applications
- ClickUp
For BI tool integrations
- Klipfolio
Intuitive data visualization software for companies of all sizes.
- Funnel
Easy to understand and manipulate marketing and advertising data.
- Improvado
150+ integrations – like Facebook Ads, Google Analytics, YouTube and LinkedIn – to plot all marketing initiatives on one dashboard.
- AgencyAnalytics
SEO, PPC, social, email, review and call tracking dashboards all-in-one system.
- AnswerRocket
A searchable database of statistics and reports that is designed to answer questions of the everyday user.
- Tray
An iPaaS solution with API integration, CSV automation and an easy drag-and-drop workflow.
- ClicData
A business intelligence platform complete with a data warehouse, processing and management, dashboard designer and automation.
- BrightFunnel
Easy to understand and manipulate marketing and advertising data.
- Adaptive Insights
Modernized planning, modeling, budgeting, and forecasting tools.


How I Evaluate Business Intelligence Tools
I look at every BI tool through two lenses: the baseline requirements—connectors, dashboards, self-service reporting—and the differentiators that matter for PMO teams managing portfolio-level data.
Core Functionality (Table Stakes For This List)
When I'm selecting tools for my list, I rank each one on a scale from 0 (does not offer the functionality) to 5 (excels in this area) for each core functionality listed below. Then, I calculate the tool's total score into a percentage. Each tool needs to achieve a minimum total score of 65% to be considered for inclusion.
- Data Connectors & Integrations: I check whether a tool can pull directly from PM platforms like Jira, Asana, or Smartsheet, plus databases and spreadsheets, without manual exports.
- Interactive Dashboards: Each tool should let you build filterable, drill-down dashboards—like clicking a red-flagged project to see which tasks are driving the delay.
- Data Visualization Options: I evaluate the range of chart types available, from Gantt-style timelines and heatmaps to burndown charts that map delivery against sprint targets.
- Ad Hoc Report Building: Project stakeholders constantly need one-off reports. I look for drag-and-drop builders with scheduling, so a PMO lead can set up a weekly status report once.
- Data Modeling & Transformation: Combining data from multiple sources matters. I evaluate whether you can blend, say, Jira velocity data with budget actuals from a spreadsheet into one model.
- Self-Service Analytics: The best BI tools let non-technical project managers explore data on their own. I look for guided exploration, governed datasets, and low-barrier entry points.
Once I have a list of tools that meet the criteria, I consider what sets each platform apart.
Differentiating Factors (What Sets Vendors Apart)
Here's how I compare and contrast different vendors:
Standout Features
AI-powered insights can flag budget overruns or delivery risks before a PMO lead spots them manually, so I evaluate how well each tool surfaces anomalies and forecasts trends. Embedded analytics also matter—being able to view a portfolio health dashboard inside Jira or Confluence keeps teams from context-switching. I look for collaborative annotations too, where stakeholders tag each other on a metric and trigger follow-up tasks directly from the dashboard.
Beyond Features
Total cost of ownership is a big one—I evaluate whether licensing separates viewers from creators, since a PMO with 50 report consumers and 3 builders shouldn't pay the same per-seat rate for everyone. Governance matters just as much, especially row-level security that restricts portfolio data by business unit or client. I also consider time-to-value: tools with pre-built project management dashboard templates get teams reporting weeks faster than platforms that require everything from scratch.
En İyi BI Araçlarını Nasıl Seçtim?
Öncelikle incelemelere ve kullanıcı puanlarına dayanarak popüler araçlardan oluşan geniş bir liste hazırladım. Ardından, deneyimlerimin bir BI aracının ihtiyaç duyduğunu gösterdiği temel özelliklere bakarak listeyi daralttım. Son olarak, değerlendirmemin temelini oluşturması için aşağıdaki kriterleri seçtim.
Kullanıcı Arayüzü (UI)
BI platformunuz, işletme verilerini analiz ettiğiniz ve veri modelleme yoluyla karar alma süreçlerini iyileştiren grafikler ile diğer görsel temsiller biçiminde kullandığınız bir yerdir. Bu nedenle arayüzün sade ve sezgisel olması, beyaz alanı iyi kullanması gerekir.
Kullanılabilirlik
Aracın öğrenilmesi ve ustalaşılması kolay olmalıdır. Örneğin Microsoft Power BI gibi araçlarda, analiz edilen bilgileri değiştirmek için grafik öğelerinde kullanabileceğiniz sürükle ve bırak arayüzü bulunur. BI aracında bunun gibi özelliklerin yanı sıra aracı daha hızlı kullanmanıza yardımcı olacak uygun destek belgeleri, eğitimler ve öğretici videolar da bulunmalıdır.
Özellikler ve İşlevsellik
Temel yönetim raporlama araçları özelliklerinin ve işlevlerinin kaçını sunuyor ve bunlar ne kadar güçlü? Özellikle şunları aradım:
- Özelleştirilebilir Gösterge Panelleri: En iyi BI çözümleri, birden fazla görselleştirmenin yanı sıra görselleştirmeleri birbirine bağlama (böylece tüm filtreler veya seçimler tüm görselleştirmeleri etkiler) ya da her birini bağımsız tutma olanağı sunan, tek ekranlı bir görünüm sağlar. Değişiklikleri gerçek zamanlı olarak yansıtmalı ve temel verilerin özelleştirilmiş görünümlerini oluşturmanıza olanak tanımalıdır.
- Ayrıntılı İnceleme ve Veri Filtreleri: Ayrıntılı bilgilere bakabilmek çok önemlidir. Buna açılır menüler, arama filtreleri ve dilimleyiciler gibi özelliklerin yanı sıra ayrıntılara inme ve ardından veri özetlerine geri dönme olanağı da dahildir.
- Müşteriler İçin Web Tabanlı Arayüz: Müşterilere yönelik raporlama çözümlerinin web tabanlı müşteri arayüzleri sunması en pratik seçenektir; çünkü bunları yönetmek, masaüstü tabanlı müşteri arayüzlerine kıyasla daha verimli ve kolaydır.
- Planlanmış ve Otomatik Raporlar: Araç, ilerlemeyi kolayca izlemenize yardımcı olmalıdır. Buna ekiplere gönderilecek otomatik güncellemeleri planlama, müşterilere otomatik raporlar gönderme ve önemli tarihlerden veya eşik değerlerden haberdar olmanızı sağlayacak otomatik bildirimler ayarlama olanağı dahildir.
- Yüksek Kaliteli Diyagram Oluşturma: Temel araçlar çubuk, çizgi, pasta, alan ve radar grafik türlerini içerir; daha gelişmiş diyagramlar ise ısı haritaları, dağılım grafikleri, balon grafikleri, histogramlar ve coğrafi haritaları içerir. En iyi raporlama araçları, bu görselleştirmelerin bir bileşimini kullanan diyagramlar oluşturmak için bunları karıştırıp eşleştirmenize olanak tanır.
Entegrasyonlar
Veri bağlayıcıları, bir BI platformundan en iyi şekilde yararlanmanıza yardımcı olur. Bunu gerçekleştirmenin bir yolu, SAP veya SAS gibi diğer bulut tabanlı yazılımlarla veri entegrasyonları kurmaktır. Bu nedenle hazır entegrasyonları, Zapier gibi üçüncü taraf yazılım toplama hizmetlerini ve API'leri kullanarak özel entegrasyonları arıyorum.
Fiyatlandırma
Araçlarla ilgili iş kararlarını etkileyen en önemli unsurlardan biri fiyatlandırmadır. Bu nedenle kullanım senaryoları, aylık fiyatlandırma planları ve size yardımcı olacak diğer bilgileri arıyorum. Örneğin, deneyebileceğiniz ücretsiz bir sürümünün veya ücretsiz deneme seçeneğinin olup olmadığını ya da şirket içinde kurulan bir çözüm olarak sunulup sunulmadığını inceliyorum.
BI Araçları SSS
Bu konu hakkında başkalarının sorduğu yaygın soruların yanıtlarını bulun.
İş zekâsı araçları, analitik yöneticilerinin stratejik karar alma süreçlerini yönlendirmesine nasıl yardımcı olabilir?
İş zekâsı araçları, veri toplama süreçlerini otomatikleştirerek ve panolar ile görselleştirmeler aracılığıyla gerçek zamanlı içgörüler sunarak analitik yöneticilerine yardımcı olur. Manuel raporlama yapmadan bölgeler arasındaki satışları hızlıca karşılaştırabilir, bütçeleri takip edebilir ve operasyonel sorunları tespit edebilirsiniz. Birçok platform, sonuçları tahmin etmek ve stratejiye yön vermek için tahmine dayalı modelleme ve senaryo planlama özellikleri sunar. Görselleri anlatımla birleştiren veri hikâyeleştirme sayesinde yönetici kararlarını şekillendirebilir ve ekipleri içgörü odaklı hedefler etrafında hizalayabilirsiniz.
Yerleşik iş ortamlarında iş zekâsı araçlarını uygularken karşılaşılan yaygın entegrasyon zorlukları nelerdir?
Entegrasyon zorlukları genellikle eski BT sistemlerinden, yalıtılmış verilerden ve tutarsız biçimlerden kaynaklanır. Eski ERP sistemleri veya kurum içinde geliştirilen veritabanları bulut tabanlı iş zekâsı araçlarına bağlanmakta zorlanabilir; bu da senkronizasyon hatalarına veya veri kaybına neden olabilir. Düşük kaliteli veriler raporları çarpıtabilirken katı güvenlik protokolleri erişimi geciktirebilir. Bu sorunu çözmek için verilerinizi denetleyin, BT ekibini sürece erkenden dahil edin, biçimleri standartlaştırın ve yerel bağlayıcılar, API desteği ve veri dönüştürme özellikleri gibi güçlü birlikte çalışabilirlik özelliklerine sahip iş zekâsı platformlarını seçin.
İş zekâsı araçları, iş yöneticileri için departmanlar arası iş birliğini nasıl destekler?
İş zekâsı araçları, herkesin erişebildiği tek bir doğru kaynağı sunarak ekipler arası iş birliğini kolaylaştırır. Yöneticiler, elektronik tablo sürümleri arasında geçiş yapmak yerine en güncel verilerle otomatik olarak güncellenen etkileşimli panolar oluşturabilir. Finans ve satış ekipleri ortak gelir tahminlerini inceleyebilirken operasyon ve İK ekipleri personel ihtiyaçlarını takip edebilir. Grafik açıklamaları, görev atamaları ve KPI uyarıları gibi özellikler yanlış anlaşılmaları azaltır, toplantıları daha verimli hâle getirir ve departmanların ortak hedefler doğrultusunda uyum içinde kalmasına yardımcı olur.
İş yöneticileri, iş zekâsı yazılımını kullanarak hangi performans ölçütlerini takip etmelidir?
Ölçüt seçiminiz iş hedeflerinize bağlıdır; ancak yaygın ölçütler arasında gelir artışı, net kâr marjı, müşteri edinme maliyeti, müşteri yaşam boyu değeri, müşteri kayıp oranı ve işletme giderleri bulunur. Proje odaklı ekipler için zamanında teslimat oranlarını veya kaynak kullanımını da takip edebilirsiniz. İş zekâsı araçları, bu ölçütleri gerçek zamanlı olarak izleyebilmeniz için otomatik panolar oluşturmayı kolaylaştırır. Bir ölçüt tercih ettiğiniz aralığın dışına çıktığında bildirimleri tetiklemek için özel eşikler belirleyin. Zaman içinde bu KPI’ları takip etmek, ilgilenilmesi gereken alanları hızla belirlemenize ve yeni girişimlerin etkinliğini ölçmenize yardımcı olur.
Orta ve büyük ölçekli bir kuruluşta iş zekâsı platformunun yatırım getirisini nasıl ölçersiniz?
Manuel raporlamadan kaynaklanan iş gücü azalması gibi somut tasarrufları ölçerek başlayın. Örneğin finans ekibi ayda 20 saat tasarruf ediyorsa bu, genel giderlerdeki azalmayı açıkça gösterir. Ardından daha hızlı ve doğru kararlar sayesinde elde edilen gelir artışlarını tahmin edin; buna yeni satışlar kazanmak veya daha iyi tahminlerle maliyetleri düşürmek örnek verilebilir. Daha az raporlama hatası, daha hızlı içgörüler ve daha yüksek veri kullanımı gibi ölçütleri takip edin. Yatırım getirisini hesaplamak ve devam eden yatırımı gerekçelendirmek için bu faydaları toplam maliyetlerle (abonelikler, entegrasyon, eğitim ve destek) karşılaştırın.