10 Una Lista del Mejor Software de Inteligencia Empresarial
Here's my pick of the 10 best software from the 20 tools reviewed.


Herramientas de Inteligencia Empresarial – Preguntas frecuentes
¿Qué es la inteligencia empresarial?
Business Intelligence o Inteligencia Empresarial es una solución tecnológica para clasificar, preparar, analizar y presentar datos de una manera que permita a la gerencia y a sus equipos tomar decisiones bien fundamentadas dentro de su lugar de trabajo.
¿Qué son las herramientas de inteligencia empresarial?
Las herramientas de inteligencia empresarial son cualquier software que recopila, procesa, analiza y muestra grandes volúmenes de datos dispersos, que pueden provenir de fuentes como documentos, formularios, imágenes, archivos, correos electrónicos, videos, códigos de sitios web y más.
¿Cuáles son las características populares en las herramientas de inteligencia empresarial?
Las herramientas de inteligencia empresarial pueden hacer muchas cosas, incluidas, entre otras, funciones populares, como informes ad hoc, métricas de rendimiento, visualización de datos, análisis de datos, paneles de informes, KPI y más.
¿Qué problemas ayudan a resolver las herramientas de inteligencia empresarial?
El software de informes ayuda a la administración y a sus equipos a tomar decisiones basadas en datos de marketing y publicidad. Ayudan a construir el departamento de indicadores clave de rendimiento, respondiendo a las preguntas “¿Dónde estamos ahora?” y “¿Dónde queremos estar?”. Los equipos pueden utilizar estos datos para determinar, “¿Cómo vamos a ir de A hasta B?”
¿No necesitas un generador de informes? Consulta nuestras otras listas de software para administrar equipos, recursos y proyectos:
- ¿No necesitas una suite completa de Intelgencia Empresarial? Dependiendo de lo que quieras medir, puedes comenzar con un mejor software de seguimiento de tiempo.
- ¿Quieres una descripción general de tus proyectos a nivel de cartera que combine administración, informes y más, en un mismo sitio? Entonces estás buscando un software de gestión de cartera de proyectos.
- ¿Quieres convertir tus informes en visualizaciones y presentaciones? Echa un vistazo al mejor software de mapas mentales para crear todo tipo de diagramas.
En esta reseña, quiero ayudarte a encontrar las mejores herramientas de inteligencia empresarial y otro software de informes.
Con el fin de ayudarte a elegir qué software de informes necesitas, compartiré las aplicaciones de inteligencia empresarial para que las incluyas en tu lista de herramientas analíticas y te explicaré qué son las herramientas de informes basadas en la web. Revisaré qué buscar en un tablero integral de inteligencia empresarial y responderé algunas preguntas frecuentes básicas sobre soluciones de inteligencia empresarial.
Compara y Evalúa Rápidamente el Mejor Software de Informes
Las herramientas de informes de inteligencia empresarial son muy confiables por una variedad de razones, que incluyen, entre otras, la capacidad de obtener información sobre el comportamiento del consumidor, convertir los datos en información procesable, mejorar la eficiencia, aumentar las ventas a través de una mejor inteligencia de marketing y una serie de otras motivaciones orientadas al crecimiento empresarial. Encontrarás software para realizar el descubrimiento de datos, realizar informes interactivos y profundizar en tus análisis de marketing: hay una herramienta para todo.
Todo se reduce a esta pregunta: ¿qué necesitas para asegurarte de que tu equipo tenga éxito en todos los aspectos del flujo de trabajo diario? Lo más probable es que el software de informes de datos adecuado pueda ayudarte a perfeccionar las fortalezas y debilidades de tu empresa y a hacer un plan para mejorar. Veamos algunos de los mejores programas disponibles.
Criterios Comparativos de Herramientas de Inteligencia Empresarial
- Interfaz de usuario (UI): ¿qué tan bien diseñada está? ¿Ofrece vistas claras y navegación intuitiva?
- Usabilidad: ¿Es fácil de aprender y dominar? ¿Hay tutoriales y capacitación? Para las herramientas de informes empresariales, deberían ofrecer varios tipos de soporte técnico al usuario para ayudar a incorporar a varios miembros de tu organización.
- Características y funciones: ¿Cuántas de las características y funciones clave de las herramientas de informes de administración brinda y qué tan potentes son? Específicamente, busqué:
- Tableros personalizables: las mejores soluciones de Inteligencia Empresarial ofrecen una visualización de pantalla única con múltiples visualizaciones, junto con la capacidad de interconectar las visualizaciones (de modo que cualquier filtro o selección afectará a todas las visualizaciones) o mantener cada una como independiente. Debe reflejar los cambios en tiempo real y permitirte crear pantallas personalizadas de datos clave.
- Desglose y filtros de datos: incluye características tales como menús desplegables, filtros de búsqueda y segmentaciones de datos, así como la capacidad de profundizar en los detalles y realizar copias de seguridad de los resúmenes de datos.
- Interfaz basada en web para clientes: es más simple si las soluciones de informes orientadas al cliente ofrecen interfaces de cliente basadas en web, ya que es más eficiente y más fácil de administrar que las interfaces de cliente basadas en versiones de escritorio.
- Informes programados y automatizados: la herramienta debería ayudarte a monitorear fácilmente el progreso. Esto incluye la capacidad de programar actualizaciones automáticas para enviarlas a los equipos, enviar informes automáticos a los clientes y configurar notificaciones automáticas para conocer las fechas clave.
- Diagramación de alta calidad: las herramientas básicas incluyen barras, líneas, sectores, tipos de gráficos de radar y área, y los diagramas más avanzados incluyen mapas de calor, diagramas de dispersión, gráficos de burbujas, histogramas y mapas geoespaciales. Las mejores herramientas de informes te permiten mezclar y combinar para crear diagramas que utilicen una combinación de estas visualizaciones.
- Integraciones: ¿Es fácil conectarse con otras herramientas? Las herramientas de análisis empresarial deben ofrecer muchas integraciones por defecto para utilizar los datos del proyecto de tus diversas herramientas, junto con capacidades de importación y exportación bastante fluidas.
- Relación calidad-precio: ¿Cuán apropiado es el precio según sus características, capacidades y usos? ¿Los precios son claros, transparentes y flexibles?
The Digital Project Manager es financiado por sus lectores. Cuando haces clic en los enlaces de nuestro sitio, podríamos ganar una comisión. Más información.
-

monday.com
Visit WebsiteThis is an aggregated rating for this tool including ratings from Crozdesk users and ratings from other sites.4.7 -
Jira Software
Visit WebsiteThis is an aggregated rating for this tool including ratings from Crozdesk users and ratings from other sites.4.2 -
Wrike
Visit WebsiteThis is an aggregated rating for this tool including ratings from Crozdesk users and ratings from other sites.4.2


Descripción General de las Mejores Herramientas de Inteligencia Empresarial
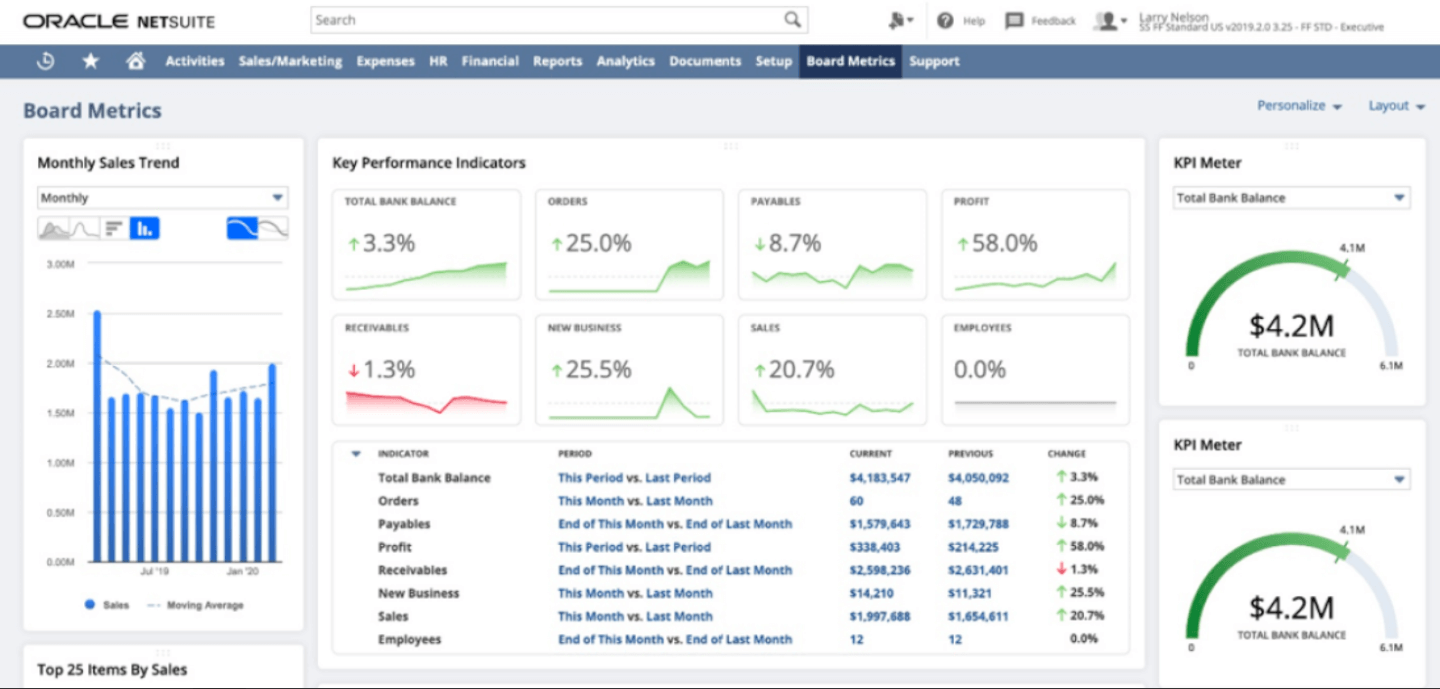
NetSuite is a cloud BI ERP business software solution. The tool combines financial information, dashboards, reporting features, predictive analytics, and other features to provide a complete set of BI functions.
NetSuite allows users to automate project creation when specific services are sold and automatically track percent complete, time budget, and time spent on project tasks. Reports for utilization and backlog help analyze employee workloads and efficiency for business users.
NetSuite’s Project Management module seamlessly integrates with the NetSuite accounting system. In addition to project management and time and expense tracking, you can create and issue invoices, compare project performance to budgets and other metrics. NetSuite Project Management module manages revenue recognition, expenses, unbilled balances, and other project-related financials.
Other key capabilities include Multiple Project Types, Automate Job Creation, the Project Center, Timesheets, Mobile Time and Expense, Performance Measurement, and Project Tracking Reports.
Pricing for NetSuite is available upon request.

Zoho Analytics is a great business intelligence tool for small businesses, given their large feature set, simple interface, and affordable pricing for a small number of users.
This tool lets you pull data from a wide range of sources and build out intuitive and functional reports in order to analyze the visualized data. AI assistant “Zia” will answer questions typed into a query box using the data collected, combined with machine learning and natural language processing technologies.
Zoho Analytics takes the prize for my favorite in features and functionality. While most of the software reviewed here can sport a robust BI system, Zoho goes above and beyond with features like their AI assistant, their focus on ease of collaboration, tons of third party integration options, and Android and iOS mobile apps.
A few minor cons for Zoho include that the SQL tutorials could be built out a little bit better. Additionally, the reporting pivot view/summaries would benefit from having an “OR” or “CONTAINS” command in order to better pull out the data that you need.
They have integrations with Zoho Analytics, SAlesforce CRM, Microsoft Dynamics CRM, Hubspot CRM, Mailchimp, Google Analytics, Bing Ads, Zoho Surveys, Survey Monkey, Facebook, TWitter, YouTube,QuickBooks, Xero, Shopify, Zendesk, and more.
Zoho Analytics starts from $24/month for 2 users and has a free 15-day trial.
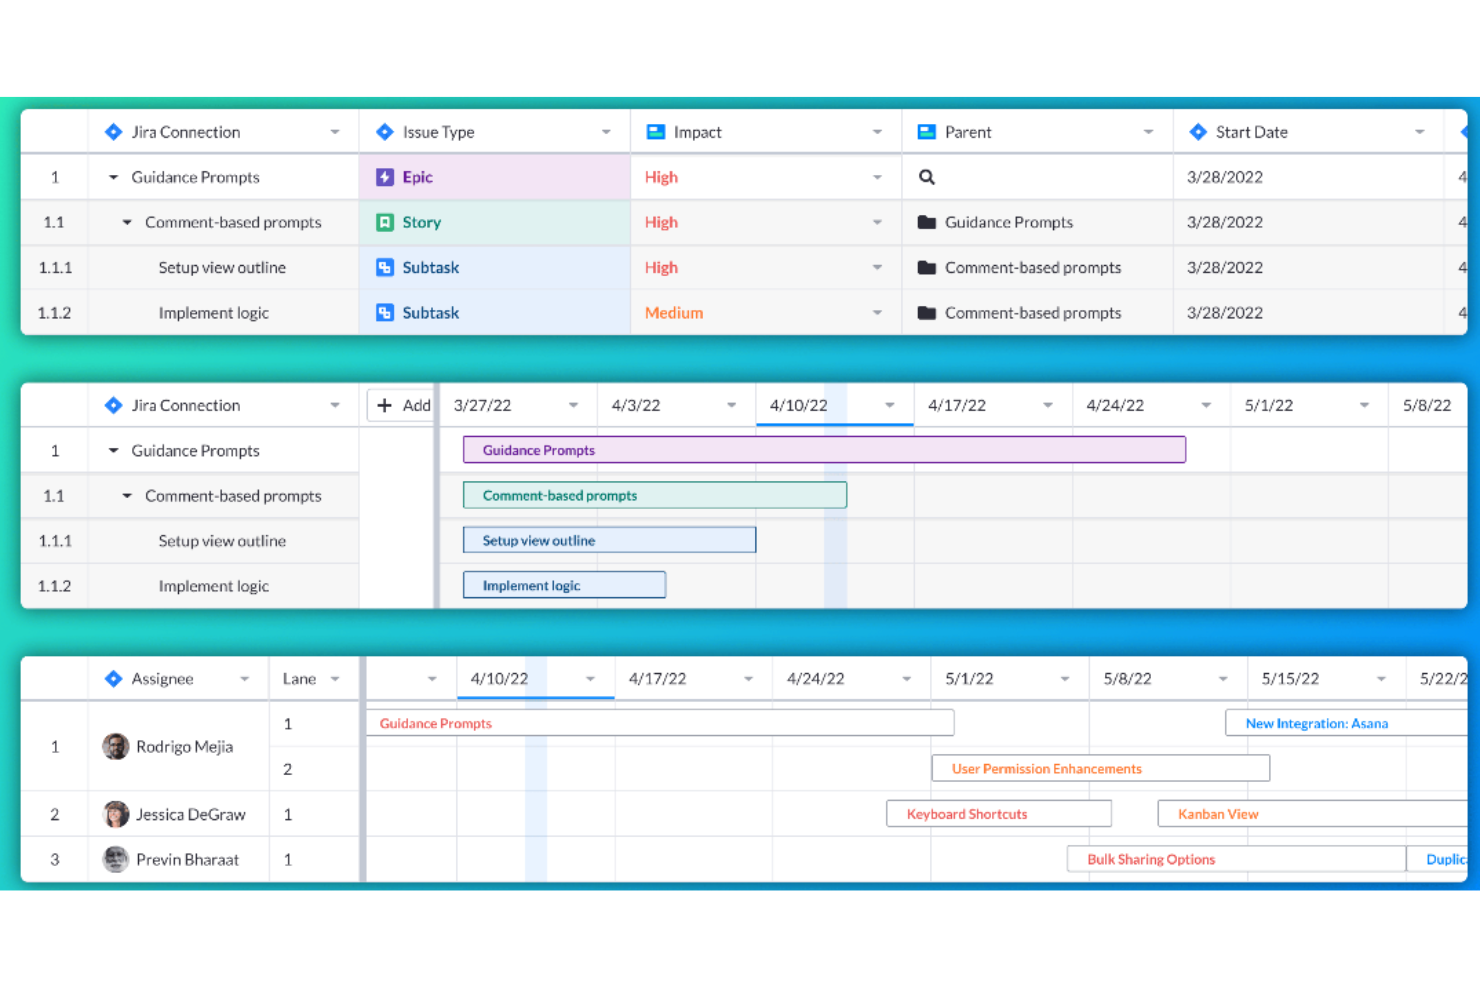
Visor is a workspace tool that connects to various SaaS applications, aiming to bring people together with data for a more collaborative work environment. It allows users to create custom views and visualizations of their nested Jira data, offering bi-directional integration with Jira for accurate and customizable sharing.
Visor operates as a workspace tool that enhances the functionality of SaaS applications by providing users with a unified view of their data. Visor also emphasizes secure sharing, featuring a straightforward drag-and-drop interface for ease of use. It additionally includes an advanced JQL importer and supports over 75 Jira field types, catering to a wide range of data management needs.
Moreover, Visor facilitates collaboration and communication among team members, with features such as Gantt charts, roadmaps, and the ability to customize views with colors and conditional formatting. This can save time and improve the efficiency of project planning and reporting processes.
Visor integrates with Salesforce, Jira, and HubSpot.
Pricing for Visor starts from $9/user/month.
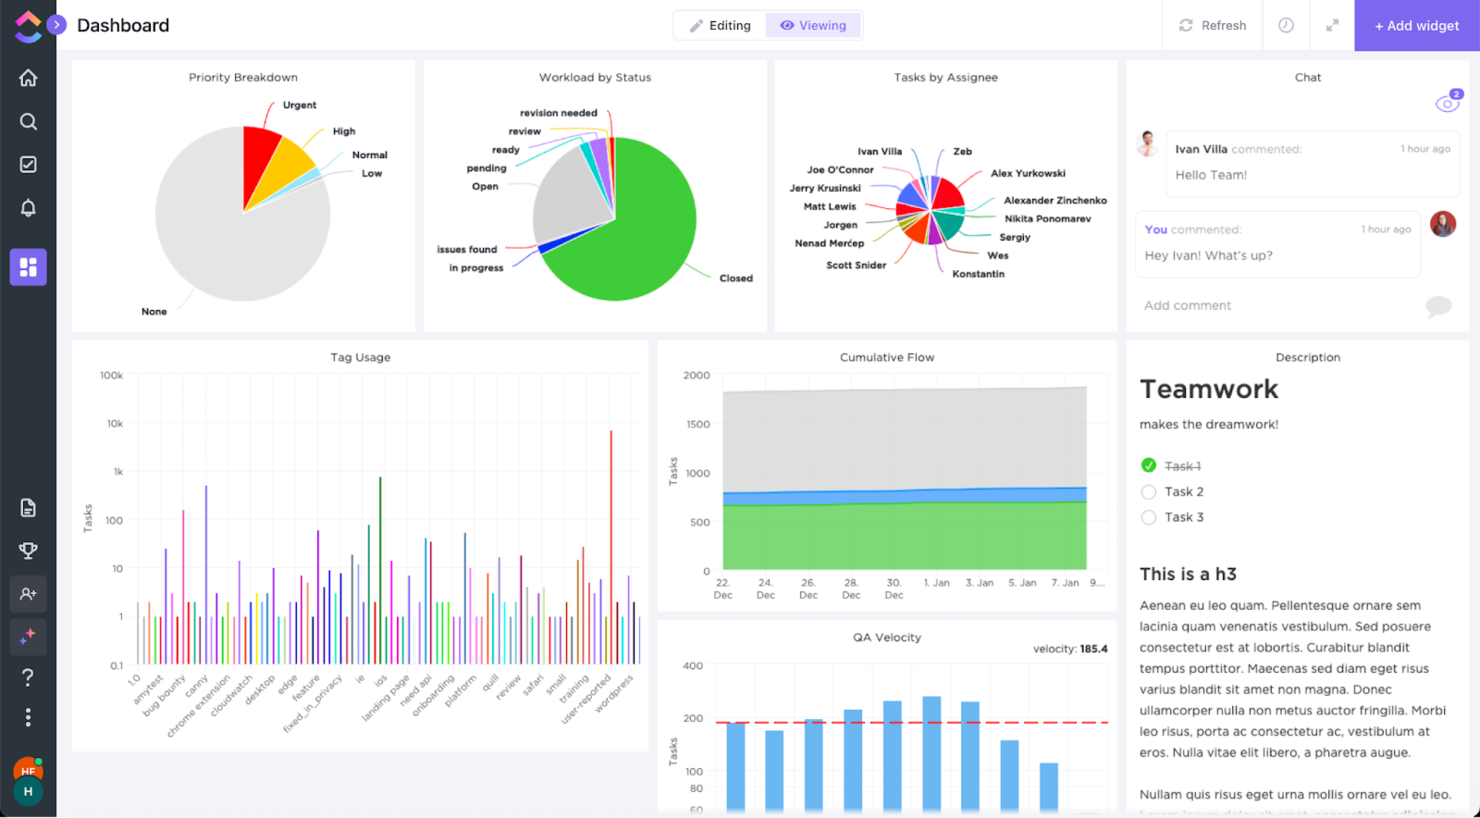
ClickUp is a project management software powerhouse that has the functionality to pull tons of data from within the software and display it in the beautiful graphs you see on the screenshot above. Although not a BI tool by nature, it can definitely inform your decisions.
However, I have to say that ClickUp has recognized that it cannot compete with BI tools with the product as is. For that reason, they have an integration with Tableau. This integration allows Tableau to grab a screenshot of one of your ClickUp spaces and aggregate it on their end with all the rest of your business data.
ClickUp offers native integrations with Tableau, Slack, Google Suite, Dropbox, and many more tools, as well as over 1,000+ integrations through Zapier.
ClickUp is free with limited storage for an unlimited number of users. Paid plans start at $5/user/month and offer a free trial.

Datapine is a great business intelligence software as it combines simple, intuitive usability with advanced analytics capabilities. The self-service BI solution empowers business users and data analysts alike to generate actionable business insights and make well-informed data-driven decisions.
Datapine is a comprehensive BI Suite, that offers all needed features within your analytics journey. First of all, you can connect literally any kind of data source (databases, flat files, CRM and ERP-systems, marketing, social media or helpdesk data, etc.) with a few clicks. Optionally, you can store connected data in their high-speed data warehouse to increase querying speed. The analyzer section in the screenshot above is the core part of the product, where data analysis and visualizations are done. Besides doing analysis and building charts by drag and drop, here you will find also advanced features like drill-downs, conditional formatting, trend identification, or predictions.
Additional strengths of datapine are their dynamic, interactive business dashboards. They offer a wealth of innovative dashboard features and have a large dashboard gallery, providing over 80 dashboard templates for different areas of applications (business functions, industries, platforms). Dashboards can be shared easily in multiple ways, including, among others, automatic email reports, sharing via URL, or advanced embedding options.
Datapine offers a 14-day free trial without any limitations with custom pricing starting at 250$ per account.

Tableau is a robust, scalable analytics platform with desktop, cloud or on-site options. It boats an interactive, visual analysis style and allows you to securely consume your data via browser, desktop, mobile, or embedded into any application. They offer over 900 learning resources, including over 100 training videos.
They excel in a specific area of the features and functions evaluations criteria section: flexibility. Tableau is easily scalable; offered by server, desktop and/or cloud; available on all device types, be it PC or smartphone; and they have free analytics resources for students, educators and smaller not-for-profits. Whatever your niche, you are sure to find something that fits.
Tableau can join with data collection systems like ServiceNow, Splunk, and Google Analytics. Other integrations, or “Technology Partners as they call them, include 0xdata, AIMMS, Aircloak, AllSight, Amazon Web Services, Astera, Axiomatics, Birst, Datawatch,
Element Analytics, Google Cloud Platform, IBM, Microsoft, and many, many more.
The pricing is a bit steep to begin with and costs go up at the end of the year long contract. Multi-year contracts are not available, so they got dinged in our value for cost section because of the high and shifting price schema, which can come across as predatory.
Tableau starts at $70/user/month and has a free 14-day trial.
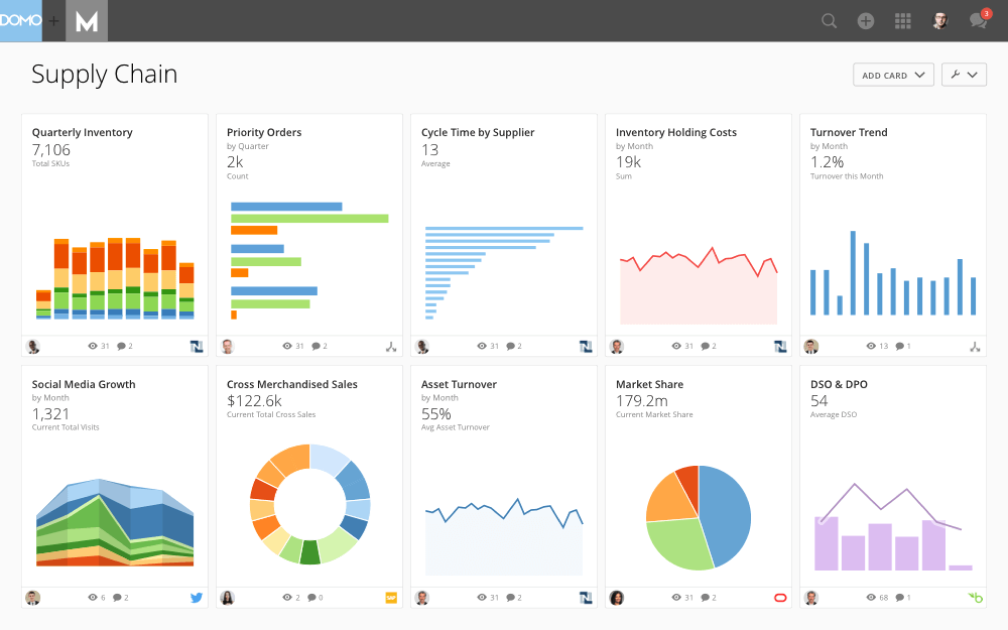
The Domo Business Cloud is a platform that lets you aggregate data from multiple sources and build custom workflow apps. Their features include dashboards and reporting, machine learning, predictive analytics, and external self-service reporting.
I like the focus that Domo places on your external relationships with vendors and other stakeholders. The name is Domo Everywhere, and it’s a feature that lets you build portals for your external partners. Therefore, they can analyze the data you decide to share with them on their own and draw their own insights.
Further, the data visualization boards are independent widgets that can be edited, filtered, and resized with a couple of clicks. Lastly, the platform allows you to set permissions on both internal and external users, regardless of the account (Domo or not Domo).
Domo integrates with external data sources through their 1000+ pre-built connectors, which include Shopify, Salesforce, Amazon S3, Adobe Analytics, Sharepoint, and Survey Monkey.
Domo has a free trial available, and prices can be quoted upon request.

Create easy-to-read reports and visual oriented interactive dashboards that display data-rich actionable insight for defining business metrics, locating value, and discovering interconnectivity between tables. Resources and features include custom applications, embedded visualizations, data science workflows, the ability to host on Public Clouds (like AWS and GCP), and more.
They offer a free interactive training course and many other tutorial-like resources, which is why I was able to score them so highly in the usability section of the evaluation criteria. Beneath the “Getting Started” tab, you’ll notice that they have plenty of self-help resources for viewing raw data, building tools, and developing models.
The downfall of this software is that writing the queries is not incredibly user friendly. On top of that, data analytics tasks take a significant amount of time to render and run queries. When it comes to , it may get sluggish.
They connect with databases from Redshift, Snowflake, BigQuery, as well as 50+ supported SQL dialects like Amazon Redshift, Google BigQuery, Snowflake, MySQL, Oracle, Amazon Athena, Amazon Aurora, and more.
Looker starts at $3,000/month for 10 users ($50/additional user) and has a free demo.
Sisense
Best business intelligence API for building analytics into your products and tools

A hybrid-cloud platform built to leverage all of your data together and make it available to you through interactive dashboards, self-service analytics, and/or white-labeled BI apps. They offer support, analytics, and reporting for business areas such as customer service measurables, digital marketing, finances, human resources, retail and eCommerce, IT analytics, and more.
As far as our usability and UI evaluation criteria expectations, I found that Sisense is easy to use, easy to instal and setup, and sports an intuitive interface and streamlined UX. The customer service team is responsive and adaptive so this would be a decent choice for companies with lower levels of technology experience who might need some extra assistance.
A few cons include that the marketing connector could be more robust. Also, some functions are so simplified that they get in the way, for example not having to write a query seems like a time saving mechanism until your needs don’t match their pre-existing data and you have to jump through hoops to find a creative solution to get what you need.
Use ODBC to connect directly to Sisense’s powerful back-end from any third party application you like, from Excel to popular data visualization and reporting tools. They also offer a marketplace for extensions and plug-ins that they or their partners provide for use. Some are available free and others are only available with a premium account.
Sisense offers custom pricing and has a free demo as well as a free trial.
Exago BI
Best business intelligence reporting tool for beginners and non-technical folks
Award-winning ease of use as well as advanced functionality means that Exago is great for both non-technical users and experts alike. You can determine what set of features each user has access to, offering solutions like a library of standard customizable reports, a drag-and-drop ExpressView designer, and a spreadsheet-organized Advanced Report builder. Build, format and export reports at any technical skill level.
Exago perfectly balances our evaluation criteria needs for value for cost and stand-out usability. It is relatively inexpensive, very flexible, easy to deploy, and intuitive to learn and use for the end user.
They integrate with your software in what they call “stealth mode”, offering an open API, fully configurable CSS, single sign-on authorization, and programmatic extension points.
While great for small or static teams, Exago’s software can't scale with you so it won’t do well for companies that expect to expand over time. Another con is that it is somewhat lacking features like a broader variety of data manipulation functions, multi selection in a parameter, and the ability to use mssql over mySQL.
Exago offers custom pricing and has a free 30-day trial.
Resumen de las Mejores Herramientas de Inteligencia Empresarial
| Tools | Price | |
|---|---|---|
| NetSuite | Pricing upon request | Website |
| Zoho Analytics | From $24/month | Website |
| Visor | From $9/user/month | Website |
| ClickUp | From $7/user/month | Website |
| datapine | From $249/month | Website |
| Tableau | From $70/user/month | Website |
| Domo | Pricing upon request | Website |
| Looker | Pricing upon request | Website |
| Sisense | Pricing upon request | Website |
| Exago BI | Custom pricing | Website |
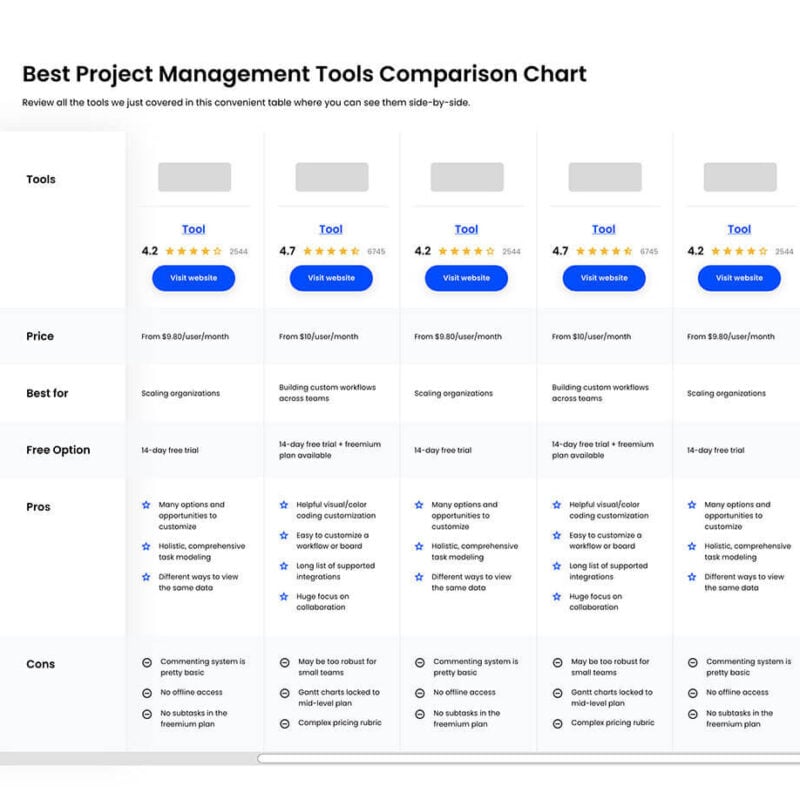
Compare Software Specs Side by Side
Use our comparison chart to review and evaluate software specs side-by-side.
Compare SoftwareOtras Aplicaciones Para Informes
En mi investigación, encontré algunas herramientas que no lograron lista pero que merece un saludo sin embargo. La siguiente lista de herramientas de informes son mis menciones honoríficas para esta ronda:
- ClicData
Best for building and embedding dashboards in your applications
- InetSoft
Best data intelligence tool for scalable architecture and advanced modeling
- Logi Analytics
Best out-of-the-box embedded business analytics tool for software teams
- Power BI
Best business intelligence solution for Microsoft users
- Metric Insights
Best enterprise BI portal builder
- Izenda
Best business intelligence software for embedding in web-based applications
- Improvado
150+ integrations – like Facebook Ads, Google Analytics, YouTube and LinkedIn – to plot all marketing initiatives on one dashboard.
- Funnel
Easy to understand and manipulate marketing and advertising data.
- Klipfolio
Intuitive data visualization software for companies of all sizes.
- ClicData
A business intelligence platform complete with a data warehouse, processing and management, dashboard designer and automation.


¿Necesitas Ayuda Para Reducir las Opciones?
Esta herramienta es bastante útil. Nos hemos asociado con Crozdesk para brindarte acceso a su “Buscador de software”.
Si ingresas algunos de los detalles sobre tu proyecto y las funciones que buscas en una herramienta de administración de proyectos, generará una lista de herramientas que coinciden con tus preferencias. Sólo debes proporcionar tu correo electrónico y te enviarán una bonita guía en PDF con un resumen de las mejores coincidencias.
¿Qué Opinas de Esta Comparación de Herramientas de Informes?
Atrás quedaron los días en que los sistemas de inteligencia empresarial estaban dominados por IBM y Siebel (ahora Oracle), como fuera a fines del siglo XX. Ahora, tienes una gran cantidad de herramientas de informes de datos disponibles a tu disposición. Ya sea que necesites ordenar, recuperar, visualizar o informar datos, siempre habrá algo que satisfaga tus necesidades.
Espero que esta comparación de herramientas de informes te haya ayudado a descubrir qué tipo de software sería el adecuado para tu empresa. Es un trabajo en progreso y lo actualizaré regularmente.
El software de generación de informes puede amplificar tus esfuerzos de marketing al proporcionarte los datos necesarios para tomar decisiones clave en el futuro. Asegúrate de contar con las herramientas necesarias para respaldar estos esfuerzos para así hacer crecer continuamente tus operaciones comerciales basadas en datos del mundo real que sean relevantes para ti y para tus clientes.
¿Olvidamos tu programa de aplicación de informes preferido? Si ese fue el caso, dinos en los comentarios y le echaremos un vistazo.